 ,1, 郑瑞杰,2, 赵永廉3, 曹庆芹1,4, 秦岭1,4, 邢宇,1,4
Genetic Diversity Evaluation of Castanea in China Based on Fluorescently Labeled SSR
NIE XingHua,1, ZHENG RuiJie,2, ZHAO YongLian3, CAO QingQin1,4, QIN Ling1,4, XING Yu,1,4通讯作者:
责任编辑: 赵伶俐
收稿日期:2020-07-2接受日期:2020-09-15网络出版日期:2021-04-16
| 基金资助: |
Received:2020-07-2Accepted:2020-09-15Online:2021-04-16
作者简介 About authors
聂兴华,Tel:18813011218;E-mail:

摘要
关键词:
Abstract
Keywords:
PDF (4109KB)元数据多维度评价相关文章导出EndNote|Ris|Bibtex收藏本文
本文引用格式
聂兴华, 郑瑞杰, 赵永廉, 曹庆芹, 秦岭, 邢宇. 利用荧光SSR分子标记评估中国栗属植物遗传多样性[J]. 中国农业科学, 2021, 54(8): 1739-1750 doi:10.3864/j.issn.0578-1752.2021.08.013
NIE XingHua, ZHENG RuiJie, ZHAO YongLian, CAO QingQin, QIN Ling, XING Yu.
开放科学(资源服务)标识码(OSID):

0 引言
【研究意义】目前世界公认的栗属植物有板栗(Castanea mollissima Bl.)、锥栗(Castanea henryi (Skam) Rehd. et Wils.)、茅栗(Castanea seguinii Dode)、日本栗(Castanea crenata S. et Z.)、欧洲栗(Castanea sativa Mill.)、美洲栗(Castanea dentata (Marsh.) Brokh.)和美洲榛果栗(Castanea pumila Mill.)7个种[1]。20世纪以来,墨水病和栗疫病严重打击了曾经盛极一时的欧洲栗和以材用为主的美洲栗,造成欧洲栗出现生产危机和几乎全境的美洲栗濒于灭绝[2]。中国分布板栗、茅栗、锥栗和日本栗(辽东栗)4个种的资源,且分布十分广泛,跨越温带、暖温带和亚热带,同时我国栗属资源对栗疫病、墨水病等表现出较好的抗性,具有最为丰富的遗传多样性[2,3]。由于长期的自然和人工选择,中国栗属植物不仅具有很高的食用品质,还为世界各地栗属植物的基因改良提供了重要的来源,在世界栗属种质资源中占有不可代替的地位[4]。因此,了解中国栗属种质资源的亲缘关系,评估各种间资源的遗传多样性和群体遗传结构,对栗属植物优异种质的创新与开发有重要的意义。【前人研究进展】目前,研究者们已经开发出了诸多第二代和第三代分子标记,并将其广泛应用于植物的遗传多样性、遗传图谱和基因组分析中[5,6,7]。例如随机扩增的多态性DNA(RAPD)、限制性片段长度多态性(RFLP)、简单序列重复(SSR)和三代标记单核苷酸多态性(SNP)等。其中,SSR串联重复序列的突变率非常高,能形成高度多态的等位变异[8]。此外,SSR标记具有共显性、稳定性和可重复性,可从物种的基因组和转录组测序中开发获得。在栗属植物的最新研究中,SSR主要用于遗传多样性研究、关联分析和遗传图谱的构建等领域。INOUE等[9]利用17个SSR标记成功进行了中国板栗、日本栗和欧洲栗跨种间的扩增,3个物种中的65个样品表现出相当高的遗传多样性。JIANG等[10]对中国10个省的95个板栗品种进行基于SSR的分析,评估了中国板栗的遗传多样性,遗传结构模式和连锁不平衡(LD)。MULLER等[11]利用24个SSR标记对272个美洲栗个体进行基因分型,发现了5个特异的位点与种群所在地的环境变量存在显著的相关性。KUBISIAK等[12]创建了一个基于转录组测序开发的330个SSR和1 071个SNP标记组成的板栗遗传图谱,通过QTL关联分析筛选获得3个抗病区段。此外,刘国彬等[13]利用13对SSR分子标记对北京怀柔区的33株明清古板栗树进行了指纹图谱构建。【本研究切入点】中国作为栗属植物的遗传多样性中心,丰富的栗属植物资源在农业生态建设和区域农业经济创收方面发挥着重要作用。但栗属植物优异种质的开发与利用还有很大的局限性,以往的研究多集中在单个种的遗传多样性,而对中国栗属植物的遗传多样性研究相对较少。【拟解决的关键问题】本研究利用高质量的SSR标记评估96份中国栗属植物资源的遗传多样性,并解析不同栗属种质资源的亲缘关系、群体遗传结构和遗传背景,为栗属植物优异种质的创新与开发提供理论依据。1 材料与方法
1.1 筛选引物的材料
试验中筛选引物所需的12份板栗品种材料于2019年在北京市怀柔区板栗技术试验与推广站进行选取(电子附表1)。Table 1
表1
表1供试材料的地理分布
Table 1
| 资源分类Germplasm type | 总数量Accession amount | 来源Origin | 数量Number |
|---|---|---|---|
| 板栗种群POP 1 | 50 | 中国陕西 Shaanxi, China | 6 |
| 中国北京 Beijing, China | 11 | ||
| 中国河北 Hebei, China | 3 | ||
| 中国山东 Shandong, China | 10 | ||
| 中国湖北 Hubei, China | 10 | ||
| 中国云南 Yunnan, China | 3 | ||
| 中国浙江 Zhejiang, China | 4 | ||
| 中国江苏 Jiangsu, China | 2 | ||
| 中国广东Guangdong, China | 1 | ||
| 锥栗种群POP 2 | 13 | 中国福建 Fujian, China | 13 |
| 茅栗种群POP 3 | 19 | 中国湖南Hunan, China | 7 |
| 中国江西 Jiangxi, China | 1 | ||
| 中国湖北 Hubei, China | 2 | ||
| 中国安徽 Anhui, China | 9 | ||
| 日本栗种群POP 4 | 14 | 中国辽宁/日本 Liaoning, China/Japan | 14 |
| 合计 Total | 96 |
新窗口打开|下载CSV
1.2 试验材料
试验中供试材料于2019年在我国不同地区的资源圃和野外进行收集,共计96份(表1、电子附表2),包括板栗、锥栗、茅栗和日本栗4个种。其中板栗50份,采自北京市怀柔区板栗技术试验与推广站;锥栗13份,采自福建省建瓯市锥栗接穗圃;野生茅栗资源19份,采自安徽、江西、湖南和湖北等省的野外;日本栗14份,采自辽宁省经济林研究所栗属植物资源圃。每份材料采集嫩叶6片,液氮处理后,保存于-80℃超低温冰箱备用。Table 2
表2
表212对高质量SSR标记的信息表
Table 2
| 序号 Number | 标记名 Marker ID | DNA序列号 GenBank ID | 上游引物 Forward primer (5′-3′) | 下游引物 Reverse primer (3′-5′) | 观察基序 Repeat motif |
|---|---|---|---|---|---|
| 1 | CmSI0396 | 290474606 | AACTCCCACCACTCACATCC | TTTCGGACCATCCAGAACTC | CACACC |
| 2 | CmSI0561 | 290474702 | CGTATAGGGTGGAAACGGAA | GGACAAGCAAATCACGGAAT | TCG |
| 3 | CmSI0614 | 290476556 | TTGTGGTGAAGCTGACATCG | GGGTACTACCACAACATGCAG | GTT |
| 4 | CmSI0658 | 290474781 | AAAACGGTTTGTGGTGAAGC | GCCAACCAGTCAAGGGTACT | GTT |
| 5 | CmSI0702 | 290474818 | GAAACACACCAGAGAGATGCAG | TTTTATACAGAGACATACTATCCTACACAG | TC |
| 6 | CmSI0742 | 290474850 | GACGCTCCTCAGCTTTTGAC | TGCCGGTCAATTCTTCTTCT | AG |
| 7 | CmSI0800 | 290474899 | TTATGGCAACCCTCCTGTTT | CTGAAATGATCGATGCTGCT | TC |
| 8 | CmSI0853 | 290474950 | GGAGGAGGAGGAGCTCATTG | CCTTGGAGAGCTGCCAGTAG | TCT |
| 9 | CmSI0871 | 290474967 | AGGGGGTGGAAGAACCTATG | AGATTGCAAGTGGGGAATTG | TCT |
| 10 | CmSI0883 | 290476060 | CAGCATCAGCACTCGTTCA | GGGATTGAGAGGATGAAGCA | AGC |
| 11 | CmSI0922 | 290475011 | AATCTGAACCCCTCCGATCT | ACCAACAACATGTGCCAAAA | TTG |
| 12 | CmSI0930 | 290475019 | CCATTTAGCATGCATAGTCATACC | GCAAGGATGTAGGTCGAATCA | ATAC |
新窗口打开|下载CSV
1.3 方法
1.3.1 DNA提取 板栗基因组DNA提取方法采用本实验室的CTAB改良方法[14]。提取DNA后,使用1%琼脂糖凝胶电泳和Nano Drop One分光光度计(Thermo Fisher Scientific,USA)分别测试DNA的质量和浓度。然后将每份DNA的浓度稀释至20—50 ng?μL-1以备PCR扩增使用。1.3.2 EST-SSR分子标记的来源 SSR分子标记来源于美国林木基因组(https://www.hardwoodgenomics. org/)公布的中国板栗EST-SSR库。利用聚丙烯酰胺凝胶电泳检测技术对数据库中的330个EST-SSR标记进行初筛,引物由擎科生物科技有限公司合成。
1.3.3 普通SSR-PCR扩增体系 PCR扩增采用10 μL反应体系:4 μL ddH2O,4 μL TaKaRa公司生产的2×Taq PCR Master Mixes,上、下游引物各0.5 μL,1 μL模板DNA(20—50 ng?μL-1)。反应程序为:94℃预变性3 min;94℃变性30 s,56℃退火30 s,72℃延伸30 s,35个循环;最后72℃延伸10 min,10℃保存。
1.3.4 PAGE凝胶制备与位点信息检测 凝胶检测参照本试验室优化的PAGE凝胶制备与位点检测方法[15]。
1.3.5 荧光毛细管电泳SSR-PCR扩增体系 PCR扩增采用20 μL反应体系:其中包含1 μL模板DNA(20—50 ng?μL-1),10 μL 2×Taq PCR Master Mixes(Takara,DaLian China),0.1 μL正向引物(10 μmol?L-1),0.3 μL反向引物(10 μmol?L-1),0.2 μL荧光标记(FAM,HEX,ROX或TAMRA)的M13引物(10 μmol?L-1)(中国天津,擎科)和9.4 μL ddH2O。反应程序为:94℃预变性3 min;94℃变性30 s,56℃退火30 s,72℃延伸30 s,35个循环;最后72℃延伸10 min,10℃保存(BIO-RAD PCR Thermal Cycler T100,USA)。
1.3.6 荧光毛细管电泳位点信息检测 将3对或4对荧光SSR引物的PCR扩增产物合并在一起。然后使用ABI 3730XL DNA测序仪(Applied Biosystems,Foster City,CA,USA)通过毛细管电泳分析混合物中片段位置信息,并使用Gene Marker v 2.2.0软件(Soft Genetics LLC,State College,PA,USA)读取等位变异具体的片段大小信息。
1.4 数据分析
使用Power Marker 3.25[16]和GenAlEx 6.51[17,18]软件计算包括主要等位基因频率(MAF)、等位基因数量(Na)、基因多样性(GD)、杂合性(He)、Shannon多样性指数(I)、多态信息含量(PIC)等遗传多样性指标。使用Power Marker 3.25计算各资源间的Nei’s遗传距离,随后基于UPGMA的方法在FigTree v1.4.3中构建聚类树。使用Structure 2.3.3[19]进行群体结构的分析。通过GenAlEx 6.51计算种群间的遗传分化固定指数(Fst)、基因流(Nm)、主坐标分析(PCoA)和分子变异分析(AMOVA),利用这些数据评估各种群间的遗传分化和遗传变异特征。2 结果
2.1 高质量SSR引物的筛选
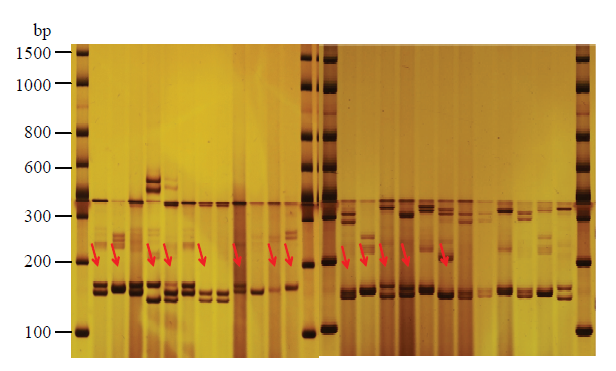
本试验选取不同产区的12个板栗品种作为筛选阶段的材料,以分布于不同板栗连锁群的330对SSR引物为基数,通过聚丙烯酰胺凝胶电泳筛选高质量和高多态的SSR引物作为后续进行遗传多样性分析的备选引物。以条带清晰、位点多态性高为原则,最终在330对引物中筛选出12对高多态引物。12对SSR引物分别是CmSI0396、CmSI0561、CmSI0614、CmSI0658、CmSI0702、CmSI0742、CmSI0800、CmSI0853、CmSI0871、CmSI0883、CmSI0922、CmSI0930(表2),图1是引物CmSI0561和CmSI0614的位点信息图例,通过分型统计可知CmSI0561在12个板栗品种中有6个不同的位点组合,CmSI0614有7个不同的位点组合,表现出高多态性。这些多态的SSR引物进一步用高分辨率的毛细管电泳进行位点检测。图1
 新窗口打开|下载原图ZIP|生成PPT
图1高多态引物CmSI0561和CmSI0614在12个板栗品种中的位点信息
Fig. 1Alleles of high polymorphism primers at CmSI0561 and CmSI0614 in 12 Chinese chestnut cultivars
2.2 SSR分子标记的遗传多样性
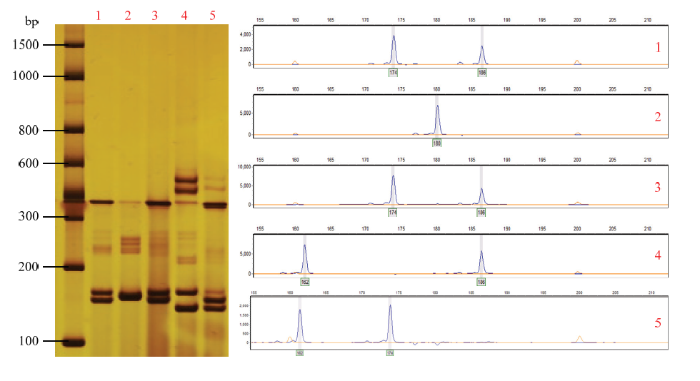
选取12对高质量SSR标记,采用荧光毛细管电泳技术对96份栗属植物资源进行分析(表3)。相比凝胶电泳检测,毛细管电泳检测的分辨率能达到1 bp,更能准确地读取位点信息(图2),为了检验毛细管电泳检测的准确性,本试验先用聚丙烯酰胺凝胶电泳与毛细管电泳进行检测对比。以引物CmSI0614为例(图2),毛细管电泳检测结果与凝胶电泳检测位点一致,并且能准确地读取具体的片段大小。Table 3
表3
表312对SSR标记的关键遗传数据
Table 3
| 标记名 Marker | 主要位点频率 MAF | 位点数 Na | 位点多样性 GD | 观察杂合度 Ho | 期望杂合度 He | 多态信息含量 PIC | 遗传分化指数 Fst | 基因流 Nm |
|---|---|---|---|---|---|---|---|---|
| CmSI0396 | 0.390 | 4 | 0.656 | 0.552 | 0.544 | 0.586 | 0.190 | 1.063 |
| CmSI0561 | 0.427 | 9 | 0.739 | 0.533 | 0.527 | 0.708 | 0.257 | 0.724 |
| CmSI0614 | 0.183 | 14 | 0.839 | 0.563 | 0.740 | 0.818 | 0.130 | 1.667 |
| CmSI0658 | 0.224 | 8 | 0.829 | 0.721 | 0.722 | 0.805 | 0.103 | 2.176 |
| CmSI0702 | 0.302 | 11 | 0.806 | 0.769 | 0.772 | 0.782 | 0.096 | 2.351 |
| CmSI0742 | 0.422 | 7 | 0.717 | 0.329 | 0.489 | 0.673 | 0.304 | 0.571 |
| CmSI0800 | 0.391 | 12 | 0.791 | 0.591 | 0.706 | 0.771 | 0.146 | 1.457 |
| CmSI0853 | 0.287 | 11 | 0.834 | 0.696 | 0.764 | 0.814 | 0.066 | 3.534 |
| CmSI0871 | 0.339 | 12 | 0.788 | 0.714 | 0.636 | 0.760 | 0.255 | 0.730 |
| CmSI0883 | 0.240 | 13 | 0.867 | 0.652 | 0.682 | 0.853 | 0.221 | 0.880 |
| CmSI0922 | 0.237 | 11 | 0.860 | 0.701 | 0.798 | 0.845 | 0.079 | 2.920 |
| CmSI0930 | 0.260 | 17 | 0.877 | 0.561 | 0.686 | 0.868 | 0.220 | 0.885 |
| 平均值 Mean | 0.308 | 10.750 | 0.800 | 0.615 | 0.672 | 0.774 | 0.172 | 1.580 |
新窗口打开|下载CSV
图2
 新窗口打开|下载原图ZIP|生成PPT
图2聚丙烯酰胺凝胶电泳银染结果和毛细管电泳检测结果对比
Fig. 2Comparison of silver staining results for polyacrylamide gel electrophoresis and detection results for capillary electrophoresis
利用毛细管电泳检测共获得129个等位变异,每个标记平均10.750位点变异。等位变异的大小范围从标记CmSI0742的137 bp到标记CmSI0922的351 bp。位点多样性(GD)变幅为0.656(CmSI0396)—0.877(CmSI0930),平均为0.800;观察杂合度(Ho)变幅为0.329(CmSI0742)—0.769(CmSI0702),平均为0.615;期望杂合度(He)变幅为0.489(CmSI0742)—0.789(CmSI0922),平均为0.672;多态信息含量(PIC)变幅为0.586(CmSI0396)—0.868(CmSI0930),平均为0.774;单个分子标记层面的Fst指数变幅为0.066(CmSI0853)—0.304(CmSI0742),平均为0.172。
2.3 栗属植物种群间的遗传多样性
分析不同栗属植物种群间的遗传多样性数据(表4),可知茅栗种群的观察位点数(Na)、有效等位变异(Ne)和Shannon多样性指数均为最高,其次是板栗种群,最低的是日本栗种群;在杂合度方面,茅栗也表现出较高的杂合性。茅栗种群有最为丰富的遗传多样性,这可能与其资源类型有着密切关系,茅栗是未开发的野生种质资源,而选用的板栗、锥栗和日本栗为实生选育的品种或农家种质资源。Table 4
表4
表4不同栗属植物种群间的关键遗传数据
Table 4
| 群体 Pop | 样品数 Sample | 变异位点数 Na | 有效等位变异 Ne | Shannon多样性指数 I | 观察杂合度 Ho | 期望杂合度 He | 无偏预期杂合度 UHe |
|---|---|---|---|---|---|---|---|
| 板栗种群 Pop1 | 50 | 6.667±0.732 | 3.708±0.317 | 1.453±0.086 | 0.648±0.024 | 0.707±0.026 | 0.714±0.026 |
| 锥栗种群 Pop2 | 13 | 5.417±0.288 | 3.141±0.213 | 1.343±0.056 | 0.633±0.065 | 0.665±0.022 | 0.693±0.023 |
| 茅栗种群 Pop3 | 19 | 7.083±0.883 | 4.748±0.712 | 1.587±0.158 | 0.623±0.047 | 0.719±0.047 | 0.739±0.048 |
| 日本栗种群 Pop4 | 14 | 5.333±0.620 | 3.080±0.416 | 1.219±0.145 | 0.556±0.072 | 0.598±0.058 | 0.621±0.061 |
新窗口打开|下载CSV
2.4 栗属种群遗传分化与变异分布
通过计算两两群体间的Fst固定系数(表5),可知板栗种群与锥栗种群、茅栗种群间的遗传分化值在0.05—0.15,种群间存在中等程度的分化,而与日本栗种群间的遗传分化值为0.165,表现出较大的遗传分化。锥栗种群与茅栗种群间的遗传分化值为0.115,群体间存在中等程度的分化,与日本栗种群间的遗传分化值为0.180,也表现出较大的遗传分化。茅栗种群与日本栗种群间的遗传分化值0.108,种群间存在中等程度的分化。该结果与单个分子标记层面Fst值的结论较为一致。Table 5
表5
表5两两种群间的Fst值
Table 5
| 板栗种群 Pop1 | 锥栗种群 Pop2 | 茅栗种群 Pop3 | 日本栗种群 Pop4 | |
|---|---|---|---|---|
| 0.000 | 板栗种群 Pop1 | |||
| 0.077 | 0.000 | 锥栗种群 Pop2 | ||
| 0.089 | 0.115 | 0.000 | 茅栗种群 Pop3 | |
| 0.165 | 0.180 | 0.108 | 0.000 | 日本栗种群 Pop4 |
新窗口打开|下载CSV
为了确定栗属植物种群间位点的变异总量及在种群间和种群内的变异分布,本试验对4个种群进行了分子方差分析(AMOVA)。结果表明,变异主要发生在种群内,占总变异量的73%,种群间的变异占27%。同时,栗属植物种群的基因流(Nm)为1.580,大于1,也说明种群间存在着一定的基因交流,由此降低了因遗传漂变引起的各种群间遗传分化程度。
2.5 栗属植物的群体结构和主坐标分析
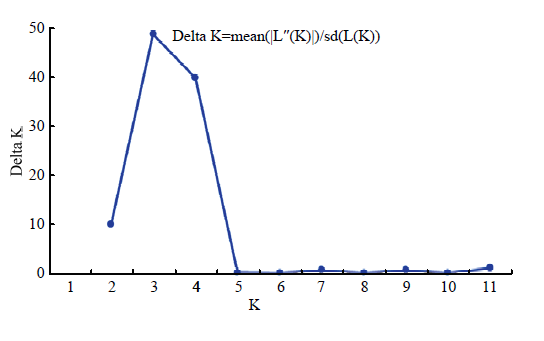
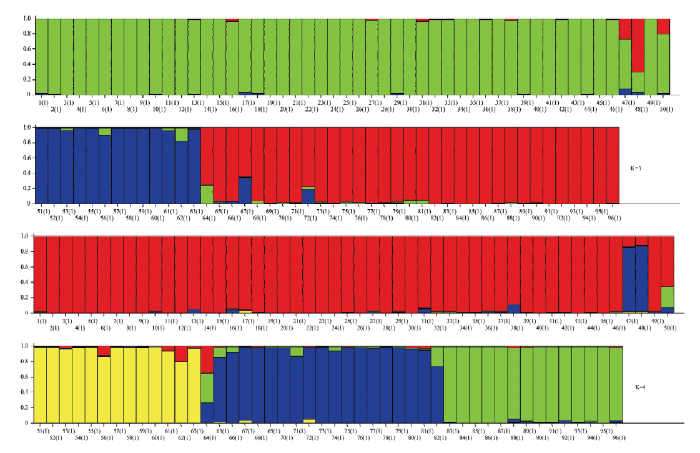
通过对96份资源进行群体遗传结构分析(图3),结果表明,当K=3时,Delta K出现明显峰值,将供试材料划分为3个组群(图4)。其中绿色组群(50份)主要为板栗种群,代表板栗的主要基因库;蓝色组群(13份),全部为锥栗种群,代表锥栗的主要基因库;红色组群(33份),主要为茅栗和日本栗资源,同时部分资源为种间混合类型。当K=4时,也表现较高的Delta K值,此情况下供试材料中的日本栗资源独立出来(图4),由此可判断日本栗和茅栗种间具有较近的亲缘关系。图3
 新窗口打开|下载原图ZIP|生成PPT
图3供试栗属植物群体结构分析的Delta K值分布
Fig. 3Distribution of Delta K values for structure analysis in the tested Castanea plants
图4
 新窗口打开|下载原图ZIP|生成PPT
图4供试栗属植物的群体结构图
Fig. 4Population structure diagram of the tested Castanea plants
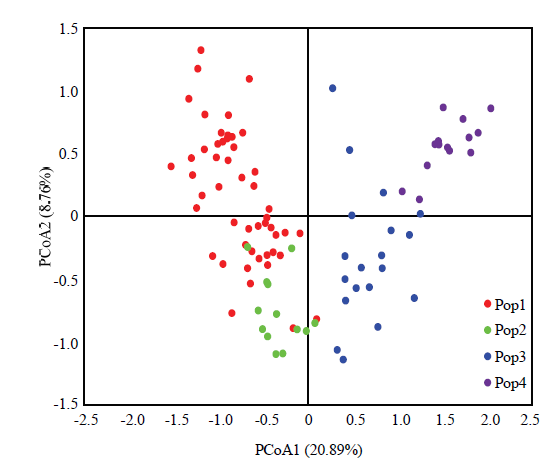
通过对供试材料进行主坐标分析(PCoA),可知全部资源可大致划分为4个组,主坐标(PCo)1和2分别解释了位点信息数据中20.89%和8.76%的变异(图5)。红色代表板栗资源,大部分资源位于左上部成为一簇;绿色代表锥栗资源,都位于中下偏左部成为一簇;蓝色代表茅栗资源,大部分资源位于中下偏右部成为一簇;紫色代表日本栗资源,都位于右上部成为一簇。同时,在PCoA可以观察到,个别锥栗资源与板栗资源,个别茅栗资源与日本栗资源相互掺杂,结合群体结构分析可知这些资源为种间混合类型。
Table 6
表6
表6栗属植物种群间的AMOVA分析
Table 6
| 变异来源 Source of variance | 自由度 df | 方差总和 SS | 平均方差 MS | 变异组分 Variance component | 变异百分率 Variation (%) | P* |
|---|---|---|---|---|---|---|
| 种群间 Among Pops | 3 | 252.554 | 84.185 | 3.589 | 27% | <0.01 |
| 种群内 Within Pops | 92 | 878.457 | 9.548 | 9.548 | 73% | <0.01 |
| 总量 Total | 95 | 1131.010 | 13.137 | 100% |
新窗口打开|下载CSV
图5
 新窗口打开|下载原图ZIP|生成PPT
图5供试栗属植物的主坐标分析(PCoA)
Fig. 5Principal coordinate analysis (PCoA) of the tested Castanea plants
2.6 不同栗属资源的聚类
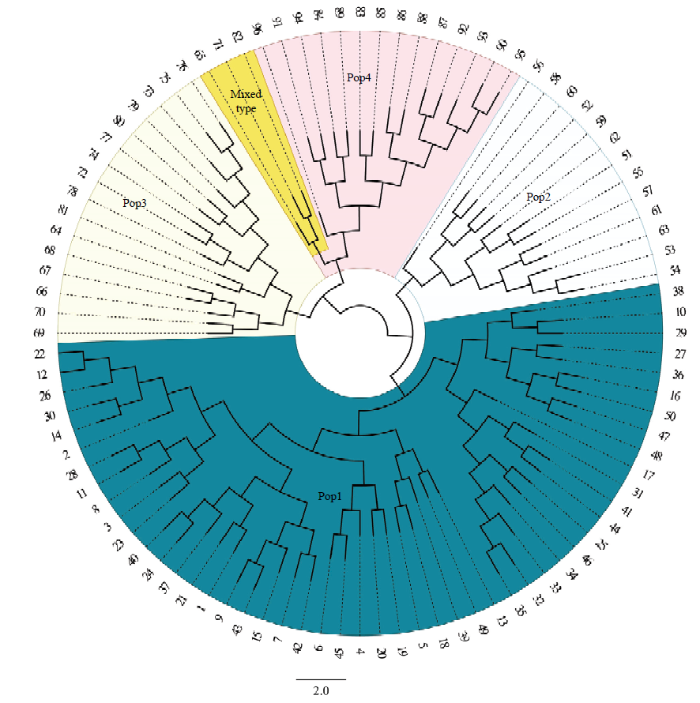
通过对96份资源进行基于UPGMA方法的聚类分析(图6),结果表明,全部资源被划分为4个类群(Pop1、2、3、4),全部的50份板栗资源聚类在Pop1中;Pop2共计13份,全部是锥栗资源;Pop3共计16份资源,主要是茅栗资源;Pop4共计17份资源,包括全部日本栗资源和3个茅栗资源。Pop4中3个茅栗资源与日本栗资源独立分开成立一支,结合群体结构的结果,可知3个茅栗资源中有日本栗基因的混入。供试材料的聚类结果与群体结构分析和主坐标分析结果基本一致,进一步说明茅栗与日本栗之间具有较近的亲缘关系。图6
 新窗口打开|下载原图ZIP|生成PPT
图6供试栗属植物的UPGMA系统树谱图
Fig. 6UPGMA dendrogram of the tested Castanea plants
3 讨论
3.1 SSR分子标记的筛选及其在栗属植物遗传多样性方面的运用
SSR分子标记具有稳定性、共显性、可重复性和多态性的特点,被广泛应用于各种遗传相关领域,例如资源鉴定、遗传图谱、遗传多样性以及核心种质的选择等[20,21],这些研究的有效性和成功与否很大程度上取决于选用的分子标记的质量和基因型数据的准确性[22,23]。MULLER等[11]报道了利用24个SSR标记对272个美洲栗个体进行基因分型,共获得135个等位变异,平均每对引物5.6个。江锡兵等[10]利用17个SSR分子标记在来自10省份的95个板栗品种共获得44个位点变异,平均每对引物2.6个,多态性信息含量(PIC值)平均为0.352。张馨芳等[24]利用21个SSR标记对151份板栗资源进行检测,共获得71个变异位点,平均每对引物3.38个,多态性信息含量(PIC值)平均约为0.867,有效等位基因数(Ne)和Shannon多样性指数(I)分别为1.498、0.4655。黄武刚等[25]用10对SSR引物对69个野生板栗个体进行分析,共检测到84个等位变异,每位点的平均等位变异为8.400个,平均有效等位基因数(Ne)、平均期望杂合度(He)、平均多态性信息含量(PIC值)分别为4.998、0.777和0.739。本研究从330个SSR标记中筛选出12对高质量的引物,在收集的96个栗属植物中共获得129个等位变异,每对引物平均有10.750个位点变异,这是JIANG等[10]研究结果的近5倍,也高于张馨芳等[24]和黄武刚等[25]的研究结果。本研究使用12个SSR标记计算全部资源的观察杂合度(Ho)平均值为0.615,显示出较高的杂合度,与前人研究结果一致[26],板栗的高度杂合特性与其为异花授粉植物密不可分[27,28,29]。12个SSR标记多态信息含量(PIC)的平均值为0.774(>0.500),最大值达到0.868,代表供试材料具有高多态性。其原因可能是本试验收集了更为广泛的种间种质资源,此外,本试验利用毛细管电泳检测技术进行读取和记录目的条带,不仅极大地提高了基因座检测的准确性,而且大大克服了凝胶电泳检测分辨率低的问题。3.2 中国栗属植物种间遗传多样性的差异
现今中国分布的栗属植物资源中板栗的栽培面积最大,共有5大品种生态群,其次是锥栗和日本栗,而具有童期短和矮化特性的茅栗处于待开发状态[2]。栗属植物作为典型的果树材料,由于其本身遗传特征的制约,栗属植物品种选育仍以实生选育为主,缺乏优质高效的品种和抗性良好的砧木种质资源。Shannon多样性指数(I)结果表明,茅栗种群最高,且茅栗的遗传多样性最高,这一结果与郎萍等[27]的结论不一致,其可能的原因有两个:其一,样品的选择不同,郎萍等选择的样品主要集中在长江中下游和西南地区,本研究中茅栗和板栗样品的选择覆盖度更广;其二,分子标记的技术不同,郎萍等利用的技术为同工酶,评估样品多样性的能力有限。本研究利用的技术是荧光SSR标记,其具有更丰富的多态性,能较好地反映样品的多样性。同时,茅栗是未开发的野生资源,茅栗资源可能保留着更为丰富的遗传变异,其巨大的种质利用潜力一直被人们所忽视。在种间遗传分化方面,可知栗属植物种间的遗传分化值在0.077—0.180,种群间存在中等以上程度的分化,尤其板栗种群、锥栗种群与日本栗种群间表现出较大的遗传分化,这一结果与主坐标分析(PCoA)和群体遗传结构分析的结果具有高度一致性。同时,通过基因流(Nm)和分子方差分析(AMOVA)可知,栗属植物种群间基因流为1.580,表现出较高频繁的基因流动,但显著低于张馨芳等[24](Nm=9.696)及黄武刚等[25](Nm=2.476)在板栗种内利用SSR分子标记计算的基因流,也低于郎萍等[27](Nm=2.043)在板栗、锥栗和茅栗种间利用同工酶计算的基因流;栗属植物种群间的遗传变异占27%,也显著高于张馨芳等[24](4.9%)和黄武刚等[25](13%)在板栗种内居群间的遗传变异,而低于程丽莉等[30]通过cpSSR计算的栗属种间的遗传变异(33%)。因此,推测栗属植物作为一种典型的异花授粉植物,种群间在自然条件下具有一定的基因交换,正是这些基因流阻止了各种间的进一步分化,栗属的这种分化特点与WRIGHT[31]的理论相符。
在栗属植物种间群体遗传多样性研究方面,现阶段的研究主要集中在板栗或锥栗等单个种内不同地域的群体遗传多样性方面[31,32,33,34],而栗属植物种间群体遗传多样性的研究知之甚少。本研究通过群体遗传结构分析和UPGMA系统发育树分析,可知板栗与锥栗,锥栗与茅栗的遗传背景存在明显的种间界限,这与韩继承等[35]研究结果一致。同时板栗和锥栗、板栗和茅栗、茅栗和日本栗之间有着广泛的基因交流,在供试材料中有部分资源为种间混合类型。例如65、71和82号资源既有茅栗的遗传背景又有日本栗的遗传背景,在聚类树结构中位于茅栗和日本栗亚分支的中间位置。48号资源‘广东矮生’同时含有板栗和茅栗的遗传背景,在地理分布上,广东省正处于板栗和茅栗资源的重叠生态区;在园艺学性状上,其也表现出茅栗树势矮小和板栗坚果大的性状特征。综上可知,栗属植物种群间的遗传分化程度在中等以上,部分资源在世代遗传中继承了不同祖先种的遗传信息;在相同生态区域的栗属植物种间存在一定的基因交流,没有形成完全的生殖隔离。
4 结论
筛选的12对SSR引物能够准确评估中国栗属植物的遗传多样性,综合聚类分析可确定栗属植物的类群划分与种间信息高度一致且种间存在一定的基因交换,茅栗与日本栗具有较近的亲缘关系,茅栗遗传多样性较高,具有很大的利用潜力。这将为未来栗属植物种质创新提供重要的理论依据。参考文献 原文顺序
文献年度倒序
文中引用次数倒序
被引期刊影响因子
[本文引用: 1]
[本文引用: 1]
DOI:10.1007/BF00220805URLPMID:24186251 [本文引用: 3]

Allozyme genetic variability in three chestnut (Castanea) species was investigated using 19 loci from ten enzyme systems. G-tests of heterogeneity of isozymic allele distribution showed significant differences between the three species at 15 of the 19 loci, and between the 13 C. mollissima populations at 13 of the 19 loci examined. C. mollissima was found to possess a significantly-higher value of mean gene heterozygosity (H=0.3050+/-0.0419), the percentage of polymorphic loci (P=84.21%) and the average number of alleles per locus (A=2.05), than any other species in the Castanea section Eucastanon. When the genetic variability of populations of C. mollissima from four regions in China was investigated, the population from the Changjiang river region showed a markedly higher mean gene heterozygosity (H=0.3480+/-0.0436) than populations from the other regions. Genetic relationships among the four regions were assessed by Nei's genetic identity I and standard genetic distance D. An approximately-identical distance between the population from the Changjiang river region and populations from the three other regions was observed, while populations from the latter regions showed almost the same genetic distance from each other. These data, when considered with information existing prior to this study, contribute to an understanding of the possible origin and progenitor of the chestnut species.
[本文引用: 1]
DOI:10.1007/s11295-006-0036-2URL [本文引用: 1]
DOI:10.3864/j.issn.0578-1752.2019.03.017URL [本文引用: 1]
【Objective】 There are abundant Japanese plums (Prunus salicina L.) germplasm resources in China, which are distributed widely in geography. The better understanding of the diversity, the genetic structure and the relationship between sympatric related species, can be helpful to clarify the process of domestication of the cultivated groups of plum and the role of the related species, also further contribute to the in-depth exploration of local resources and enhance the fruit quality in breeding. 【Method】 The 22 pairs of SSR markers covering the entire genome were used to scan 48 samples, including 38 accessions of P. salicina from different sources and 10 accessions of the variation types or related species, by high-throughput fluorescence capillary electrophoresis platform. The polymorphism of 22 SSR loci and genetic diversity of 48 samples were evaluated via the software GenAlEx 6.41, and the dendrogram of these accessions was constructed by using the NTSYS-pc Version 2.1 program. The STRUCTURE 2.2 software based on Bayesian clustering method was used to analyze the genetic mixture of samples and to perform an assignment test on the studied individuals. 【Result】 The detected alleles of 22 SSR primers ranged from 3 to 21, with an average of 13.54 alleles for each locus. A total of 298 alleles were detected in these accessions, 51.8% of which were rare alleles. The values of average effective allele (Ne), average Shannon's diversity index (I), observation heterozygosity (Ho) and expectation heterozygosity (He) indicated that the diversity was the highest in the southern population, followed by the northeast population, which also indicated that the diversity of the Prunus simonii was lower than that of northern China. The analysis of molecular variance (AMOVA) showed that 69% of the diversity in P. salicina was within the population, and only 31% was among populations. On the basis of the data comparisons of the genetic differentiation coefficient and Nei's genetic distance, the results showed that there were extremely significant genetic differentiation and appropriate genes mixture among different geographical populations. The results of cluster analysis implied that the breeding cultivars abroad were closely related to the local accessions in southern China, and the northern cultivars population was similar with P. simonii, the northeast cultivars population had close relationship with Prunus ussuriensis. The genetic structure analysis indicated that the accessions in P. salicina were divided into four types: northern cultivars population, northeast cultivars population, southern cultivars of small fruit and crisp meat population, and southern cultivars of large fruit population (including foreign breeding cultivars). 【Conclusion】 The diversity of the southern varieties were the most abundant in the P. salicina, followed by that of Northeast China varieties, foreign varieties and Northern varieties. In order to enhance the adaptability, the northeast population might be introgressed with P. ussuriensis. P. simonii might be a special type which was highly domesticated from Chinese plum in Northern China, and it had high heterozygosis owing to asexual reproduction by grafting. The large fruit accessions in Jiangsu and Zhejiang regions played an important role in modern breeding varieties abroad.
DOI:10.3864/j.issn.0578-1752.2019.24.002URL [本文引用: 1]
【Objective】Through the investigation of 10 major traits in foxtail millet at Ledong, Hainan province, Luoyang, Henan province, Jilin and Gongzhuling, Jilin province, totally four different geographical environments, association analysis between SSR markers and the ten traits was performed to obtain loci expressed in single environment or multiple environments, excavate elite allelic variations, explore the probable mechanism forming ecological adaptation and provide foundation for launching molecular-assistant selection breeding in foxtail millet.【Method】Based on the survey of ten traits (plant height, panicle length, number of leaves, panicle diameter, heading stage, spikelet number, grain number per branch, spike weight, grain weight per panicle and 1000-grain weight) from 102 foxtail millet varieties at Jilin and Gongzhuling, Jilin province, Luoyang, Henan province and Ledong, Hainan province for two consecutive years, correlation analysis of ten traits at each geographical environment was first performed by SPSS 19.0 software, then the 102 foxtail millet varieties were genotyped by 70 polymorphic SSR markers, and further genetic diversity and population genetic structure of these varieties were analyzed. Finally, linkage disequilibrium analysis among markers and association analysis between molecular markers and phenotypic traits were carried out by GLM and MLM models of TASSEL 5.0 software. 【Result】There existed significant or very significant positive correlations among most of the nine agronomic traits except 1000-grain weight across four geographical environments. Only significant or very significant positive correlations were found between 1000-grain weight and grain weight per panicle, plant height, panicle length, spike weight at Jilin, Gongzhuling and Luoyang, no significant correlations were found between 1000-grain weight and other nine traits at Ledong environment. Totally 397 alleles were detected in 70 pairs of SSR primers, giving average observed allele number, effective allele number, expected heterozygosity, Shannon index of 6, 2.24, 0.4637 and 0.7738 per marker respectively. Both genetic diversity analysis and population structure analysis divided 102 foxtail millet materials into 4 groups, and the varieties from Henan province scattered in each of the four groups, showing more abundant genetic diversity. Linkage disequilibrium analysis showed that no obvious LD structures were found among 70 SSR markers. Totally 10 associated markers were detected by GLM and MLM models, combined with allele effect analysis results, it could be determined that b115, MPGC13, b227, b194 and p56 were associated with spike weight, panicle length, number of leaves and heading stage at Jilin, Gongzhuling, sigms9034 and b125 were associated with panicle length and spikelet number at Luoyang, P18 and p59 were associated with spike weight at Ledong, p6 was associated with number of leaves and spikelet number at Jilin, Gongzhuling and Luoyang respectively. The average contribution rates of single marker to phenotypic variation ranged from 7.76% to 34.05%. Three alleles, sigms9034-168, P18-166 and p56-244, could increase panicle length and spike weight, shorten heading stage significantly, which would be used to improve panicle traits and shorten growth period by marker-assisted selection breeding.【Conclusion】Five marker loci (b115, MPGC13, b227, b194 and p56) were steadily detected at Jilin and Gongzhuling, two marker loci (sigms9034, b125), two marker loci (P18, p59) were steadily detected at Luoyang and Ledong respectively for two consecutive years. One marker locus (p6) was steadily detected at Jilin, Gongzhuling and Luoyang, three geographical environments for two consecutive years. Three elite alleles (sigms9034-168bp, P18-166bp, p56-244bp) that could be used to carry out marker-assisted selection for panicle traits and growth period were obtained.
DOI:10.3864/j.issn.0578-1752.2019.22.014URL [本文引用: 1]
【Objective】The objective of this study is to analyze the genetic diversity and relationship of common millet accessions (six different ecotopes at home and abroad) by microsatellite markers, to provide available data for classification, selection and utilization of elite germplasm resources. 【Method】 One hundred and forty-four SSRs (64 high motif nucleotide sequence repeat and 80 low ones) are used to identify polymorphisms in ninety-six common millet accessions (71 home accessions and 25 abroad accessions). Genetic diversity parameters were calculated using software PowerMarker 3.25 and PopGen 1.32. Genetic distance and Structure on accessions were classified with software MEGA 5.0 and Structure 2.2, respectively. PCA (principal component analysis) was conducted by software Ntsys 2.11. 【Result】 Using 144 EST-SSR markers, a total of 368 observed alleles (Na) were detected with 2-3 alleles (mean = 2.5556) per locus. The observed heterozygosity (Ho) ranged from 0.4070 (RYW15) to 0.9789 ( RYW85) with an average of 0.8288. The expected heterozygosity (He) ranged from 0.4369 ( RYW59) to 0.6693 ( RYW58) with an average of 0.5535. The Nei's gene diversity index ranged from 0.4344 (RYW59) to 0.6653 (RYW58) with a mean of 0.5505. The polymorphism information content (PIC) ranged from 0.1811 (RYW68) to 0.7508 (RYW58) with an average of 0.4279. The Shannon diversity index (I) range was 0.6474 to 1.0956 with an average of 0.8415. In the case of genetic diversity parameters, the PIC and I of common millet accessions from Northern spring-sowing region were the most abundant than that of others. On the contrary, the accessions from Northwest spring & summer-sowing region were the lowest. For the different geographical regions accessions, the range of genetic distance was 0.0111 to 0.1425 and the scope of genetic consistency was 0.8672 to 0.9889. The genetic distance of accessions between Loess Plateau spring & summer-sowing region and Northern spring-sowing region was the least and their genetic consistency was the highest. The genetic distance between Northwest spring & summer-sowing region and North of China summer-sowing region was the largest and their genetic consistency was the lowest. UPGMA analysis divided 96 accessions into three groups (GroupⅠ, Ⅱ and Ⅲ). Group I were mainly Northern spring-sowing region common millet, Group Ⅱ were mainly foreign accessions, and Group Ⅲ were mainly Loess Plateau spring & summer-sowing region and Northern spring-sowing region accessions. Structure cluster divided resources into four groups. The red group contained Loess Plateau spring & summer-sowing region and Northern spring-sowing region accessions, which represented the gene pool of Loess Plateau and North. The green group included Northern spring-sowing region accessions, which represented the North gene pool. The blue group were Loess Plateau spring & summer-sowing region accessions, which represented the gene pool of Loess Plateau. The yellow group represented foreign gene pool. In terms of diversity parameters, the PIC value of GroupⅡwas the highest at 0.4606 and the Group Ⅳ was the lowest at 0.3539. The PCA analysis classified all accessions into six clusters, which are related to their geographical region. 【Conclusion】144 SSRs can evaluate 96 common millet resources accurately. The genetic relationships are related to their geographical region. Genetic diversity of accessions from Northern spring-sowing region are more abundant.
URLPMID:10645951 [本文引用: 1]
Computer-based genome-wide screening of the DNA sequence of Escherichia coli strain K12 revealed tens of thousands of tandem simple sequence repeat (SSR) tracts, with motifs ranging from 1 to 6 nucleotides. SSRs were well distributed throughout the genome. Mononucleotide SSRs were over-represented in noncoding regions and under-represented in open reading frames (ORFs). Nucleotide composition of mono- and dinucleotide SSRs, both in ORFs and in noncoding regions, differed from that of the genomic region in which they occurred, with 93% of all mononucleotide SSRs proving to be of A or T. Computer-based analysis of the fine position of every SSR locus in the noncoding portion of the genome relative to downstream ORFs showed SSRs located in areas that could affect gene regulation. DNA sequences at 14 arbitrarily chosen SSR tracts were compared among E. coli strains. Polymorphisms of SSR copy number were observed at four of seven mononucleotide SSR tracts screened, with all polymorphisms occurring in noncoding regions. SSR polymorphism could prove important as a genome-wide source of variation, both for practical applications (including rapid detection, strain identification, and detection of loci affecting key phenotypes) and for evolutionary adaptation of microbes.
DOI:10.21273/JASHS.134.6.610URL [本文引用: 1]
DOI:10.1007/s40415-016-0321-8URL [本文引用: 3]
DOI:10.3390/f9110695URL [本文引用: 2]
DOI:10.1007/s11295-012-0579-3URL [本文引用: 1]
[本文引用: 1]
[本文引用: 1]
URL [本文引用: 1]
URL [本文引用: 1]
[本文引用: 1]
[本文引用: 1]
DOI:10.1093/bioinformatics/bti282URLPMID:15705655 [本文引用: 1]
SUMMARY: PowerMarker delivers a data-driven, integrated analysis environment (IAE) for genetic data. The IAE integrates data management, analysis and visualization in a user-friendly graphical user interface. It accelerates the analysis lifecycle and enables users to maintain data integrity throughout the process. An ever-growing list of more than 50 different statistical analyses for genetic markers has been implemented in PowerMarker. AVAILABILITY: www.powermarker.net
DOI:10.1093/bioinformatics/bts460URL [本文引用: 1]
GenAlEx: Genetic Analysis in Excel is a cross-platform package for population genetic analyses that runs within Microsoft Excel. GenAlEx offers analysis of diploid codominant, haploid and binary genetic loci and DNA sequences. Both frequency-based (F-statistics, heterozygosity, HWE, population assignment, relatedness) and distance-based (AMOVA, PCoA, Mantel tests, multivariate spatial autocorrelation) analyses are provided. New features include calculation of new estimators of population structure: G'(ST), G ''(ST), Jost's Dest and F'(ST) through AMOVA, Shannon Information analysis, linkage disequilibrium analysis for biallelic data and novel heterogeneity tests for spatial autocorrelation analysis. Export to more than 30 other data formats is provided. Teaching tutorials and expanded step-by-step output options are included. The comprehensive guide has been fully revised.
DOI:10.1111/men.2006.6.issue-1URL [本文引用: 1]
URLPMID:12930761 [本文引用: 1]
We describe extensions to the method of Pritchard et al. for inferring population structure from multilocus genotype data. Most importantly, we develop methods that allow for linkage between loci. The new model accounts for the correlations between linked loci that arise in admixed populations (
DOI:10.1093/nar/12.10.4127URLPMID:6328411 [本文引用: 1]
Simple sequences are stretches of DNA which consist of only one, or a few tandemly repeated nucleotides, for example poly (dA) X poly (dT) or poly (dG-dT) X poly (dC-dA). These two types of simple sequence have been shown to be repetitive and interspersed in many eukaryotic genomes. Several other types have been found by sequencing eukaryotic DNA. In this report we have undertaken a systematical survey for simple sequences. We hybridized synthetical simple sequence DNA to genome blots of phylogenetically different organisms. We found that many, probably even all possible types of simple sequence are repetitive components of eukaryotic genomes. We propose therefore that they arise by common mechanisms namely slippage replication and unequal crossover and that they might have no general function with regards to gene expression. This latter inference is supported by the fact that we have detected simple sequences only in the metabolically inactive micronucleus of the protozoan Stylonychia, but not in the metabolically active macronucleus which is derived from the micronucleus by chromosome diminution.
DOI:10.1007/s11032-016-0466-yURL [本文引用: 1]
DOI:10.1007/s11032-017-0692-yURL [本文引用: 1]
DOI:10.1111/j.1461-0248.2006.00889.xURLPMID:16643306 [本文引用: 1]
Recent improvements in genetic analysis and genotyping methods have resulted in a rapid expansion of the power of molecular markers to address ecological questions. Microsatellites have emerged as the most popular and versatile marker type for ecological applications. The rise of commercial services that can isolate microsatellites for new study species and genotype samples at reasonable prices presents ecologists with the unprecedented ability to employ genetic approaches without heavy investment in specialized equipment. Nevertheless, the lack of accessible, synthesized information on the practicalities and pitfalls of using genetic tools impedes ecologists' ability to make informed decisions on using molecular approaches and creates the risk that some will use microsatellites without understanding the steps needed to evaluate the quality of a genetic data set. The first goal of this synthesis is to provide an overview of the strengths and limitations of microsatellite markers and the risks, cost and time requirements of isolating and using microsatellites with the aid of commercial services. The second goal is to encourage the use and consistent reporting of thorough marker screening to ensure high quality data. To that end, we present a multistep screening process to evaluate candidate loci for inclusion in a genetic study that is broadly targeted to both novice and experienced geneticists alike.
[本文引用: 4]
[本文引用: 4]
[本文引用: 4]
[本文引用: 4]
[本文引用: 1]
[本文引用: 3]
[本文引用: 3]
[本文引用: 1]
DOI:10.1007/BF02858784URL [本文引用: 1]
DOI:10.7668/hbnxb.2015.02.026URL [本文引用: 1]
The objective of the study is to elucidate the genetic relationship and genetic diversity of Castanea species.Based on the technology of chloroplast microsatellite markers, of total 24 cpSSR primer pairs screened, only four presented length polymorphism in the Castanea mollissima tested.We surveyed 6 species, altogether 56 materials with cpSSR markers in order to estimate genetic variation and genetic structure.In the castanea plants, average number of alleles (Na), effective number of alleles (Ne), expected heterozygosity (He) and Nei's were 3.25, 2.554, 0.606 and 0.320, respectively.Apparently, the parameters of cpSSR loci were much lower than those revealed by nuclear SSRs.Furthermore, the intra-specific genetic diversity was high but varied greatly among different species, the wild chestnut in China showed the highest genetic diversity, which one was rich in heredity and variation.The results have important implications of understanding the population genetics and evolutionary patterns in the genus Castanea and provide baseline data for formulating the conservation and management strategies.
URLPMID:17246615 [本文引用: 2]
DOI:10.3724/SP.J.1003.2009.09043URL [本文引用: 1]
Genetic diversity and population structure of 28 natural populations of Castanea mollissima were investigated by using microsatellite markers. A total of 128 alleles were identified in 849 individuals across the eight microsatellites analysed, with a mean value of 16 alleles per locus. The mean expected heterozygos-ity (HE) and observed heterozygosity (HO) across all populations were 0.678 and 0.590, respectively, and a higher level of diversity was found in populations from central China (A = 8.112, HE = 0.705, HO = 0.618) than those from other three regions (eastern, southwestern and northwestern China). Indices of genetic dif-ferentiation based on stepwise mutation model (SMM) and infinite allele model (IAM) were RST = 0.208 and FST = 0.120, respectively. No significant association between genetic distance and geographic distance was detected by Mantel test, suggesting gene flow is not a dominant factor shaping genetic structure of the spe-cies. The central China, particularly the area around the Shengnongjia Mountains, can be recognized as a modern center of genetic diversity of C. mollissima. Thus, natural populations of the species in this region deserve prior conservation and utilization for breeding programmes.
[D].
[本文引用: 1]
[D].
[本文引用: 1]
DOI:10.1270/jsbbs.55.271URL [本文引用: 1]
[本文引用: 1]
[本文引用: 1]
