 ,, 李鑫格, 马吉锋, 刘小军, 田永超, 朱艳, 曹卫星, 曹强,南京农业大学/国家信息农业工程技术中心/农业农村部农作物系统分析与决策重点实验室/智慧农业教育部工程研究中心/江苏省信息农业重点实验室,南京 210095
Using Canopy Time-Series Vegetation Index to Predict Yield of Winter Wheat
XIANG FangLin,, LI XinGe, MA JiFeng, LIU XiaoJun, TIAN YongChao, ZHU Yan, CAO WeiXing, CAO Qiang,Nanjing Agricultural University/National Engineering and Technology Center for Information Agriculture/Key Laboratory for Crop System Analysis and Decision Making, Ministry of Agriculture and Rural Affairs/Engineering and Research Center for Smart Agriculture, Ministry of Education/Jiangsu Key Laboratory for Information Agriculture, Nanjing 210095通讯作者:
责任编辑: 杨鑫浩
收稿日期:2019-12-9接受日期:2020-03-12网络出版日期:2020-09-16
| 基金资助: |
Received:2019-12-9Accepted:2020-03-12Online:2020-09-16
作者简介 About authors
项方林,E-mail:

摘要
关键词:
Abstract
Keywords:
PDF (1486KB)元数据多维度评价相关文章导出EndNote|Ris|Bibtex收藏本文
本文引用格式
项方林, 李鑫格, 马吉锋, 刘小军, 田永超, 朱艳, 曹卫星, 曹强. 基于冠层时序植被指数的冬小麦单产预测[J]. 中国农业科学, 2020, 53(18): 3679-3692 doi:10.3864/j.issn.0578-1752.2020.18.005
XIANG FangLin, LI XinGe, MA JiFeng, LIU XiaoJun, TIAN YongChao, ZHU Yan, CAO WeiXing, CAO Qiang.
0 引言
【研究意义】实时、准确地预测作物单产是进行作物精确管理的关键环节。时序植被指数能够反映作物全生育时期的长势信息,从而为田间快速、准确地预测作物单产提供技术支撑。【前人研究进展】基于卫星遥感影像,研究者利用作物关键生育时期获取的冠层植被指数构建了不同的估产方法[1]。然而,基于单时相遥感影像信息所构建的单产预测模型易受环境影响,普适性欠佳。相较于单一生育时期的冠层光谱信息,时序植被指数蕴含了作物全生育时期的生长发育动态信息,具有良好的单产预测的潜力[2,3,4,5]。目前,研究者多基于卫星遥感获取高时间分辨率的植被指数信息,如基于AVHRR和MODIS卫星获取时序归一化植被指数(normalized difference vegetation index,NDVI)等,其在植被分类[6]、物候期提取[7]、作物种植面积估测[8]等方面得到了广泛应用。前人在估产方面也进行了研究,如陈鹏飞等[9]通过提取基于环境减灾卫星拟合的时序NDVI曲线特征参数进行小麦估产,结果表明利用多元逐步线性回归建立的估产模型效果较好。然而,由于卫星影像处理的复杂性、时效性等问题限制了该技术为当季生产管理决策提供支持的潜力[10]。随着近地面传感器的发展,其低成本、易操作和快解译等优点成为作物生长监测不可或缺的技术途径[11]。已有研究者利用近地面传感器获取时序植被指数并基于局部加权回归、双Logistic模型等进行数据重构,从而估测作物生育时期及相关农学参数[7,12]。上述研究多基于植被指数NDVI,然而,有研究表明NDVI在植被覆盖度较高时具有明显的饱和效应[13]。近年研究发现,基于红边波段拟合的植被指数与作物氮素营养状况关系更为密切[14]。如THOMPSON等[15]研究揭示了基于红边波段的归一化红边植被指数(normalized difference red edge,NDRE)能有效解决饱和问题。相关****还利用红边和近红外波段组合的比值植被指数以及包含有红边波段的3波段指数有效地估测了小麦等氮素营养状况[16,17]。RapidSCAN CS-45(Holland Scientific Inc.,Lincoln,USA)是一种包含红边波段在内的主动冠层传感器,已有****利用该传感器获取的植被指数NDRE和NDVI在诊断作物氮素营养状况及估测产量时取得较好的效果[18,19,20]。【本研究切入点】基于时序植被指数进行作物单产估测的研究多是利用卫星遥感数据,但其时间分辨率和空间分辨率相对较低,且易受外界条件影响,而应用主动冠层传感器能有效避免这些不足。【拟解决的关键问题】本研究拟应用主动冠层传感器RapidSCAN CS-45获取冬小麦冠层时序植被指数,并基于时序曲线特征参数构建冬小麦单产预测模型,揭示不同品种及氮素水平下植被指数的时序变化特征,构建并评价基于时序植被指数的冬小麦单产预测模型。1 材料与方法
1.1 试验设计
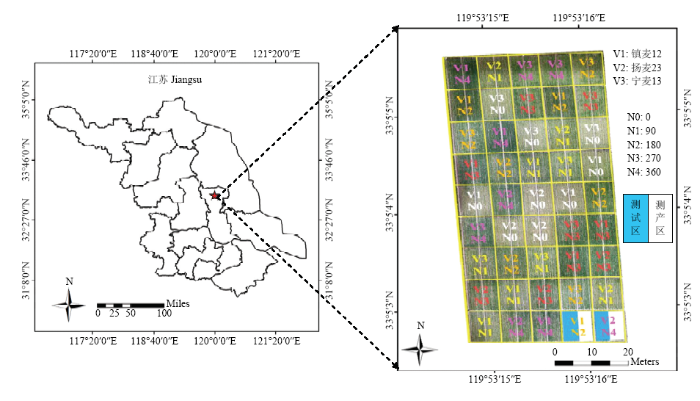
试验1:于2017—2019年在江苏省兴化市万亩高产高效粮食产业园(119°53′ E, 33°48′ N)进行。试验区土壤有机质26.5 g·kg-1,全氮2.07 g·kg-1,有效磷52.54 mg·kg-1,速效钾93.66 mg·kg-1。供试品种为镇麦12号、扬麦23号、宁麦13号,均为江苏省主栽品种。施氮水平分别为纯氮0(N0)、90 kg·hm-2(N1)、180 kg·hm-2(N2)、270 kg·hm-2(N3)、360 kg·hm-2(N4)。小麦行距为0.25 m,小区面积为63 m2(7 m×9 m),将每个小区一分为二,一侧为测试区,另一侧为测产区(图 1)。试验采用完全随机设计,重复3次,分别于2017年11月8至9日和2018年11月1日于南北行向人工播种,基本苗为2.25×10⁶株/hm2。结合整地一次性施用105 kg·hm-2 P2O5,钾肥共施用120 kg·hm-2 K2O,氮肥、钾肥基追比5﹕5,基肥在播种前施入,追肥在拔节期施入。在作物生长阶段,及时除草防治病虫害,其他栽培措施同一般高产田。图1
 新窗口打开|下载原图ZIP|生成PPT
图1试验1田块分布图
Fig. 1Map of experiment 1
试验2:于2018—2019年在相同园区进行,供试品种为扬麦23号。试验设置2个播期(11月4日和24日),3个密度(1.8、2.7、3.6×10⁶株?hm2)以及4个氮素水平(0、180、240、300 kg·hm-2)。其中0氮水平不设重复,其他处理3次重复,小区面积为30 m2(5 m×6 m),其他试验设计、栽培管理措施与试验1一致。
1.2 测定项目与方法
1.2.1 主动冠层传感器获取光谱数据 本研究使用的RapidSCAN CS-45包括红光(R,670 nm)、红边(RE,730 nm)、近红外(NIR,780 nm)3个波段。可以自动收集每个波段的光谱反射率和地理坐标数据,并以2.5 Hz(每0.4 s读取一次)的频率将其记录在传感器的存储模块中,数据可以通过PC软件导出为.csv文件。仪器视场角为横向45°,纵向10°,仪器自带光源,且不受天气条件的影响,较方便轻巧的特点有利于测试。在冬小麦越冬—返青期,每隔15 d测试1次;返青期之后,每隔3—5 d测试1次,2个冬小麦生长季共测试63次(2017—2018冬小麦生长季测试30次,2018—2019冬小麦生长季测试33次)。测定时,在每个待测小区选择中间两行手持传感器匀速前行,并使传感器距离冬小麦冠层的高度约100 cm,且与地面保持平行,每行约20—30个测试点,每个小区测定的平均值代表该小区的测试值,本研究基于NIR、R和RE波段计算了各小区的NDRE和NDVI(公式(1—2))。式中,NIR表示近红外波段反射率,RE表示红边波段反射率,R表示红光波段反射率。
1.2.2 冬小麦单产的测定 冬小麦收获时,在各试验小区选取3个1 m2样方,单独收割、晾晒、脱粒并称重,取平均值作为该小区的产量。
1.3 时序植被指数动态模型的建立及拟合参数的计算
累积生长度日数(accumulated growing degree days,AGDD)是描述时序植被指数动态变化的时间驱动因子,由从播种日期到各测试日期生长度日数值累加而成[21,22],如公式(3)所示。本研究所采用的温度数据来源于试验点所在的气象站。式中,i为冬小麦播种后天数,Tmax 和Tmin分别为当日最高温度和最低温度,Tbase为冬小麦生长的基点温度,本研究中设为0℃[23,24]。
相对AGDD(relative AGDD,RAGDD)由AGDD归一化计算得到,如公式(4);相对NDRE(Relative NDRE,RNDRE)和相对NDVI(Relative NDVI,RNDVI)分别由NDRE和NDVI归一化计算得到,如公式(5)和公式(6)。
式中,AGDDi为测试当日的AGDD值,AGDDharvest为收获时的AGDD值,即全生育时期的累积生长度日数。NDREi和NDVIi为测试当日该处理的NDRE和NDVI值,NDREmax和NDVImax为该品种全生育时期NDRE和NDVI最大值。
本研究中,采用双Logistic函数模型拟合时序植被指数的动态变化,建立了RAGDD和RNDRE、RNDVI的定量关系。1stOpt15PRO(7D-Soft High Technology Inc.,Beijing,China)主要用于时间序列数据的分析,利用双Logistic曲线拟合模型,并计算出模型中的拟合参数。模型拟合参数由拟合方程在1stOpt15PRO软件下输出,参照Fischer[25]模型,如公式(7)计算:
$y=\frac{{{\text{A}}_{\text{1}}}}{\text{1}+{{\text{e}}^{\text{-a(}x-b\text{)}}}}-\frac{{{\text{A}}_{\text{2}}}}{\text{1}+{{\text{e}}^{\text{-}c\text{(}x-d\text{)}}}}$
式中,第1个Logistic函数代表冬小麦的生长过程,第2个Logistic函数代表冬小麦的衰老过程。y为拟合后的植被指数值,A1为归一化后的植被指数最大值,A2为A1与成熟期植被指数的差值;a和c分别表示冬小麦生长和衰老过程中2个Logistic曲线模型的拐点处斜率,即植被指数增长或下降的最大速度,与这2个拐点对应的RAGDD分别为b、d。
1.4 时序植被指数动态模型的特征参数提取
基于拟合后的时序RNDRE和RNDVI曲线,本研究提取的冬小麦生长季特征参数如下:(1)RNDRE和RNDVI最大值
冬小麦RNDRE和RNDVI最大值一般出现在其孕穗—抽穗期,其值大小反映了最终形成营养器官的状态,体现了后期向籽粒转运物质的能力。
(2)累积RNDRE和RNDVI
冬小麦分蘖越冬期到成熟期的RNDRE和RNDVI曲线积分即累积RNDRE和RNDVI,反映了冬小麦各个生育时期的平均生长状况。
(3)RNDRE和RNDVI增长速率
RNDRE和RNDVI增长速率是指从分蘖越冬期到最大值的相对变化速率,通过公式(8)和(9)计算,反映了冬小麦在这一过程中的生长发育状态。
式中,RNDREincrease和RNDVIincrease表示生长过程RNDRE和RNDVI的增长速率,RNDREmax和RNDVImax表示冬小麦生长季RNDRE和RNDVI最大值,RNDREinitial和RNDVIinitial表示冬小麦分蘖越冬期的RNDRE和RNDVI值;RAGDDm表示冬小麦达到RNDRE和RNDVI最大值的RAGDD,RAGDDi表示分蘖越冬期出现的RAGDD。
(4)RNDRE和RNDVI下降速率
RNDRE和RNDVI下降速率是指从抽穗—开花期到成熟期的相对变化速率,通过公式(10)和(11)计算,反映了冬小麦衰老过程的生长发育状态。
式中,RNDREdecrease和RNDVIdecrease表示衰老过程的RNDRE和RNDVI变化速率,RNDREmature和RNDVImature表示冬小麦成熟期的RNDRE和RNDVI值,RNDREmax和RNDVImax表示冬小麦生长季RNDRE和RNDVI最大值;RAGDDmature表示冬小麦成熟期的RAGDD值,RAGDDm表示冬小麦达到RNDRE和RNDVI最大值的RAGDD。
1.5 冬小麦单产预测模型的构建和验证
本研究利用了试验1的数据集进行模型的构建,利用试验2的数据集进行模型的验证。首先,构建基于单生育时期NDRE和NDVI的冬小麦单产预测模型,并通过多元逐步线性回归法构建基于多生育时期NDRE和NDVI的多变量冬小麦单产预测模型。其次,基于时序RNDRE和RNDVI曲线提取的各特征参数建立单产预测模型,利用独立试验数据对所构建的各单产预测模型进行验证比较。1.6 模型比较与评价
通过计算每个模型的决定系数(R2,coefficient of determination)来评价模型的表现,但R2不适用于评估不同形式、不同参数个数的模型之间的预测和拟合性能,因为R2较高但参数较多的模型存在过度拟合的风险。因此,本研究进一步使用赤池信息准则(akaike information criterion, AIC)对模型进行比较分析,AIC的基本观点是所选择的模型是为了准确预测未来的数据,而不是为了推断校准数据的“真实分布”[26,27]。由于拟合模型的真实预测性能在很大程度上取决于模型的自由参数的数量,因此使用AIC选择模型剔除大量参数并阻止过度拟合[28]。AIC在R语言3.5中计算,其计算方法如公式(12)所示:式中,k是模型中参数的数量,$\hat{L}$是模型中极大似然函数值似然函数。在进行预测同一变量时,通常选取AIC值最小的模型。
通过比较预测值与实测值的R2、相对均方根误差(RRMSE,%)和相对误差(RE,%),来评价模型的验证效果。R2越高,RRMSE和RE越低,表示该模型预测单产的精度和准确性越高。RRMSE和RE的计算公式如公式(13)和(14)所示:
式中,Pi、Oi分别表示单产的预测值和实测值,${{\bar{O}}_{i}}$表示单产实测值的平均值,n表示模型测试样本数。
1.7 数据处理与分析
本研究采用Microsoft Excel 2016(Microsoft Corporation,Redmond,Washington,USA)进行数据整理,结合SPSS 25.0(SPSS Inc., Chicago, IL, USA)软件进行统计和分析;利用Origin 2016(OriginLab Corporation,Northampton,MA,USA)作图。2 结果
2.1 植被指数与冬小麦单产的定量关系
从表1可以看出,植被指数NDRE和NDVI与小麦单产的相关关系在不同品种及生育时期表现并不相同,总体而言,在拔节期相关性较差,在孕穗期—灌浆期相关性较好。综合所有数据,植被指数NDRE与冬小麦单产在孕穗期—灌浆期都表现出稳定的相关关系(R2>0.81);而NDVI与单产在孕穗期—灌浆期的关系略差于NDRE,R2为0.76—0.80。可见,植被指数NDRE和NDVI具有良好的估测单产的潜力,NDRE略优于NDVI,且在孕穗期—抽穗期最佳。Table 1
表1
表1不同生育时期植被指数与冬小麦单产的相关关系
Table 1
| 植被指数 Vegetation index | 品种 Variety | 样本 Sample | 拔节期 Jointing stage | 孕穗期 Booting stage | 抽穗期 Heading stage | 开花期 Flowering stage | 灌浆期 Filling stage |
|---|---|---|---|---|---|---|---|
| NDRE | 镇麦12 Zhenmai 12 | 30 | 0.66 | 0.89 | 0.88 | 0.86 | 0.89 |
| 扬麦23 Yangmai 23 | 30 | 0.46 | 0.83 | 0.82 | 0.75 | 0.84 | |
| 宁麦13 Ningmai 13 | 30 | 0.72 | 0.92 | 0.92 | 0.91 | 0.91 | |
| 所有品种 All | 90 | 0.60 | 0.86 | 0.85 | 0.81 | 0.81 | |
| NDVI | 镇麦12 Zhenmai 12 | 30 | 0.62 | 0.79 | 0.81 | 0.84 | 0.83 |
| 扬麦23 Yangmai 23 | 30 | 0.54 | 0.79 | 0.75 | 0.77 | 0.75 | |
| 宁麦13 Ningmai 13 | 30 | 0.81 | 0.86 | 0.81 | 0.84 | 0.85 | |
| 所有品种 All | 90 | 0.63 | 0.79 | 0.77 | 0.80 | 0.76 |
新窗口打开|下载CSV
为提高预测单产的准确性和稳定性,本研究尝试通过多元逐步线性回归方法,利用多生育时期NDRE和NDVI构建多变量冬小麦单产预测模型(表2)。结果表明,对于同一植被指数而言,无论利用几个时期的数据,其R2、RRMSE和RE没有明显的差异。因此,表明利用较少的时期就可以满足单产预测结果的准确性。对于NDRE而言,当利用拔节期和孕穗期的数据时,其AIC最小,模型表现最优。对于NDVI而言,当利用孕穗期、抽穗期和开花期3个生育时期的数据时,AIC最小,模型表现较优。
Table 2
表2
表2基于多元逐步线性回归基的不同生育时期植被指数单产预测模型
Table 2
| 植被指数 Vegetation index | 回归方程 Regression equation | 决定系数 R2 | 相对均方根误差 RRMSE (%) | 相对误差 RE (%) | 赤池信息准则 AIC |
|---|---|---|---|---|---|
| NDRE | y= -2.16x1+16.83x2+9.15x3-4.40x4-2.35x5-0.75 | 0.86 | 8.98 | 9.82 | -97.95 |
| y= -2.85x1+17.69x2+5.67x3-3.23x5-0.90 | 0.86 | 8.99 | 9.84 | -99.74 | |
| y= -2.54x1+21.94x2-2.14x5-0.81 | 0.86 | 9.02 | 9.82 | -101.37 | |
| y= -2.53x1+19.90x2-0.75 | 0.86 | 9.02 | 9.84 | -103.01 | |
| NDVI | y=0.14x1+11.23x2-13.22x3+23.12x4-3.57x5-8.31 | 0.81 | 10.41 | 11.70 | -71.45 |
| y=11.25x2-13.36x3+23.27x4-3.38x5-8.36 | 0.81 | 10.40 | 11.76 | -73.44 | |
| y=12.21x2-14.79x3+19.45x4-7.45 | 0.81 | 10.43 | 11.62 | -74.96 |
新窗口打开|下载CSV
2.2 不同品种及氮水平对植被指数NDRE和NDVI的影响
冬小麦全生育时期冠层植被指数NDRE(图2)和NDVI(图3)在不同品种和氮水平间变化趋势基本相同,随着AGDD的增加,植被指数NDRE和NDVI呈现先增加后降低的趋势。在冬小麦生长前期,由于冬小麦未封行,受土壤背景的影响不同氮水平之间植被指数差异较小,而当AGDD大于650,冬小麦封行之后(即拔节期),植被指数值随着施氮量的增加而升高,处理间差异较为明显。图2
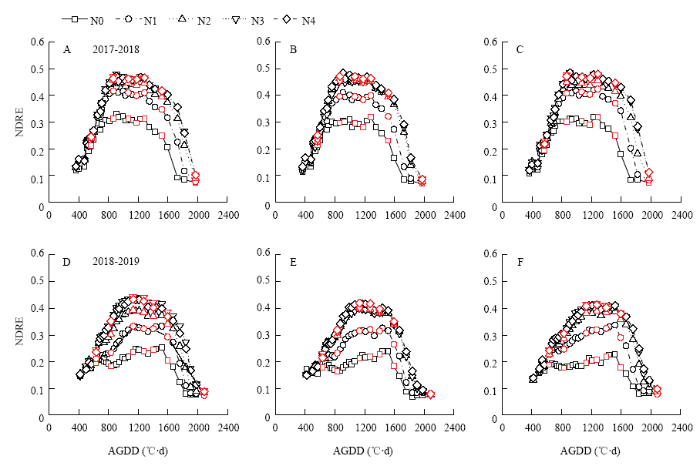 新窗口打开|下载原图ZIP|生成PPT
图2不同氮素水平下基于AGDD的NDRE变化动态
红色的点表示返青期、拔节期、孕穗期、抽穗期、开花期、灌浆期和成熟期的测试。A:镇麦12;B:扬麦23;C:宁麦13;D:镇麦12;E:扬麦23;F:宁麦13。下同
Fig. 2Dynamic changes of NDRE based on AGDD with different nitrogen rates
The red dots indicate the tests at the greening stage, jointing stage, booting stage, heading stage, flowering stage, filling stage and maturity stage. A: Zhenmai12; B: Yangmai23; C: Ningmai13; D: Zhenmai12; E: Yangmai23; F: Ningmai13. The same as below
图3
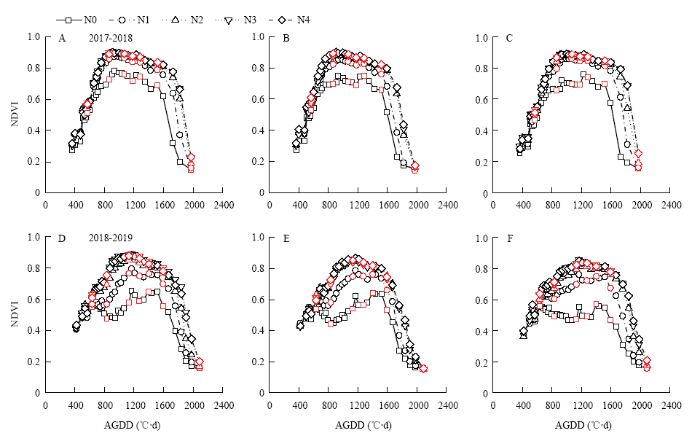 新窗口打开|下载原图ZIP|生成PPT
图3不同氮素水平下基于AGDD的NDVI变化动态
Fig. 3Dynamic changes of NDVI based on AGDD with different nitrogen rates
2.3 RNDRE和RNDVI时序曲线拟合模型
结合作物生长发育规律,基于双Logistic模型拟合冬小麦生长发育过程中植被指数RNDRE和RNDVI的动态变化,图4表明,随着RAGDD的增加,时序RNDRE和RNDVI呈现出相似的趋势,即先增加后下降的动态变化规律。由表3可知,冬小麦生长过程中最大速度a和衰老过程中的最大速度c因施氮水平而异,2种植被指数均以N3、N4水平最高,在N0水平下最低。且2种植被指数的生长拐点b和衰老拐点d均在N0水平下先出现,表明在低N水平下的冬小麦生育进程缩短,生长发育差,容易造成冬小麦单产降低。从模型拟合精度来看,施氮水平越高,模型的精度也越高,N3和N4水平下的RNDRE和RNDVI曲线拟合R2达到0.95以上,RMSE小于0.045,且N3、N4的曲线基本重合(图4),可能是因为氮素过量,造成冬小麦群体过大,植被指数趋于饱和。相较于其他氮处理,N0处理的曲线拟合精度略低,R2<0.80,RMSE<0.066。总体而言,时序RNDRE曲线拟合精度较RNDVI曲线拟合精度高,可能是因为红边波段的植被指数更为稳定。图4
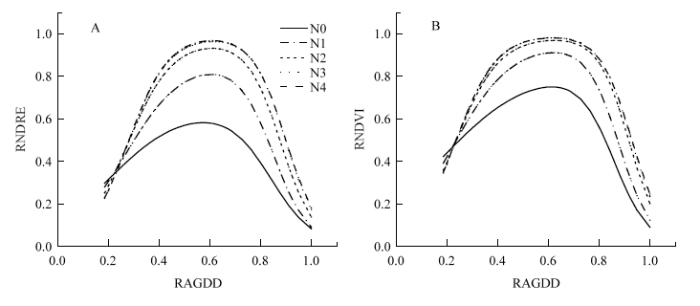 新窗口打开|下载原图ZIP|生成PPT
图4不同氮素水平下RNDRE(A)和RNDVI(B)时序曲线变化动态
Fig. 4The dynamic changes of time-series curve of RNDRE (A) and RNDVI (B) with different nitrogen rates
Table 3
表3
表3不同氮处理下基于RAGDD的时序RNDRE和RNDVI曲线拟合参数
Table 3
| 植被指数 Vegetation index | 氮处理 N treatment | 曲线参数 Parameters of curves | 决定系数 R2 | 均方根误差 RMSE | |||||
|---|---|---|---|---|---|---|---|---|---|
| A1 | A2 | a | b | c | d | ||||
| RNDRE | N0 | 0.655 | 0.506 | 7.10 | 0.21 | 11.84 | 0.84 | 0.78 | 0.066 |
| N1 | 0.876 | 0.714 | 8.97 | 0.27 | 14.25 | 0.85 | 0.91 | 0.063 | |
| N2 | 0.969 | 0.791 | 11.42 | 0.28 | 15.04 | 0.88 | 0.96 | 0.047 | |
| N3 | 0.988 | 0.786 | 12.74 | 0.28 | 15.51 | 0.90 | 0.97 | 0.043 | |
| N4 | 0.995 | 0.788 | 12.70 | 0.28 | 15.10 | 0.90 | 0.97 | 0.043 | |
| RNDVI | N0 | 0.837 | 0.668 | 5.85 | 0.18 | 14.29 | 0.86 | 0.79 | 0.082 |
| N1 | 0.956 | 0.785 | 8.80 | 0.23 | 15.70 | 0.88 | 0.91 | 0.062 | |
| N2 | 0.987 | 0.776 | 11.59 | 0.23 | 16.60 | 0.92 | 0.94 | 0.053 | |
| N3 | 0.997 | 0.760 | 12.29 | 0.24 | 16.22 | 0.93 | 0.96 | 0.044 | |
| N4 | 0.996 | 0.754 | 12.46 | 0.24 | 15.84 | 0.93 | 0.95 | 0.045 | |
新窗口打开|下载CSV
2.4 基于时序曲线特征参数的冬小麦单产预测模型
由表4可知,基于双Logistic函数拟合提取的曲线特征参数值因不同施氮水平而异,随着施氮水平的增加,RNDRE和RNDVI最大值、累积值、增长速率和下降速率值也是上升的。RNDRE和RNDVI曲线拟合提取的4个特征参数均在N0水平下达到最小值,在高氮水平(N3、N4)下可以达到最大值。从表5可以看出,时序曲线特征参数与冬小麦单产具有稳定的相关性,其中最大值、累积值和增长速率与单产相关性较好。对于RNDRE和RNDVI而言,AIC最小的模型均是基于增长速率建立的单产模型。Table 4
表4
表4不同氮素水平下RNDRE和RNDVI时序曲线特征参数
Table 4
| 氮处理 N treatment | RNDRE | RNDVI | |||||||
|---|---|---|---|---|---|---|---|---|---|
| 最大值 Maximum | 累积值 Accumulative value | 增长速率 Increase rate | 下降速率 Decrease rate | 最大值 Maximum | 累积值 Accumulative value | 增长速率 Increase rate | 下降速率 Decrease rate | ||
| N0 | 0.582 | 0.349 | 0.721 | 1.187 | 0.750 | 0.456 | 0.772 | 1.693 | |
| N1 | 0.809 | 0.464 | 1.245 | 1.841 | 0.911 | 0.558 | 1.186 | 2.091 | |
| N2 | 0.931 | 0.550 | 1.598 | 2.037 | 0.968 | 0.623 | 1.396 | 2.039 | |
| N3 | 0.963 | 0.580 | 1.731 | 2.028 | 0.981 | 0.637 | 1.452 | 1.983 | |
| N4 | 0.968 | 0.583 | 1.737 | 2.018 | 0.980 | 0.639 | 1.488 | 1.885 | |
新窗口打开|下载CSV
Table 5
表5
表5基于RNDRE和RNDVI时序曲线特征参数的冬小麦单产预测模型
Table 5
| 植被指数 Vegetation index | 特征参数 Characteristic parameter | 单产预测模型 Yield prediction model | R2 | RRMSE (%) | RE (%) | AIC |
|---|---|---|---|---|---|---|
| RNDRE | 最大值 Maximum | y = 8.72x - 1.37 | 0.80 | 10.2 | 12.9 | 62.29 |
| 累积值 Accumulative value | y = 14.39x - 1.22 | 0.82 | 9.9 | 12.9 | 60.41 | |
| 增长速率 Increase rate | y = 3.32x + 1.38 | 0.82 | 9.9 | 12.8 | 60.35 | |
| 下降速率 Decrease rate | y = 3.73x - 0.75 | 0.73 | 12.0 | 14.3 | 71.98 | |
| RNDVI | 最大值 Maximum | y = 14.24x - 7.03 | 0.77 | 11.0 | 13.4 | 66.48 |
| 累积值 Accumulative value | y = 18.24x - 4.58 | 0.80 | 10.2 | 12.9 | 62.18 | |
| 增长速率 Increase rate | y = 4.82x - 0.02 | 0.81 | 10.2 | 12.8 | 61.84 | |
| 下降速率 Decrease rate | y = 5.04x - 3.72 | 0.22 | 20.3 | 25.6 | 103.41 |
新窗口打开|下载CSV
2.5 单产预测模型的验证
为了探明单产预测模型的准确性和效果,用独立试验数据对上述模型进行验证。基于单生育时期NDRE和NDVI构建的单产预测模型,如表6所示,其在拔节期的验证结果较差,R2小于0.6;其在孕穗期—灌浆期的验证结果较好,R2大于0.68,RRMSE和RE小于20%。基于多元逐步线性回归构建的基于NDRE多生育时期单产预测模型验证结果略优于NDVI,但与单生育时期模型相比无显著提高。从表7可以看出,基于时序RNDRE曲线特征参数构建单产模型,其最大值和累积值所构建的单产模型验证结果较好,R2大于0.8,RRMSE和RE小于10%;而增长速率和下降速率构建的单产模型验证结果较差,R2小于0.5。基于时序RNDVI曲线特征参数构建的单产模型也展示了相似的结果,但略差于时序RNDRE曲线特征参数所构建的模型(图6)。综合考虑,基于RNDRE最大值和累积值构建的单产模型验证结果较好,其验证效果优于利用单生育时期或多生育时期的预测模型,且优于基于NDVI构建的单产模型。Table 6
表6
表6基于NDRE和NDVI的冬小麦单产预测模型验证结果
Table 6
| 植被指数 Vegetation index | 模型 Model | 单产预测模型 Yield prediction model | R2 | RRMSE (%) | RE (%) |
|---|---|---|---|---|---|
| RNDRE | 单生育时期线性回归单产模型 Yield model based on linear regression in single growth stage | 拔节期 Jointing y=12.47x+1.67 | 0.59 | 24.3 | 23.5 |
| 孕穗期 Booting y =17.34x-0.65 | 0.79 | 18.7 | 18.2 | ||
| 抽穗期 Heading y =17.46x-0.73 | 0.77 | 17.4 | 16.6 | ||
| 开花期 Flowering y =17.97x-0.87 | 0.79 | 17.7 | 16.7 | ||
| 灌浆期 Filling y =17.46x+0.13 | 0.71 | 15.5 | 14.4 | ||
| 多元逐步线性回归模型 Yield model based on stepwise multiple linear regression | y= -2.16x1+16.83x2+9.15x3-4.40x4-2.35x5-0.75 | 0.81 | 17.6 | 17.3 | |
| y= -2.85x1+17.69x2+5.67x3-3.23x5-0.90 | 0.80 | 17.8 | 17.6 | ||
| y= -2.54x1+21.94x2-2.14x5-0.81 | 0.78 | 18.3 | 18.2 | ||
| y= -2.53x1+19.90x2-0.75 | 0.79 | 17.7 | 17.4 | ||
| RNDVI | 单生育时期线性回归单产模型 Yield model based on linear regression in single growth stage | 拔节期 Jointing y = 8.8027x - 0.4221 | 0.56 | 14.2 | 17.2 |
| 孕穗期 Booting y = 11.822x - 3.4517 | 0.73 | 13.6 | 14.4 | ||
| 抽穗期 Heading y = 12.877x - 4.3125 | 0.68 | 16.1 | 17.4 | ||
| 开花期 Flowering y = 17.707x - 8.1348 | 0.73 | 17.5 | 19.5 | ||
| 灌浆期 Filling y = 13.383x - 3.9326 | 0.75 | 16.4 | 15.3 | ||
| 多元逐步线性回归模型 Yield model based on stepwise multiple linear regression | y=0.14x1+11.23x2-13.22x3+23.12x4-3.57x5-8.31 | 0.69 | 16.6 | 19.6 | |
| y=11.25x2-13.36x3+23.27x4-3.38x5-8.36 | 0.69 | 16.7 | 19.7 | ||
| y=12.21x2-14.79x3+19.45x4-7.45 | 0.68 | 16.3 | 18.2 |
新窗口打开|下载CSV
Table 7
表7
表7基于RNDRE和RNDVI时序曲线特征参数的冬小麦单产模型验证结果
Table 7
| 特征参数 Characteristic parameter | RNDRE | RNDVI | |||||
|---|---|---|---|---|---|---|---|
| R2 | RRMSE (%) | RE (%) | R2 | RRMSE (%) | RE (%) | ||
| 最大值 Maximum | 0.81 | 8.0 | 8.4 | 0.65 | 12.1 | 15.1 | |
| 累积值 Accumulative value | 0.80 | 9.6 | 9.9 | 0.72 | 16.9 | 15.9 | |
| 增长速率 Increase rate | 0.36 | 19.8 | 20.8 | 0.01 | 78.1 | 90.8 | |
| 下降速率 Decrease rate | 0.44 | 24.3 | 23.7 | 0.07 | 46.0 | 44.8 | |
新窗口打开|下载CSV
图5
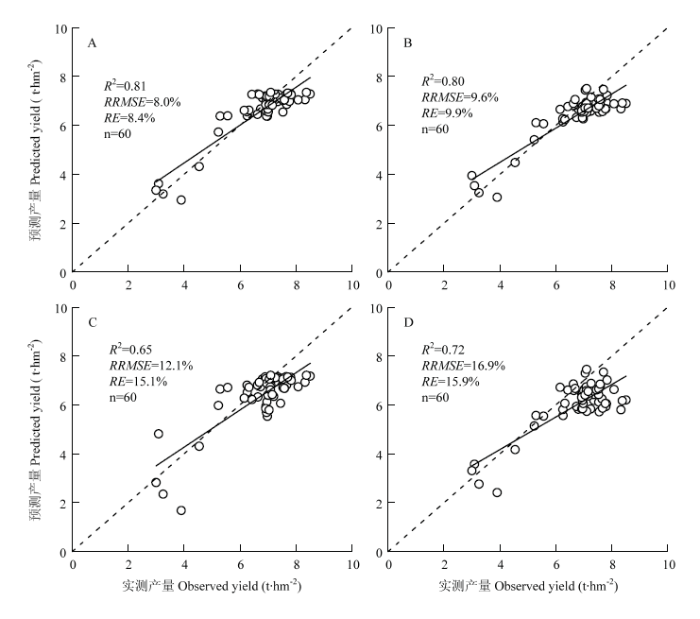 新窗口打开|下载原图ZIP|生成PPT
图5基于RNDRE(A:最大值;B:累积值)和RNDVI(C:最大值;D:累积值)时序曲线特征的单产预测模型验证结果
Fig. 5Validation results of evaluation with winter wheat yield prediction models based on the characteristic parameters of time-series RNDRE (A: Maximum; B: Accumulative value) and RNDVI (C: Maximum; D: Accumulative value) curve
3 讨论
3.1 植被指数与冬小麦单产之间的关系
植被指数被广泛应用在基于卫星遥感的单产预测研究中,研究表明获取于MODIS和HJ-1A/1B影像的植被指数NDVI等能有效预测油菜、小麦等作物的产量[1, 29-30]。近地面遥感也有利用植被指数进行单产预测的研究,HASSAN等[31]利用无人机搭载多光谱传感器获取NDVI,结果表明在小麦灌浆期预测单产效果最好。前人研究大多基于传统植被指数NDVI等进行单产预测,而本研究使用了基于红边波段的植被指数NDRE,有关研究表明基于红边波段的植被指数能有效改善其与单产的相关性[32]。与NDVI和增强型植被指数(EVI)相比,前人研究表明宽动态范围植被指数(WDRVI)能准确预测小麦产量[33]。本研究比较了不同生育时期植被指数NDRE和NDVI与冬小麦单产的相关性(表1),除拔节期关系较差外,其他生育时期均较好,且总体而言,基于NDRE的结果优于NDVI,原因可能是NDRE带有红边波段,其植被指数稳定性较高,也有研究表明带有红边波段的植被指数预测产量时效果更好[17]。通过多元逐步回归分析结果表明,利用多个生育时期的植被指数所构建的模型可进一步提高单产预测的精度。上述研究结果表明,多生育时期的植被指数可以更为全面反映产量的形成过程,利用其预测小麦产量效果更佳。3.2 时序植被指数曲线特征参数与冬小麦单产之间的关系
利用单时相数据预测作物物候期和单产易导致一定误差,而多时相的时序数据能够较准确预测作物物候期,具有提升估产精度的潜力。前人利用环境减灾卫星获取时序植被指数并通过重构植被指数时序数据获取曲线特征参数,利用其构建的估产模型效果较好[9]。已有研究基于获取的时序EVI并利用S-G滤波重构时序EVI曲线,其曲线特征参数中最大值与产量相关性较好,也有研究基于NDRE构建了水稻早中期动态模型,其曲线特征平台值与产量关系较好[34,35]。本研究通过近地面主动冠层传感器获取的植被指数,构建时序曲线并提取特征参数预测冬小麦单产。其中,时序曲线最大值可以反映冬小麦群体生长的潜力,基于其构建的单产预测模型准确性较高;时序曲线增长速率可以反映冬小麦生长季的营养生长期状态;时序曲线下降速率反映了冬小麦生殖生长期的状态;累积植被指数反映出冬小麦全生育时期的生长状态。本研究结果表明,RNDRE时序曲线最大值、累积值与冬小麦单产具有良好的线性关系,其结果略优于基于RNDVI时序曲线最大值和累积值构建的单产模型,原因可能是带有红边波段的植被指数RNDRE稳定性较高,饱和程度较低,且产量的形成过程是一个不断累积的过程,因此,利用全生育时期RNDRE曲线特征参数具有良好估测小麦单产的潜力(图6)。前人关于时序植被指数的研究多是基于卫星遥感获取的,并且多基于时序NDVI,而本文是基于手持式传感器每隔3—5 d天测试1次,意在获取更丰富的时序植被指数数据,可以不受环境条件的影响。3.3 时序植被指数动态估产模型的应用性
作物生长过程具有时序动态性,充分利用不同时期间差异以及多时期的综合信息,可以提高对作物分类、生育期估测和单产预测等评价精度。已有研究基于MODIS-NDVI时序数据进行作物分类、预测冬小麦生育期均表现较好[36,37]。JOHNSON[38]基于MODIS时序遥感产品对玉米等单产预测R2达到0.7以上。时序植被指数被同化到作物模型中,也能够提高作物估产的精度[39,40]。作物不同时期和氮水平的长势显著影响植被指数,进而会影响时序植被指数模型的参数。本研究采用双Logistic函数拟合时序植被指数曲线,能较好地反映冬小麦冠层植被指数的动态轨迹。前人研究多基于单生育时期或几个生育时期的光谱数据预测小麦单产,其结果可能较好,但并不能反映产量的形成过程。产量形成是一个不断累积的过程,全生育时期的时序光谱可以更加全面反映这一形成过程,因此时序曲线具有更好的预测小麦产量的潜力。作物时序植被指数的动态模型采用播种后天数、每年中的天数(days of year)等作为时间驱动因子的研究较多[41,42],由于作物不同条件下的温光反应、基因型效应与阶段发育之间的动态关系使得作物全生育时期天数差异较大,导致模型缺乏动态性和广适性。本研究采用RAGDD为时间驱动因子可以较好地消除不同年份、品种对冬小麦时序植被指数模型的影响,而且模型参数较少,生物学意义比较明确。在冬小麦实际生产中获取时序光谱,通过构建本地化时序植被指数模型对当地冬小麦单产进行预测。由于影响冬小麦单产的因素很多,诸如品种、栽培条件、土壤背景、气候因素等,在未来研究中,需融合上述因素建立单产预测模型,从而提高单产预测的准确性和精度。本试验研究只在兴化市一个试验点进行,还需增加其他生态点试验来进行模型的验证与调优,从而提高模型的稳定性。4 结论
冬小麦生长季植被指数NDRE和NDVI具有良好的估测单产的潜力,NDRE略优于NDVI,且在孕穗期—抽穗期最佳。基于多元逐步线性回归构建的基于NDRE多生育时期单产预测模型验证结果略优于NDVI,与单生育时期模型相比无显著提高。基于RNDRE时序曲线最大值和累积值所构建的单产模型效果较好,其结果略优于基于RNDVI时序曲线最大值和累积值构建的单产模型。综合考虑,表明RNDRE最大值和累积值具有良好估测单产的潜力。研究结果为田间进行实时、准确的单产预测提供了技术参考,但是冬小麦单产受土壤、生态点、气候及生产水平影响较大,本研究的时序植被指数单产预测模型还需在不同生态区域检验其适用性和可靠性。参考文献 原文顺序
文献年度倒序
文中引用次数倒序
被引期刊影响因子
DOI:10.3864/j.issn.0578-1752.2017.16.005URL [本文引用: 2]

【目的】卫星遥感具有覆盖范围广、获取速度快、信息量大、动态性强等优势,能够及时准确地获取作物产量信息,反映作物产量空间变化趋势。遥感技术作物估产已成为现代农业生产中研究热点。通过改善遥感估产建模方法,以实现进一步提高大田作物遥感估产精度,为宏观了解不同区域作物产量形成情况及变化趋势提供直观、可靠的参考。【方法】论文结合2011—2012年江苏省大丰、兴化、姜堰、泰兴、仪征5个县区的定点观测试验,以国产卫星产品HJ-1A/1B影像为遥感数据,于小麦开花期开展大田定位观测区卫星遥感植被指数、关键生长指标与收获期单产间的定量分析。通过对产量与小麦生长指标以及植被指数进行定量关系分析,进一步增强遥感反演的机理性和重演性。将卫星遥感变量与小麦产量进行相关关系分析作为遥感估产的直接建模方法,间接建模方法则是选取与产量相关性较好的遥感变量以及与遥感变量相关性较好的主要苗情指标,利用筛选得到的敏感遥感变量,首先监测对应的小麦生长指标,结合该小麦生长指标与产量间的定量关系,进而建立间接估产模型,利用此模型进行小麦遥感间接估产。利用直接和间接建模方法,以相关性最高为原则,筛选估算产量的敏感卫星遥感变量。以2012年试验数据为建模样本,采用线性回归分析方法,分析小麦开花期苗情指标、产量与卫星遥感变量两两之间的相关性,分别构建以遥感植被指数为基础的大田小麦估产模型,与地面实测结果一起建立模型共同分析。以2011年试验数据为验证样本,选取评价指标拟合度(R2)和均方根误差(RMSE),对两类模型的估算精度进行验证和比较,以提高遥感反演的定量化水平和可信度。【结果】分别以差值植被指数(difference vegetation index,DVI)和比值植被指数(ratio vegetation index,RVI)为基础的单因子直接估产模型的均方根误差(root mean square error,RMSE)为918 kg·hm-2和1 399.5 kg·hm-2,以DVI和RVI遥感变量构建双变量估产模型的RMSE为1 036.5 kg·hm-2,以归一化植被指数(normalized difference vegetation index,NDVI)和叶片氮积累量为基础构建的间接估产模型的RMSE为805.5 kg·hm-2,说明开花期HJ-1A/1B影像估算小麦区域产量是可行的,且精度较高;经比较,以NDVI和叶片氮积累量为基础的间接估产模型精度明显高于直接估产模型,相较于DVI直接估产模型RMSE降低了112.5 kg·hm-2,相较于RVI直接估产模型RMSE降低了594 kg·hm-2,相较于双因子模型RMSE降低了231 kg·hm-2。【结论】国产卫星HJ-1A/B可以较好满足估测小麦产量要求,且利用间接方法建立作物遥感估产模型要好于直接方法,研究结果为利用遥感技术更为准确估算大田小麦产量提供了一种新的途径。
DOI:10.3864/j.issn.0578-1752.2017.16.005URL [本文引用: 2]
【目的】卫星遥感具有覆盖范围广、获取速度快、信息量大、动态性强等优势,能够及时准确地获取作物产量信息,反映作物产量空间变化趋势。遥感技术作物估产已成为现代农业生产中研究热点。通过改善遥感估产建模方法,以实现进一步提高大田作物遥感估产精度,为宏观了解不同区域作物产量形成情况及变化趋势提供直观、可靠的参考。【方法】论文结合2011—2012年江苏省大丰、兴化、姜堰、泰兴、仪征5个县区的定点观测试验,以国产卫星产品HJ-1A/1B影像为遥感数据,于小麦开花期开展大田定位观测区卫星遥感植被指数、关键生长指标与收获期单产间的定量分析。通过对产量与小麦生长指标以及植被指数进行定量关系分析,进一步增强遥感反演的机理性和重演性。将卫星遥感变量与小麦产量进行相关关系分析作为遥感估产的直接建模方法,间接建模方法则是选取与产量相关性较好的遥感变量以及与遥感变量相关性较好的主要苗情指标,利用筛选得到的敏感遥感变量,首先监测对应的小麦生长指标,结合该小麦生长指标与产量间的定量关系,进而建立间接估产模型,利用此模型进行小麦遥感间接估产。利用直接和间接建模方法,以相关性最高为原则,筛选估算产量的敏感卫星遥感变量。以2012年试验数据为建模样本,采用线性回归分析方法,分析小麦开花期苗情指标、产量与卫星遥感变量两两之间的相关性,分别构建以遥感植被指数为基础的大田小麦估产模型,与地面实测结果一起建立模型共同分析。以2011年试验数据为验证样本,选取评价指标拟合度(R2)和均方根误差(RMSE),对两类模型的估算精度进行验证和比较,以提高遥感反演的定量化水平和可信度。【结果】分别以差值植被指数(difference vegetation index,DVI)和比值植被指数(ratio vegetation index,RVI)为基础的单因子直接估产模型的均方根误差(root mean square error,RMSE)为918 kg·hm-2和1 399.5 kg·hm-2,以DVI和RVI遥感变量构建双变量估产模型的RMSE为1 036.5 kg·hm-2,以归一化植被指数(normalized difference vegetation index,NDVI)和叶片氮积累量为基础构建的间接估产模型的RMSE为805.5 kg·hm-2,说明开花期HJ-1A/1B影像估算小麦区域产量是可行的,且精度较高;经比较,以NDVI和叶片氮积累量为基础的间接估产模型精度明显高于直接估产模型,相较于DVI直接估产模型RMSE降低了112.5 kg·hm-2,相较于RVI直接估产模型RMSE降低了594 kg·hm-2,相较于双因子模型RMSE降低了231 kg·hm-2。【结论】国产卫星HJ-1A/B可以较好满足估测小麦产量要求,且利用间接方法建立作物遥感估产模型要好于直接方法,研究结果为利用遥感技术更为准确估算大田小麦产量提供了一种新的途径。
[本文引用: 1]
[本文引用: 1]
URL [本文引用: 1]
采用Mahalanobis Distance分类法提取了冬小麦种植面积,通过搭建决策树结构进行了不同灌溉类型冬小麦种植面积的提取,通过两个年份不同生育时期MODIS-NDVI的比较,分析了NDVI时间曲线与冬小麦长势的响应规律和水旱地冬小麦年同期长势。结果表明:2007年临汾地区冬小麦总种植面积为234778.5 hm2,提取精度为96.96%,其中水地种植面积为107488.3 hm2,提取精度为86.15%,旱地冬小麦为127290.2 hm2,提取精度为86.16%。生育期内,水地冬小麦整体长势好于旱地冬小麦,通过NDVI变化斜率比较,表明随着生育期的推进,水地冬小麦NDVI达到峰值前的上升速度远大于旱地冬小麦,峰值后水地冬小麦NDVI下降速度小于旱地冬小麦。
[本文引用: 1]
[本文引用: 1]
[本文引用: 1]
[本文引用: 1]
[本文引用: 1]
[本文引用: 2]
DOI:10.1016/j.rse.2011.10.011URL [本文引用: 1]
The global distribution of croplands is of critical interest to a wide group of end-users. Different crops have their own representative phenological stages during their growing seasons, which differ considerably from other natural vegetation types. During the last decade, the Moderate Resolution Imaging Spectroradiometer (MODIS) has become a key tool for vegetation monitoring because of its high temporal resolution, extensive scope, and rapid availability of various products. However, mixed pixels caused by the moderate spatial resolution produce significant errors in crop area estimation. Here we propose a Crop Proportion Phenology Index (CPPI) to express the quantitative relationship between the MODIS vegetation index (VI) time series and winter wheat crop area. The utility of this index was tested in two experimental areas in China: one around Tongzhou and the other around Shuyang, as representative districts around a metropolis and a rural area, respectively. The CPPI performed well in these two regions, with the root mean square error (RMSE) in fractional crop area predictions ranging roughly from 15% in the individual pixels to 5% above 6.25 km(2). The training samples containing mixtures of crop types mitigated the challenges of pure end-member selection in a spectral mixture analysis. A small number of training samples are sufficient to generate the CPPI, which is adaptable to other crop types and larger regions. Estimating the CPPI parameters across larger spatial scales helped improve the stability of the model. (C) 2011 Elsevier Inc.
URL [本文引用: 2]
依托国产环境减灾卫星构建作物归一化植被指数(NDVI)时序曲线,不但能提供与MODIS-NDVI、AVHRR-NDVI几乎相当的作物生长动态变化信息,还能提供更高分辨率的空间信息,将其应用于作物估产应更有优势。该研究以地处鲁西北平原的山东省禹城市为研究区,探讨基于环境减灾卫星影像构建冬小麦NDVI时序曲线,基于曲线特征参数,开展遥感估产的可行性。结果表明,可依赖环境减灾卫星遥感影像,重建冬小麦NDVI时序曲线,求算其生长季最大NDVI、返青期NDVI、生长季累积NDVI、营养生长期NDVI的变化速率、生殖生长期NDVI的变化速率等特征参数,建立可靠的估产模型。所建模型的建模决定系数为0.87,相对误差为5.02%;交叉检验决定系数为0.78,相对误差为6.87%。该研究可为基于遥感的作物估产提供参考。
DOI:10.2134/agronj2013.0242URL [本文引用: 1]
[本文引用: 1]
DOI:10.1016/j.agrformet.2015.11.009URL [本文引用: 1]
[本文引用: 1]
[本文引用: 1]
[本文引用: 1]
URL [本文引用: 1]
为了准确定量诊断氮素状况,为施肥和产量、品质的估测提供参考,该文通过设置不同氮素水平和品种类型的冬小麦田间试验,分析孕穗至灌浆初期不同光谱参数在小麦氮素营养状况监测上的差异,筛选叶片氮素含量和冠层氮素密度反演效果较好的参数,建立其与氮营养指数(NNI,nitrogen nutrition index)的经验模型。研究表明,线性内插法红边位置(REPLI)、修正红边单比指数(mSR705)、比值指数(RI-1dB)、简单比值色素指数(SRPI)、红边指数(VOG)等光谱参数与氮素营养指标具有良好的相关性(r>0.85),且不受生育期影响,可用来反演评价冠层氮素营养状况;研究对筛选的光谱参数与各氮素指标进行回归建模,并用独立试验数据对所建模型进行验证,结果显示,REPLI在氮营养指数估测方面表现较好(r=0.93),估测模型精度较高(决定系数R2=0.86,均方根误差RMSE = 0.08)。NNI在氮素营养状况诊断方面有一定的优势,通过高光谱反演氮营养指数进行氮素营养状态的定性定量诊断有一定的可行性。
[本文引用: 2]
DOI:10.1038/s41598-017-14597-1URLPMID:29074943 [本文引用: 1]
RapidSCAN is a new portable active crop canopy sensor with three wavebands in red, red-edge, and near infrared spectral regions. The objective of this study was to determine the potential and practical approaches of using this sensor for non-destructive diagnosis of rice nitrogen (N) status. Sixteen plot experiments and ten on-farm experiments were conducted from 2014 to 2016 in Jiansanjiang Experiment Station of the China Agricultural University and Qixing Farm in Northeast China. Two mechanistic and three semi-empirical approaches using the sensor's default vegetation indices, normalized difference vegetation index and normalized difference red edge, were evaluated in comparison with the top performing vegetation indices selected from 51 tested indices. The results indicated that the most practical and stable method of using the RapidSCAN sensor for rice N status diagnosis is to calculate N sufficiency index with the default vegetation indices and then to estimate N nutrition index non-destructively (R(2) = 0.50-0.59). This semi-empirical approach achieved a diagnosis accuracy rate of 59-76%. The findings of this study will facilitate the application of the RapidSCAN active sensor for rice N status diagnosis across growth stages, cultivars and site-years, and thus contributing to precision N management for sustainable intensification of agriculture.
DOI:10.3389/fpls.2018.01834URLPMID:30619407 [本文引用: 1]
Unmanned aerial vehicle (UAV) based active canopy sensors can serve as a promising sensing solution for the estimation of crop nitrogen (N) status with great applicability and flexibility. This study was endeavored to determine the feasibility of UAV-based active sensing to monitor the leaf N status of rice (Oryza sativa L.) and to examine the transferability of handheld-based predictive models to UAV-based active sensing. In this 3-year multi-locational study, varied N-rates (0-405 kg N ha(-1)) field experiments were conducted using five rice varieties. Plant samples and sensing data were collected at critical growth stages for growth analysis and monitoring. The portable active canopy sensor RapidSCAN CS-45 with red, red edge, and near infrared wavebands was used in handheld mode and aerial mode on a gimbal under a multi-rotor UAV. The results showed the great potential of UAV-based active sensing for monitoring rice leaf N status. The vegetation index-based regression models were built and evaluated based on Akaike information criterion and independent validation to predict rice leaf dry matter, leaf area index, and leaf N accumulation. Vegetation indices composed of near-infrared and red edge bands (NDRE or RERVI) acquired at a 1.5 m aviation height had a good performance for the practical application. Future studies are needed on the proper operation mode and means for precision N management with this system.
[本文引用: 1]
DOI:10.2135/cropsci1984.0011183X002400010007xURL [本文引用: 1]
DOI:10.1016/j.rse.2015.02.014URL [本文引用: 1]
[本文引用: 1]
DOI:10.4141/CJPS2013-293URL [本文引用: 1]
The leaf area index (LAI) and above-ground biomass are closely related to crop growth status and yields. Therefore, analysis of their variation and development of a mathematical model for their prediction can provide a theoretical basis for further research. This paper presents a new equation for logistic pattern that calculates above-ground biomass and LAI for different irrigation treatments independent of growing degree days (GDD) and plant height. The model root mean square of error (RMSE) for the LAI was from 0.25 to 1.36, and for above-ground biomass it was from 0.49 to 1.34. The r(2) values for the model's output under the single irrigation, double irrigation, triple irrigation, and quadruple irrigation treatments were 0.98, 0.87, 0.96, 0.98 and 0.99, respectively. For above-ground biomass they were 0.96, 0.97, 0.99, 0.97, and 0.97, respectively. The relative error for LAI ranged from 0.026 to 15.2%. For above-ground biomass, the Re ranged from 5.78 to 8.79%. The results gave good agreement between the estimated values and the measured values. The Logistic model was good at estimating the LAI and the above-ground biomass from the plant height.
DOI:10.1016/0034-4257(94)90143-0URL [本文引用: 1]
DOI:10.1214/10-STS330URL [本文引用: 1]
[本文引用: 1]
[本文引用: 1]
DOI:10.1016/j.agrformet.2010.11.012URL [本文引用: 1]
Although Normalised Difference Vegetation Index (NDVI) data derived from the advanced very high resolution radiometer (AVHRR) sensor have been extensively used to assess crop condition and yield on the Canadian Prairies and elsewhere, NDVI data derived from the new moderate resolution imaging spectroradiometer (MODIS) sensor have so far not been used for crop yield prediction on the Canadian Prairies. Therefore, the objective of this study was to evaluate the possibility of using MODIS-NDVI to forecast crop yield on the Canadian Prairies and also to identify the best time for making a reliable crop yield forecast. Growing season (May-August) MODIS 10-day composite NDVI data for the years 2000-2006 were obtained from the Canada Centre for Remote Sensing (CCRS). Crop yield data (i.e., barley, canola, field peas and spring wheat) for each Census Agricultural Region (CAR) were obtained from Statistics Canada. Correlation and regression analyses were performed using 10-day composite NDVI and running average NDVI for 2, 3 and 4 dekads with the highest correlation coefficients (r) as the independent variables and crop grain yield as the dependent variable. To test the robustness and the ability of the generated regression models to forecast crops grain yield, one year at a time was removed and new regression models were developed, which were then used to predict the grain yield for the missing year. Results showed that MODIS-NDVI data can be used effectively to predict crop yield on the Canadian Prairies. Depending on the agro-climatic zone, the power function models developed for each crop accounted for 48 to 90%, 32 to 82%, 53 to 89% and 47 to 80% of the grain yield variability for barley, canola, field peas and spring wheat, respectively, with the best prediction in the semi-arid zone. Overall (54 out of 84), the % difference of the predicted from the actual grain yield was within +/- 10%. On the whole, RMSE values ranged from 150 to 654, 108 to 475,204 to 677 and 104 to 714 kg ha(-1) for barley, canola, field peas and spring wheat, respectively. When expressed as percentages of actual yield, the RMSE values ranged from 8 to 25% for barley, 10 to 58% for canola, 10 to 38% for field peas and 6 to 34% for spring wheat. The MAE values followed a similar trend but were slightly lower than the RMSE values. For all the crops, the best time for making grain yield predictions was found to be from the third dekad of June through the third dekad of July in the sub-humid zone and from the first dekad of July through the first dekad of August in both the semi-arid and arid zones. This means that accurate crop grain yield forecasts using the developed regression models can be made one to two months before harvest. (C) 2010 Elsevier B.V.
URL [本文引用: 1]
Terra-MODIS数据集同时具有归一化植被指数(NDVI)和增强型植被指数(EVI)两种植被指数。为了对比这两种植被指数在农作物估产中的应用效果,该文利用MODIS-NDVI和MODIS-EVI作为遥感特征参量,以对美国冬小麦的长势监测与产量预测为例进行了研究: 运用区域作物特定生育期内多年的NDVI和EVI值与作物产量进行相关分析,采用一次线性拟合方法分别建立回归方程,估算当年的农作物产量。结果表明,EVI明显地比NDVI更好地与产量建立回归方程,用EVI建立的回归方程,各州相关系数大多在0.7以上;而用NDVI建立的回归方程,相关性不稳定。因此利用EVI建立的模型对2004年美国冬小麦进行估产,并将预测结果与美国国家统计署6月1号公布的预测结果进行对比,结果发现,美国国家统计署预测单产误差为3.05%,总产误差为-2.56%,而该研究预测结果单产误差为2.62%,总产误差为-1.77%且预测时间比美国国家统计署预测时间提前约半个月。可见EVI可以更有效地进行作物监测及估产,提高预测的准确性。
DOI:10.1016/j.plantsci.2018.10.022URLPMID:31003615 [本文引用: 1]
Wheat improvement programs require rapid assessment of large numbers of individual plots across multiple environments. Vegetation indices (VIs) that are mainly associated with yield and yield-related physiological traits, and rapid evaluation of canopy normalized difference vegetation index (NDVI) can assist in-season selection. Multi-spectral imagery using unmanned aerial vehicles (UAV) can readily assess the VIs traits at various crop growth stages. Thirty-two wheat cultivars and breeding lines grown in limited irrigation and full irrigation treatments were investigated to monitor NDVI across the growth cycle using a Sequoia sensor mounted on a UAV. Significant correlations ranging from R(2) = 0.38 to 0.90 were observed between NDVI detected from UAV and Greenseeker (GS) during stem elongation (SE) to late grain gilling (LGF) across the treatments. UAV-NDVI also had high heritabilities at SE (h(2) = 0.91), flowering (F)(h(2) = 0.95), EGF (h(2) = 0.79) and mid grain filling (MGF) (h(2) = 0.71) under the full irrigation treatment, and at booting (B) (h(2) = 0.89), EGF (h(2) = 0.75) in the limited irrigation treatment. UAV-NDVI explained significant variation in grain yield (GY) at EGF (R(2) = 0.86), MGF (R(2) = 0.83) and LGF (R(2) = 0.89) stages, and results were consistent with GS-NDVI. Higher correlations between UAV-NDVI and GY were observed under full irrigation at three different grain-filling stages (R(2) = 0.40, 0.49 and 0.45) than the limited irrigation treatment (R(2) = 0.08, 0.12 and 0.14) and GY was calculated to be 24.4% lower under limited irrigation conditions. Pearson correlations between UAV-NDVI and GY were also low ranging from r = 0.29 to 0.37 during grain-filling under limited irrigation but higher than GS-NDVI data. A similar pattern was observed for normalized difference red-edge (NDRE) and normalized green red difference index (NGRDI) when correlated with GY. Fresh biomass estimated at late flowering stage had significant correlations of r = 0.30 to 0.51 with UAV-NDVI at EGF. Some genotypes Nongda 211, Nongda 5181, Zhongmai 175 and Zhongmai 12 were identified as high yielding genotypes using NDVI during grain-filling. In conclusion, a multispectral sensor mounted on a UAV is a reliable high-throughput platform for NDVI measurement to predict biomass and GY and grain-filling stage seems the best period for selection.
[本文引用: 1]
DOI:10.3390/rs6109653URL [本文引用: 1]
DOI:10.1080/07038992.2017.1317206URL [本文引用: 1]
[本文引用: 1]
DOI:10.1016/j.rse.2007.07.019URL [本文引用: 1]
DOI:10.1016/S2095-3119(15)61319-3URL [本文引用: 1]
DOI:10.1016/j.rse.2013.10.027URL [本文引用: 1]
Four timely and broadly available remotely sensed datasets were assessed for inclusion into county-level corn and soybean yield forecasting efforts focused on the Corn Belt region of the central United States (US). Those datasets were the (1) Normalized Difference Vegetation Index (NDVI) as derived from the Terra satellite's Moderate Resolution Imaging Spectroradiometer (MODIS), (2) daytime and (3) nighttime land surface temperature (LST) as derived from Aqua satellite's MODIS, and (4) precipitation from the National Weather Service (NWS) Nexrad-based gridded data product. The originating MODIS data utilized were the globally produced 8-day, clear sky composited science products (MOD09Q1 and MYD11A2), while the US-wide NWS data were manipulated to mesh with the MODIS imagery both spatially and temporally by regridding and summing the otherwise daily measurements. The crop growing seasons of 2006-2011 were analyzed with each year bounded by 32 8-day periods from mid-February through late October. Land cover classifications known as the Cropland Data Layer as produced annually by the National Agricultural Statistics Service (NASS) were used to isolate the input dataset pixels as to corn and soybeans for each of the corresponding years. The relevant pixels were then averaged by crop and time period to produce a county-level estimate of NDVI, the LSTs, and precipitation. They in turn were related to official annual NASS county level yield statistics. For the Corn Belt region as a whole, both corn and soybean yields were found to be positively correlated with NDVI in the middle of the summer and negatively correlated to daytime LST at that same time. Nighttime LST and precipitation showed no correlations to yield, regardless of the time prior or during the growing season. There was also slight suggestion of low NDVI and high daytime LST in the spring being positively related to final yields, again for both crops. Taking only NDVI and daytime LST as inputs from the 2006-2011 dataset, regression tree-based models were built and county-level, within-sample coefficients of determination (R-2) of 0.93 were found for both crops. Limiting the models by systematically removing late season data showed the model performance to remain strong even at mid-season and still viable even earlier. Finally, the derived models were used to predict out-of-sample for the 2012 season, which ended up having an anomalous drought Yet, the county-level results compared reasonably well against official statistics with R-2 = 0.77 for corn and 0.71 for soybeans. The root-mean-square errors were 1.26 and 0.42 metric tons per hectare, respectively. (C) 2013 Elsevier Inc.
DOI:10.1016/j.agrformet.2015.02.001URL [本文引用: 1]
DOI:10.1016/j.mcm.2012.12.028URL [本文引用: 1]
DOI:10.1016/S2095-3119(15)61304-1URL [本文引用: 1]
DOI:10.1016/j.rse.2015.06.001URL [本文引用: 1]
