 ,, 汤亮, 刘蕾蕾, 刘兵, 张小虎, 邱小雷, 田永超, 曹卫星,南京农业大学/国家信息农业工程技术中心/智慧农业教育部工程研究中心/农业农村部农作物系统分析与决策重点实验室/江苏省信息农业重点实验室/江苏现代作物生产协同创新中心,南京 210095
Research Progress on the Crop Growth Model CropGrow
ZHU Yan,, TANG Liang, LIU LeiLei, LIU Bing, ZHANG XiaoHu, QIU XiaoLei, TIAN YongChao, CAO WeiXing,Nanjing Agricultural University/National Engineering and Technology Center for Information Agriculture/Engineering Research Center of Smart Agriculture, Ministry of Education/Key Laboratory of Crop System Analysis and Decision Making, Ministry of Agriculture and Rural Affairs/Jiangsu Key Laboratory for Information Agriculture/Jiangsu Collaborative Innovation Center for Modern Crop Production, Nanjing 210095通讯作者:
责任编辑: 杨鑫浩
收稿日期:2020-02-29接受日期:2020-06-10网络出版日期:2020-08-16
| 基金资助: |
Received:2020-02-29Accepted:2020-06-10Online:2020-08-16
作者简介 About authors
朱艳,E-mail:

摘要
关键词:
Abstract
Keywords:
PDF (10661KB)元数据多维度评价相关文章导出EndNote|Ris|Bibtex收藏本文
本文引用格式
朱艳, 汤亮, 刘蕾蕾, 刘兵, 张小虎, 邱小雷, 田永超, 曹卫星. 作物生长模型(CropGrow)研究进展[J]. 中国农业科学, 2020, 53(16): 3235-3256 doi:10.3864/j.issn.0578-1752.2020.16.004
ZHU Yan, TANG Liang, LIU LeiLei, LIU Bing, ZHANG XiaoHu, QIU XiaoLei, TIAN YongChao, CAO WeiXing.
信息技术与农业科学的快速发展与交叉融合,形成了农业信息技术,进一步催生了数字农业和智慧农业的快速发展,为现代农业提供了定量化技术支持和全方位信息服务,也为农业产业技术改造和提升注入了新的活力,带来显著的社会、经济和生态效益[1]。农业信息技术在世界农业领域的兴起始于20世纪70年代末,以作物生长模型(crop growth model)的成功研制和应用为突出代表[2]。作物生产系统是一个复杂而独特的动态系统,受气候条件、土壤特性、品种特征、技术措施等多因素的综合影响,具有显著的时空变异性。而作物生长模型以作物生长发育的内在规律为基础,综合作物遗传潜力、环境效应、调控技术之间的因果关系,能够定量描述和预测作物生长发育过程及其与环境和技术的动态关系[3,4]。因此,构建机理性强、适用性广的作物生长模型可为不同条件下的作物生产力预测与效应评估等提供有效的定量化工具。
20世纪50—60年代,DE WIT[5]及DUNCAN等[6]相继发表了植物冠层光能截获与群体光合作用模型,标志着作物生理生态过程模拟的问世。目前国外较为优秀的作物生长模型有美国的DSSAT[7]、澳大利亚的APSIM[8]、法国的STICS[9]、荷兰的GECROS[10]、菲律宾国际水稻所的ORYZA[11]等。我国作物模型的研究虽然起步较晚,但发展较快。早期研究在跟踪和借鉴国外研究成果的基础上,针对我国作物生产特点构建了相关模拟模型[12,13]。20世纪90年代得到快速发展,涌现了若干各具特点、自主研发的作物生长模型及决策系统[14,15,16]。2000年以来,南京农业大学、中国农业大学、西北农林科技大学、中国科学院、江苏省农科院等科研院校在作物模拟算法构建、模拟平台搭建、模型区域应用、情景效应评估等方面开展了较为系统的研究工作,并在国际作物模拟领域产生了积极影响[17,18,19,20,21]。
2010年以来,国际农业系统模拟专家组织启动了农业模型比较与改进项目协作组(Agricultural Model Intercomparison and Improvement Project,AgMIP),旨在通过比较与改进世界上现有的不同作物生长模型、家畜生长模型和农业经济模型,并耦合未来气候模型与情景模拟方法等,来量化评估站点、区域、国家及全球等不同尺度农业生产与食品安全(https:// agmip.org)。在作物生长模型领域,协作组按照水稻、小麦、玉米等不同作物分别组建了多个国际研究团队,协同开展作物生长模型的比较与改进研究,着力提升模型在不同条件下的模拟与应用能力[22]。然而,由于试验数据共享不畅、控制试验条件有限、区域模拟技术发展缓慢、模型研究人员匮乏等方面的综合原因,现有作物生长模型在极端气候效应模拟[23,24]、区域生产力预测[25,26]、管理方案设计[18,27]、环境效应评估[28,29]等方面还有待进一步改进和完善,迫切需要提出机理性与预测性兼备的综合性作物生长模型及决策支持系统。
近20多年来,南京农业大学以小麦和水稻等作物为主要对象,针对现有作物生长模型存在的问题以及国内外发展趋势,在作物生长过程模拟、极端气候效应量化、区域生产力预测分析、数字化设计与决策支持等方面开展了深入系统的研究,形成了具有中国特色、与国际接轨的作物生长模拟系统及应用技术体系。本文重点介绍笔者团队经过长期努力与探索,在作物生长模型方面形成的总体技术方法、最新研究进展及未来发展思考等。
1 总体研究思路
作物生长系统是由作物、土壤、大气等组成的有机系统,综合了作物遗传潜力、环境效应和技术调控之间的因果关系。作物系统模拟就是运用系统分析的原理和方法,对作物生长发育及生产力形成过程与环境、技术、品种之间的动态关系进行定量表达,并构建作物生长模拟算法。因此作物生长模型能够帮助人们理解和认识作物生长发育过程的基本规律和量化关系,并对作物生长系统的动态行为和产量品质进行定量预测,从而辅助作物生长和生产系统的优化管理和定量调控,实现高产、优质、高效、生态、安全的作物生产目标。理想的作物生长模型,不仅具有良好的机理性和预测性,而且以其较强的动态性和通用性适用于不同生态区域和用户层次。1.1 技术流程
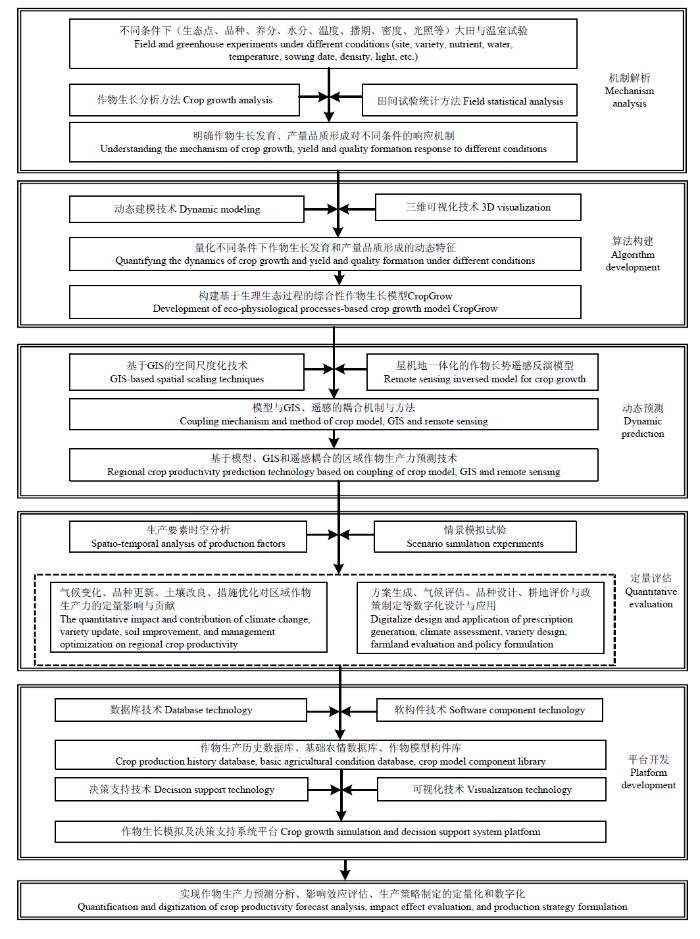
本研究基于系统学理论与方法,综合运用农业气象学、作物生理学、作物生态学、过程建模和软件工程等,以“生理机制解析-模拟算法构建-生产力动态预测-效应定量评估-应用平台研发”为主线,开展系统深入的研究,并集成构建了作物生长模拟与应用技术体系。首先,通过收集已发表的文献资料,结合团队开展的不同类型品种、播期、密度、水分、养分及温度试验等模拟支持研究,综合利用作物生长分析和生理生态分析方法,对作物生长发育的基本规律及其与环境因子和技术措施之间的关系给予解析和综合,明确作物生长发育、产量品质形成对不同环境和技术措施的响应机制;运用系统分析、动态建模及虚拟显示等方法,量化不同条件下作物生长发育和产量品质形成的动态特征,构建基于生理生态过程的综合性作物(水稻、小麦)生长模型CropGrow,包括阶段发育与物候期、器官发生与群体形成、光合作用与物质生产、物质分配与产量品质形成、养分动态、水分平衡、以及作物三维形态建成和虚拟显示等子模型,可数字化、可视化表征不同条件下作物生长发育与生产力形成过程;进一步探讨模拟模型的动态预测功能与地理信息系统(GIS)的空间信息管理功能、遥感(RS)技术的实时监测功能相耦合的机制与方法,构建基于模型、GIS和RS耦合的区域作物生产力预测技术;在定量分析作物生产要素时空分布特征的基础上,利用情景模拟技术,量化气候变化、品种更新、土壤改良、措施优化对区域作物生产力的影响,开展适宜方案生成、理想品种设计、气候效应评估、耕地利用评价以及农业政策制定等应用技术研究;最后,运用构件化程序设计思想,研制开发作物生长模型组件,并基于作物生产历史数据库、基础农情数据库、作物模型构件库等,结合决策支持和可视化技术,集成开发基于模型的数字化可视化作物生长模拟系统与决策支持平台。该平台具有生产力预测预警、管理方案动态生成、气候效应量化评估、作物品种优化设计、耕地利用决策评价、农业政策规划制定等综合功能(图1)。图1
 新窗口打开|下载原图ZIP|生成PPT
图1作物生长模型CropGrow的构建与应用技术流程
Fig. 1Technical flowchart of development and application of the crop growth model CropGrow
1.2 数据支撑
模型算法构建所需的数据资料大多来源于试验研究及历史资料。尽管已有的文献资料和数据积累可以提供许多作物生长发育的基本规律及其与环境和技术之间的相互关系,但不少算法的推导和构建还必须依赖于逻辑性的理论假说和试验性的研究分析。因此,需要有针对性地组织实施大量试验研究来服务于作物生长模拟算法的构建,称之为模拟的支持研究[3]。作物生长模拟的支持研究主要有两个方面:一是已知因果关系或基本模式,但缺乏特定的量化表达或算法程序;二是相对不了解而有待探索的某些过程,称为黑箱。笔者团队自1994年以来,在收集已有文献资料的基础上,通过持续实施不同品种、播期、密度、水分、养分等处理的多年多生态点大田试验以及不同处理水平和持续时间的温度、光照、水分等人工气候室试验等,探究了作物生长发育及产量品质形成的动态规律,明确并量化了作物生理过程对环境因子及管理措施响应的机理特征,从而构建了不同因子及其互作与作物生长发育、产量品质形成之间关系的模拟算法,重点在生育期预测[30,31,32,33]、形态与器官建成[32,33]、干物质分配[33,34,35]、籽粒蛋白质和淀粉形成[36,37,38,39]、极端温度效应量化[40,41,42,43,44,45]等过程模拟方面实现了突破。2 主要研究进展
2.1 作物生长模型CropGrow的构建
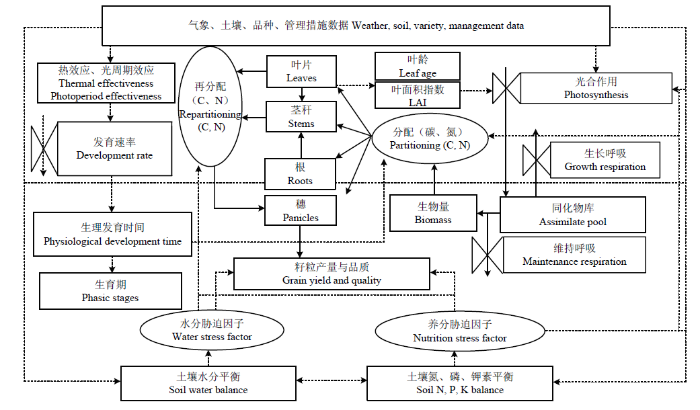
2.1.1 作物生长发育与生产力形成过程建模 作物生长模型CropGrow是以小麦和水稻等作物生长发育及生产力形成规律为基础,以气候条件、土壤特性、品种特征、管理技术等为主要驱动变量,而构建的基于生理生态过程的作物生长与生产力形成模拟模型,包括阶段发育与物候期、器官发生与建成、光合生产与物质积累、同化物分配与产量品质形成、养分动态和水分平衡等子模型(图2)[3, 33],可动态预测不同条件下作物生长发育与产量品质形成过程(图3)。其中,阶段发育与物候期子模型以茎顶端发育为主线,以作物温光发育过程为基础,通过动态模拟作物生理发育时间(physiological development time,PDT)来精确划分作物发育阶段[30,31]。器官发生与建成子模型主要模拟植株不同器官的发生和形成过程,包括根、茎、叶、穗等器官的发生与建成等,其中器官发生的时间与阶段发育过程密切相关,器官发生的数量和大小与同化物的分配和利用有关[32-33,46-48]。光合生产与物质积累子模型是基于一日内到达冠层的光合有效辐射,采用高斯积分法将冠层分层计算不同叶层反射与吸收的光合有效辐射,加权计算冠层瞬时同化速率,同时考虑了反射率随太阳高度角的日变化以及群体消光系数随PDT的时序变化,再按不同时间点加权求和得到每日冠层同化速率,并通过计算呼吸和物质转化消耗,得到每日同化物积累量,同时受到温度、水分、CO2浓度、生理年龄和氮素的影响[3, 33]。同化物分配与产量品质形成子模型中,碳、氮化合物的分配与再分配决定作物收获器官的产量和品质形成,通过器官间干物质分配来模拟籽粒产量[33,34],进一步结合植株氮转运与籽粒氮积累动态,建立了籽粒蛋白质含量与蛋白质产量的模拟模型[36,37],同时基于植株碳素的积累转运及籽粒碳素的转化利用,构建了基于花后碳流过程的籽粒淀粉形成模拟模型[38,39]。养分动态子模型主要涉及氮、磷、钾3种大量元素的模拟,其中氮素动态模拟包括土壤有机质矿化、硝化与反硝化作用、铵的吸附与解吸、氨的挥发、氮素淋洗及作物氮素吸收与分配等过程[49],植株从土壤吸收的氮素是通过建立植株及各个器官的临界氮浓度[50,51],来计算植株和各个器官的氮素需求量和转运量[52]。水分平衡子模型是根据土壤水分收支平衡原理,通过作物根系深度将土壤剖面分成若干层,并按土层进行土壤水分收支计算,包括径流、渗漏、土壤蒸发、作物截留、根系吸水、水分再分配等动态过程的模拟[53]。图2
 新窗口打开|下载原图ZIP|生成PPT
图2作物生长模型CropGrow的结构流程图
Fig. 2Structural flowchart of crop growth model CropGrow
图3
 新窗口打开|下载原图ZIP|生成PPT
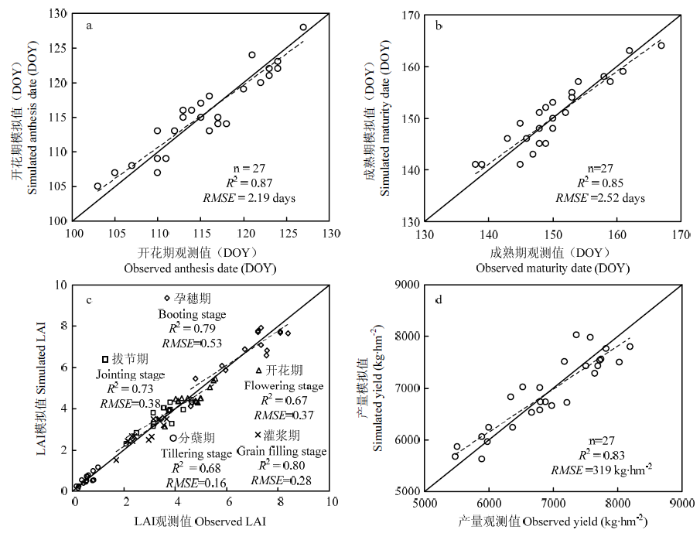
图3基于WheatGrow 的小麦生育期(a,b)、LAI(c)、籽粒产量(d)模拟值与实测值的1:1作图
DOY是一年中的天数
Fig. 3Comparisons between observed and simulated values of wheat phenology (a, b), LAI (c) and grain yield (d) with WheatGrow
DOY is day of year
此外,在评估已有模型对极端温度响应的不确定性基础上[54,55,56],基于作物生长发育对极端气候环境的响应机制[41,42,43],结合高、低温累积度日及半致死温度等参数,量化了极端温度对作物生长发育的影响,进而构建了高温和低温胁迫对稻麦生育进程、光合作用、物质积累与分配、结实率等过程影响的模拟算法[40,42, 44-45],提高了CropGrow模型在极端温度环境下对作物生长发育及生产力形成的预测精度。
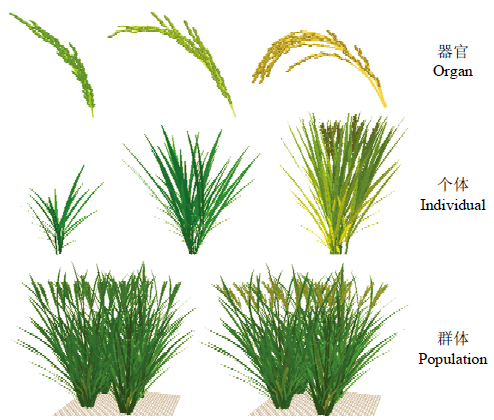
2.1.2 作物三维形态建成和虚拟显示子模型的构建 CropGrow模型除了对上述作物生产力形成过程进行模拟外,还通过定量分析不同条件下作物器官几何形态与空间伸长规律、器官颜色动态特征、器官拓扑结构及其在植株个体上的空间配置、个体间相互作用及其与群体建成的关系等,构建了作物器官-个体-群体的三维形态建成子模型,并研发了基于模型的作物生长虚拟仿真平台。首先,以生长度日(GDD)为尺度,结合生长模型模拟输出的器官总干重及分配模式获得单个器官的干物质量,结合各器官的形态建成模式与特征参数,构建了作物根[57,58]、茎[59,60]、叶[61,62,63,64]、穗[65,66]等器官的三维形态建成模拟模型,包括器官几何形态、空间生长曲线、颜色变化特征等子模型;综合利用不同器官三维形态可视化方法和计算机图形学的真实感绘制技术(如纹理、颜色、光照处理等),生成形象逼真的器官图形,同时结合器官拓扑结构及其在植株个体上的空间配置规律等,构建了作物器官和个体三维可视化技术[57-58,65,67];进一步从优化计算速度、降低内存消耗、增强真实感等角度出发,提出了细节层次模型、视域裁剪技术等兼顾速度和多样性的方法,并结合植株间的碰撞检测与响应技术等[68],实现了作物群体生长的可视化[69];最后集成研发了作物生长虚拟仿真平台[69,70],实现了不同条件下作物器官-个体-群体生长动态的三维可视化表达,为基于模型的作物株型优化设计提供了数字化支撑(图4)。
图4
 新窗口打开|下载原图ZIP|生成PPT
图4基于RiceGrow的水稻器官-个体-群体三维形态建成及可视化表达
Fig. 4Three-dimensional morphological construction and visualization of rice organ, individual and population based on RiceGrow
2.2 作物生长模型CropGrow的应用
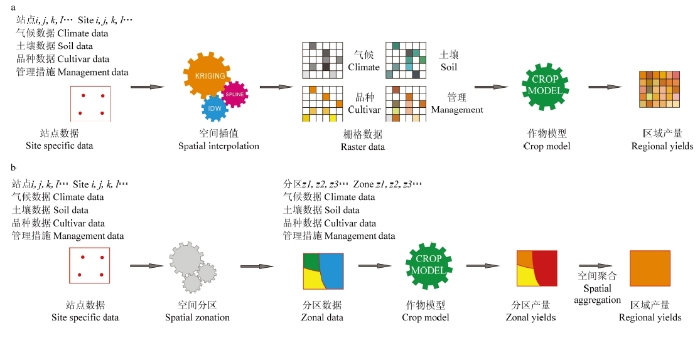
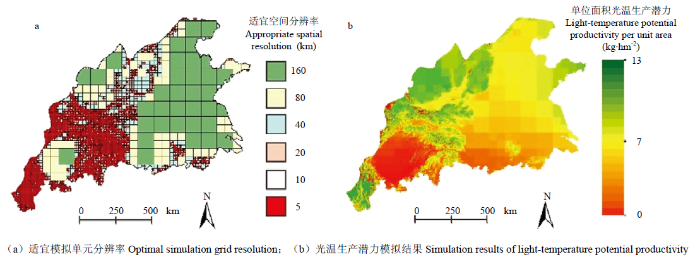
2.2.1 模型升尺度与区域预测 作物生长模型是基于特定区域内作物生长环境变量一致的假设条件而构建的,属于单点水平的模拟系统。而实际研究区的环境与管理变量(气候、土壤、品种、技术等)普遍存在空间差异[71,72,73,74,75],因此需要结合GIS技术将作物生产力预测模型从单点模拟拓展到区域应用。为此,我们研究提出了基于模型与GIS耦合实现区域生产力预测的2种策略,即基于空间插值的升尺度策略和基于空间分区的升尺度策略。其中,空间插值作为一种重要的“由点到面”数据生成的空间分析方法,常用于观测点数据到区域数据的升尺度转换,可获取作物生长模型运行所需要的输入参数的区域化栅格数据,并逐栅格运行模型获得整个区域的模拟结果(图5-a)[25, 76-78]。空间分区则是根据研究区环境和管理变量的空间差异将区域划分为多个假定的均质模拟单元,通过每个模拟单元内典型生态点模拟结果“以点代面”,获取整个区域模拟结果(图5-b)[79,80,81]。由于特定区域空间异质性的多样化,空间插值和空间分区普遍存在不确定性,直接影响了区域生产力模拟的效果。因此,模型应用中通过比较不同方法对区域模拟结果的影响,选择适宜的升尺度策略,从而提高区域模拟的准确性。例如,通过研究空间插值过程中不同空间分辨率对模拟精度的影响,可确定我国冬麦区适宜的插值分辨率,从而同步提高区域模拟的精度和效率(图6)[25]。图5
 新窗口打开|下载原图ZIP|生成PPT
图5基于模型与GIS耦合的模拟尺度优化策略
(a)基于空间插值的升尺度;(b)基于空间分区的升尺度
Fig. 5Optimization strategy of simulation scale based on model and GIS coupling
(a)Upscaling based on spatial interpolation;(b)Upscaling based on spatial division
图6
 新窗口打开|下载原图ZIP|生成PPT
图6基于空间差值方法的中国冬麦区生产力模拟
(a)适宜模拟单元分辨率;(b)光温生产潜力模拟结果
Fig. 6Simulated productivity of winter wheat regions of China based on spatial interpolation
(a)Optimal simulation grid resolution;(b)Simulation results of light-temperature potential productivity
2.2.2 模型与遥感耦合 遥感可在田块到区域等不同空间尺度,利用多种传感器快速实时准确获取作物、土壤等状态信息,具有突出的时效性和空间性,而作物生长模型是对作物生长过程及其与环境、技术、品种之间的动态关系进行定量表达,具有较强的机理性和时序预测性。因此,遥感信息与作物模型相结合,可实现遥感实时监测功能与模型时序预测功能的互补,提升对区域作物生长和产量品质形成的预测精度,是实现区域化作物生长和生产力精确预测的有效路径。遥感信息与作物模型的耦合主要涉及3种策略,包括直接以遥感观测值替换模型模拟值(中间变量更新策略),通过调整模型初始输入参数值使得模型模拟值逼近遥感观测值(初始参数反演策略),以及以某时刻遥感观测值来优化同时刻模型模拟值并改变优化时刻之后的模型模拟状态变量(生长过程同化策略)[82]。
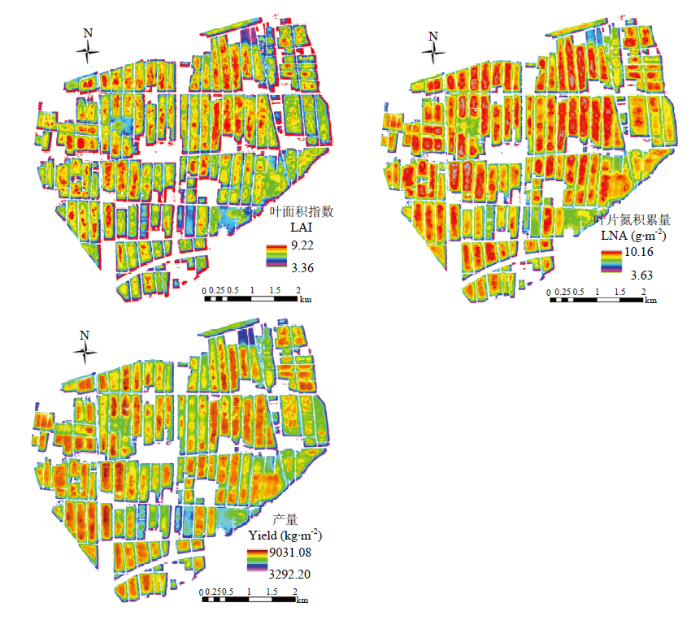
遥感与模型耦合过程中,常用的耦合参数既有作物生长或生理指标,如叶面积指数、叶片氮含量等,也可以直接耦合遥感参数如光谱反射率、植被指数等[83,84,85,86]。例如,我们利用一种新的粒子群优化算法,将遥感数据与水稻生长模型(RiceGrow)相结合,基于初始参数反演策略,通过光谱遥感和卫星图像获取水稻叶面积指数和叶片氮积累量作为耦合参数,进行播种期、播种量和施氮量等初始参数的优化,进而实现区域水稻产量的可靠预测[84]。另外,我们将遥感与小麦生长模型(WheatGrow)相耦合,基于生长过程同化策略,同时加入PROSAIL辐射传输模型,以不同生育时期的小麦植被指数为信息耦合参数,通过同化遥感反演的时序性植被指数与WheatGrow- PROSAIL模型模拟的时序性植被指数,获得了最优的叶面积指数序列,并以此驱动WheatGrow模型,从而准确预测了冬小麦生长指标和籽粒产量(图7—8)[85]。同时,利用不同年份不同生态点的试验数据对遥感与WheatGrow耦合的最佳植被指数及最佳生育时期进行了探讨,发现小麦拔节至孕穗期选用土壤调节植被指数、孕穗后选用增强型植被指数作为耦合参数时生长模型的预测效果最好。如用一个生育时期的遥感数据进行耦合,孕穗—抽穗期是耦合的最佳窗口;如有多个生育期遥感数据,则基于拔节到灌浆期的时序遥感数据预测精度最高[86]。
图7
 新窗口打开|下载原图ZIP|生成PPT
图7模型与遥感耦合后预测的小麦叶面积指数(LAI)、叶片氮积累量(LNA)和叶片干物重(LDW)和实测值的对比
Fig. 7Comparisons between observed and simulated values of LAI, leaf nitrogen accumulation (LNA) and leaf dry matter weight (LDW) by assimilating WheatGrow model with remote sensing information
图8
 新窗口打开|下载原图ZIP|生成PPT
图8遥感信息与WheatGrow模型耦合后预测的沿湖农场小麦叶面积指数(LAI)、叶片氮积累量(LNA)和籽粒产量(Yield)
Fig. 8Simulated LAI, leaf nitrogen accumulation (LNA) and grain yield of wheat in Yanhu farm by assimilating WheatGrow model with remote sensing information
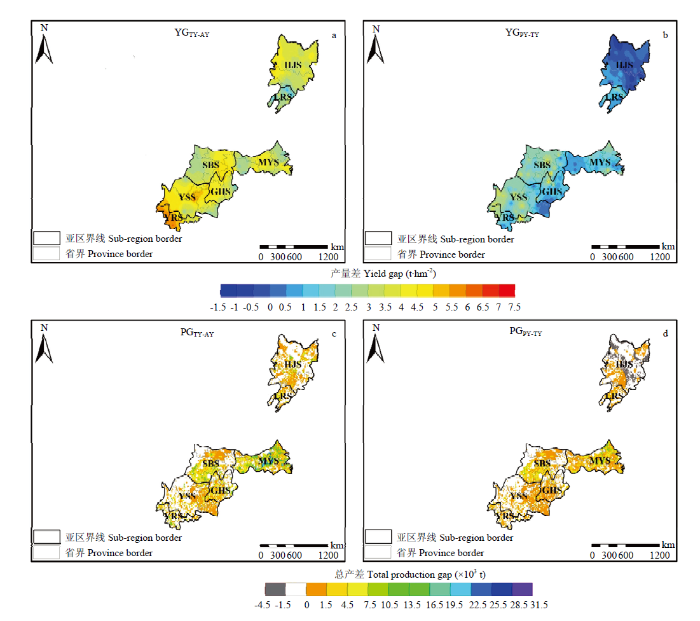
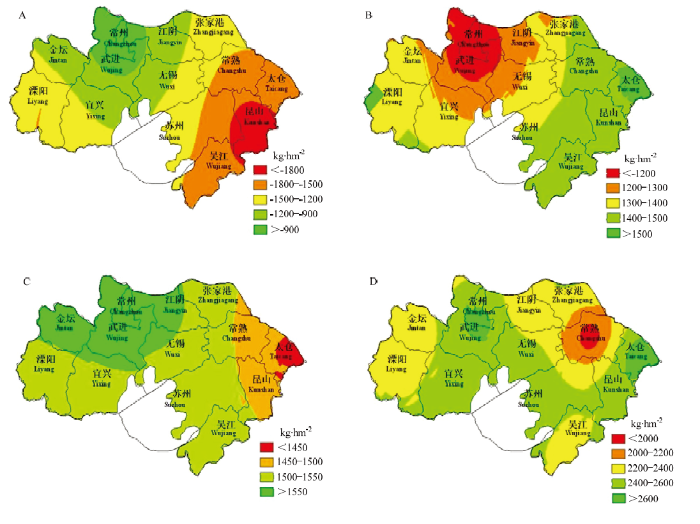
2.2.3 生产力预测与因子贡献率评价 粮食安全生产始终是关系国民经济发展、社会稳定和国家自立的全局性重大战略问题。粮食总产的提高主要依靠扩大种植面积或提高单产,在目前种植面积难以扩增的背景下,提高单产已成为增加作物总产和确保粮食安全的可行途径。因此,迫切需要明确不同区域的作物层次生产力及产量差,并进一步解析产量制约因子,提出作物生产力提升的技术途径。例如,我们利用WheatGrow模型和美国的CERES-Wheat模型,对我国冬小麦主产区的产量潜力、产量差和水分利用状况进行了评价[78]。综合利用RiceGrow、ORYZA v3和CERES-Rice 3套水稻生长模型集合,估算了中国水稻主产区294个站点在1981—2010年的潜在产量,并结合区域高产创建目标及实际产量,量化了不同层次产量差。结果表明,不同层次产量差的空间分布呈现明显的区域差异,但中国水稻生产力仍具有较大的提升空间,其中西南单季稻区增产潜力最大,长江中下游单季稻区次之,东北单季稻区和南方双季稻区的提升空间相对较低(图9—a、b);在此基础上,结合水稻种植面积的栅格数据,估算了不同层次总产差及其空间分布特征(图9—c、d)[87]。进一步结合我国水稻播种面积、产量、人口、人均稻米消费量、种子、饲料等数据及其随时间的变化特征,构建了基于经济学模型的全国稻谷需求模型,并基于市场均衡理论,提出了我国水稻的供需平衡模型,实现了基于模型的粮食生产力预测预警[88]。同时,利用情景模拟方法,定量评估了气候变化、土壤改良、品种更新和措施优化等不同要素对作物生产力形成的贡献,发现我国太湖地区1980年到2010年间气候变化、土壤改良、品种更新和措施优化等对水稻生产力提升的贡献率分别为-19.5%、12.7%、21.7%和34.6%(图10)[89]。
图9
 新窗口打开|下载原图ZIP|生成PPT
图9中国水稻主产区不同层次单产和总产产量差的空间分布特征
(a)YGTY-AY,目标产量-实际产量;(b)YGPY-TY,潜在产量-目标产量;(c)PG TY-AY,YGTY-AY×种植面积;(d)PGPY-TY,YGPY-TY×种植面积
Fig. 9Spatial distribution of yield gap and production gap at different levels in main rice production regions of China
(a)Target yield-actual yield;(b)Potential yield - target yield;(c)YGTY-AY×planting area;(d)YGPY-TY×planting area
图10
 新窗口打开|下载原图ZIP|生成PPT
图101980-2010年太湖区域不同要素对水稻产量提升的贡献率
A:气候变化;B:土壤改良;C:品种更新;D:措施优化
Fig. 10Contribution of different factors to rice yield increase in Taihu lake region from 1980 to 2010
A: Climate change; B: Soil improvement; C: Variety renewal; D: Measurement optimization
2.2.4 数字化设计与决策支持 随着CropGrow模型各个模块的构建与完善,模型的数字化设计与决策支持功能也得到不断拓展,主要涉及适宜管理方案生成、理想品种选择与设计、气候效应定量评估、耕地利用决策评价与农业规划政策制定等。在适宜管理方案生成方面,通过不同播期、密度、氮肥、灌溉等单一或组合方案的多年情景模拟试验,可以确定不同概率下的最适管理方案。例如,基于RiceGrow模型,通过情景模拟试验,为我国水稻主产区不同区域设计了现在和未来气候条件下的最适宜播期(图11)[90]。在理想品种选择与设计方面,通过评价不同品种遗传参数组合下生育期、株型、光合作用及产量等方面的表现,可以生成理想的品种遗传参数组合,为作物生产中优良品种的选择与选育提供了有效支撑。例如,通过改变小麦品种的消光系数,评估了紧凑型和披散型小麦品种的光能利用效率,为设计高光能利用率的理想株型品种奠定了基础(图12)[91]。
图11
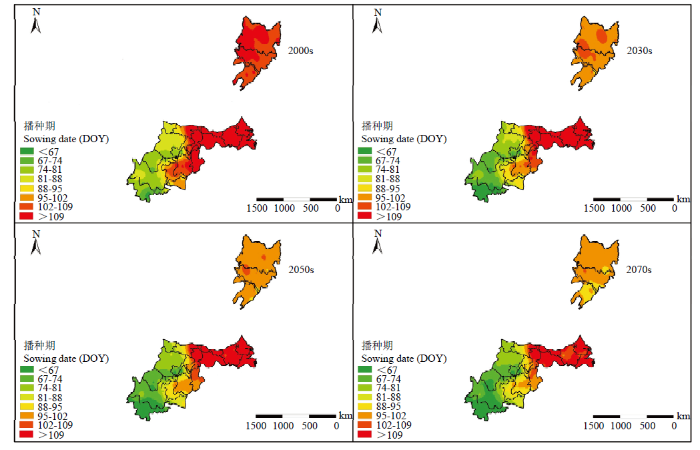 新窗口打开|下载原图ZIP|生成PPT
图11我国水稻主产区不同气候情景下的适宜播期空间分布特征
Fig. 11Spatial distribution of suitable sowing dates under different climate scenarios in main rice production regions of China
图12
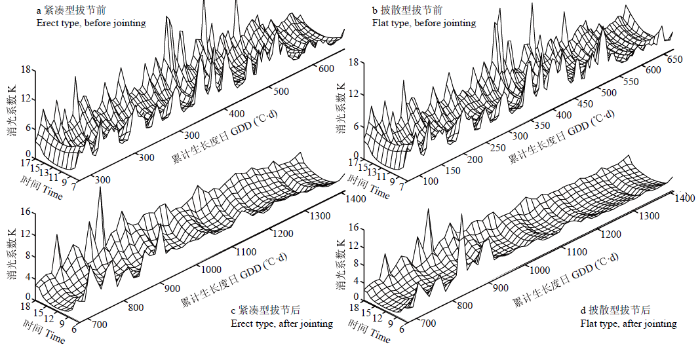 新窗口打开|下载原图ZIP|生成PPT
图12小麦紧凑型和披散型株型消光系数的动态变化
Fig. 12The dynamic variation of extinction coefficient of erect and flat types of wheat cultivar
基于多年的历史和未来气象数据,利用作物模型可以开展不同空间尺度的气候变化效应评估[28, 77-79, 89]。例如,利用WheatGrow模型结合全球气候模型(GCM),采用栅格模拟方式,评价了我国冬小麦主产区未来不同年代(2030s、2050s、2070s)小麦生产力和水分利用效率的变化[78]。结合IPCC最新气候变化预估结果,综合利用RiceGrow、ORYZA v3和CERES -Rice 3套水稻模型,评估了全球增温1.5℃和2.0℃情景下我国水稻主产区的生产力,发现增温在一定程度上可以缓解高纬度地区(东北单季稻区)低温胁迫对水稻生长发育的影响,具有一定的增产效应,然而对于其他地区则呈减产趋势;CO2的肥效不能完全抵消气候变暖对水稻生产带来的负面影响[92]。此外,在国际农业模型比较和改进项目(AgMIP)框架下,将WheatGrow模型与全球其他多套小麦生长模型一起形成多模型集合,模拟了不同气候变化情景下典型站点、国家和全球尺度小麦产量的变化趋势[56,81](图13)。在耕地利用决策评价和农业规划政策制定上,生长模型首先预测单产,进一步结合耕地利用情景,即可估算出区域耕地生产力;同时结合资源投入与耕地利用情况,可以评价作物种植区域的适宜性,可为制定农业耕地利用政策等提供支持。
图13
 新窗口打开|下载原图ZIP|生成PPT
图13全球增温1.5℃(a)和2.0℃(b)情景下基于多模型集合预估的全球60个典型生态站点小麦产量的变化
Fig. 13Impacts of (a) 1.5℃ and (b) 2.0℃ warming scenarios on wheat grain yield for 60 representative global wheat-growing locations from 31 crop models
2.2.5 生长模拟与决策支持平台 在作物生长模型构建的基础上,利用计算机软构件技术封装发育进程、光合同化、物质分配、器官建成、产品形成、养分动态、水分平衡等模块算法,进一步与GIS、RS等技术耦合,拓展数据管理、参数生成、策略评价等功能,研制开发了作物生长模拟软件系统[70,76,93-94],并集成开发了作物生长模拟与决策支持平台,实现了数据管理、参数优化、生长模拟、遥感耦合、区域预测、方案设计、效应评估、安全预警、产品发布等综合功能(图14—15),具有多功能、空间化、数字化、可视化等特点。其中数据管理实现了气象因子、土壤特性、品种参数、管理措施、病虫草害、生产成本、生育进程和产量水平等基础数据的查询与维护,以及相关数据的时空特征分析功能。参数优化实现了品种参数调试、气象数据生成、土壤参数估算以及各农作区常规栽培管理措施配置等。生长模拟包括单点模拟、空间模拟、时序模拟、虚拟显示和模拟验证,其中单点模拟可基于单个生态点定量模拟不同生产条件下的作物生育进程和生产力形成过程(图15-b),还能基于单点切入模拟,利用特定时期获得的作物实际生长指标(叶面积指数、生物量、叶龄等),修订实时模拟值,改进后期的模型预测结果(图15-c);空间模拟和时序模拟可以在不同空间尺度和长时间序列上模拟作物生长,并预测作物生产力的时空变化动态;虚拟显示是通过耦合作物三维形态模型及可视化技术,实现不同生长条件下作物生长动态的三维可视化(图15-d);模拟验证是基于田间实测数据验证模型预测结果的准确性。遥感耦合可以通过初始参数反演、中间变量更新和生长过程同化等3类耦合机制,提升对区域尺度作物生长和生产力的预测精度。方案设计和效应评估通过有针对性的情景模拟试验与分析,辅助用户进行管理决策和效应评价。安全预警是通过定量评估环境要素变化对作物生产的影响,结合粮食需求供给模型,实现粮食安全预测预警与应对策略制定。产品发布功能无缝对接CropGrow的WEB版服务平台(www.cropgrow.net),实现生长模拟、管理方案、生产潜力、气候效应、要素贡献、农业政策等应用报告的生成及实时在线发布。
图14
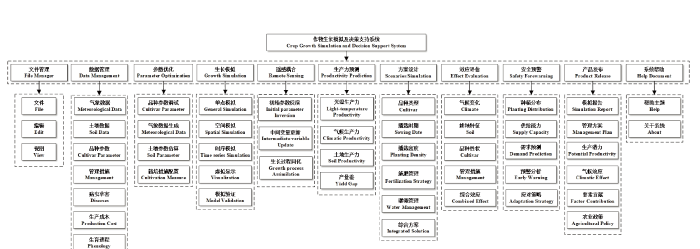 新窗口打开|下载原图ZIP|生成PPT
图14作物生长模拟及决策支持系统功能结构图
Fig. 14Function diagram of crop growth simulation and decision support support system
图15
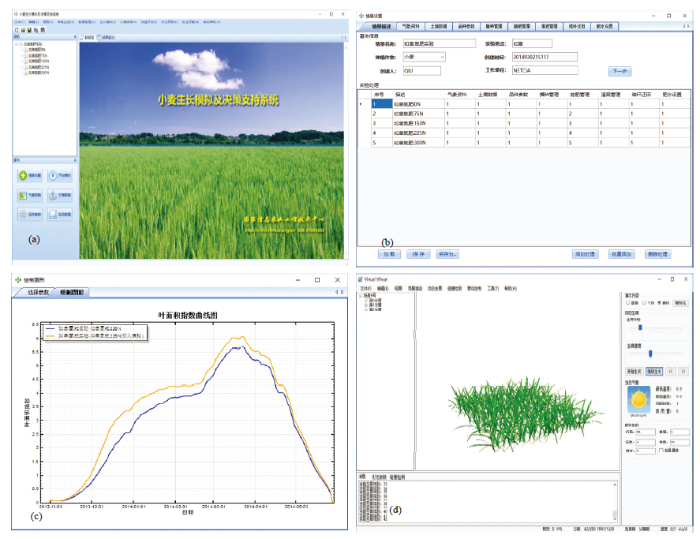 新窗口打开|下载原图ZIP|生成PPT
图15作物生长模拟与决策支持系统界面
Fig. 15Interfaces of crop growth simulation and decision support system
3 未来发展方向
3.1 完善农情基础数据
数字作物的核心在模型,关键在数据[95]。在国家大数据战略的支持下,未来需进一步扩充完善数字农业基础设施条件,结合国家重大科技基础设施建设、全国性农业普查和土壤普查,发挥“星-机-地-网”新型传感数据获取与传统试验数据调查的协同作用,获取气候条件、土壤特性、作物参数、管理措施等农业大数据,并利用大数据管理、空间数据管理等技术手段,推进农业数据资源的整合。同时,以政府和科研机构为主导搭建农业信息共享云服务平台,突破数据建设部门的信息孤岛,促进数据生产的协同与应用服务共享,从而为作物模型算法优化、区域生产力模拟及多尺度应用等提供可靠的基础数据支撑。3.2 提升模型预测能力
CropGrow模型以生理发育时间为尺度,以天为步长预测作物的生长发育进程,可以模拟光温潜在、水分限制和养分限制等不同生产水平下的作物生长发育状况[33, 94]。然而,影响作物生长发育的主要因子存在时空变异,因此需要深化作物生长模型与GIS、RS技术的耦合机制与方法,更好地实现区域粮食生产力的准确预测。同时,随着全球变暖,极端气候事件(如高低温、干旱、寡照等)的发生强度和频率不断增强[45, 73-74, 96],探讨极端气候条件对作物生长发育与产量品质形成的生理机制,提高模型在极端气候环境下的模拟精度,是作物模型未来关注的重点之一。此外,随着劳动力日益紧张和农业机械化水平的提高,现代作物栽培管理模式也已经由传统的人工栽培转变为轻简化、机械化栽培,因而需要准确模拟不同生产管理模式下的作物生产力形成过程,以更好地适应现代农业的发展形势。3.3 量化遗传基因效应
现代基因测序技术的飞速发展使得作物基因信息的快速获取变成现实,进而为量化作物生长模型中品种遗传参数与基因效应之间的关系奠定了良好基础,有望克服传统作物生长模型中品种遗传参数的机理性不足这一难题[97,98]。今后将系统量化作物重要功能基因对主要表型性状与产量品质形成的调控效应,研究创建基于功能基因生理效应和遗传规律的作物遗传参数估算新方法,进一步探索主要性状基因效应与环境效应之间的互作机制与定量方法,揭示不同基因型品种对生态环境及管理措施的响应机制,有效提升作物生长模型对作物表型特征的预测潜能。通过构建以“基因效应-遗传参数-表型特征-生产力形成”为主线的一体化模拟模型,可以为作物表型特征高效预测与育种性状的快速选择等奠定数字化技术基础。例如,当前水稻分子设计育种研究已取得显著进展,通过耦合基因效应模型与作物三维可视化模型有望为水稻理想株型的分子育种设计提供技术支持。3.4 拓展智能预测决策
作物生长模型的不断完善可进一步拓展决策支持功能。近年来,人工智能技术在农业领域得到快速发展与应用[99],如能将作物生长模型的动态预测功能与人工智能决策的相关算法相结合,构建农业生产智慧管理决策系统,则可提高管理决策的智能化程度。例如,利用作物生长模型进行不同条件下的生育期与产量模拟,为基于卫星遥感影像和人工智能算法的产量预测提供训练数据,可提升区域作物生产力的预测与决策能力[100]。模型参数估算方法也将逐步从手工试错法[33, 89]转向基于遗传算法、粒子群算法及蒙特卡罗等人工智能算法的自动估算法[55,77,101],进而实现不同应用场景下作物生长模型参数的快速自动估算。另外,作物生长模型结合作物表型监测技术,可应用于高通量作物表型指标的动态模拟预测,为作物表型快速鉴定、作物株型优化设计等提供智能化工具。3.5 耦合多种功能模型
全球气候变暖对未来世界粮食安全和农业可持续发展带来极大威胁,探讨作物生长模型与气候预测模型的耦合机制与方法,以更好地评估气候要素对粮食生产力的影响并制定相应的应对措施,成为当前的研究热点 [23-24,56]。同时,为了减少模型参数与模型结构对模拟结果带来的不确定性,将开发集多种生长模型于一体的作物模拟支持系统,采用多模型模拟结果的中值或均值[102],以减少单一模型模拟结果的不确定性。作物生长模拟系统还将耦合农业经济模型和农田生态模型,既可实现粮食供需平衡的预测预警,还能优化农业资源的高效利用。此外,通过耦合作物生长虚拟技术,模拟系统也将从传统桌面软件向三维仿真平台拓展,用户可以直接置身于农田虚拟场景中,通过改变环境因子及管理措施等输入条件开展情景模拟试验,实时感知田间作物虚拟生长场景,为用户带来直观性和沉浸式的模拟体验。参考文献 原文顺序
文献年度倒序
文中引用次数倒序
被引期刊影响因子
[本文引用: 1]
[本文引用: 1]
DOI:10.1016/0308-521X(96)00011-XURL [本文引用: 1]
[本文引用: 4]
[本文引用: 4]
[本文引用: 1]
[本文引用: 1]
[本文引用: 1]
[本文引用: 1]
[本文引用: 1]
[本文引用: 1]
[本文引用: 1]
[本文引用: 1]
[本文引用: 1]
[本文引用: 1]
[本文引用: 1]
[本文引用: 1]
[本文引用: 1]
[本文引用: 1]
[本文引用: 1]
[本文引用: 1]
[本文引用: 1]
[本文引用: 1]
[本文引用: 1]
[本文引用: 2]
[本文引用: 1]
[本文引用: 1]
[本文引用: 1]
[本文引用: 1]
[本文引用: 1]
[本文引用: 2]
DOI:10.1371/journal.pone.0178339URLPMID:28552938 [本文引用: 2]

Inter-annual crop yield variation is driven in large parts by climate variability, wherein the climate components of temperature and precipitation often play the biggest role. Nonlinear effects of temperature on yield as well as interactions among the climate variables have to be considered. Links between climate and crop yield variability have been previously studied, both globally and at regional scales, but typically with additive models with no interactions, or when interactions were included, with implications not fully explained. In this study yearly country level yields of maize, rice, soybeans, and wheat of the top producing countries were combined with growing season temperature and SPEI (standardized precipitation evapotranspiration index) to determine interaction and intensification effects of climate variability on crop yield variability during 1961-2014. For maize, soybeans, and wheat, heat and dryness significantly reduced yields globally, while global effects for rice were not significant. But because of interactions, heat was more damaging in dry than in normal conditions for maize and wheat, and temperature effects were not significant in wet conditions for maize, soybeans, and wheat. Country yield responses to climate variability naturally differed between the top producing countries, but an accurate description of interaction effects at the country scale required sub-national data (shown only for the USA). Climate intensification, that is consecutive dry or warm years, reduced yields additionally in some cases, however, this might be linked to spillover effects of multiple growing seasons. Consequently, the effect of temperature on yields might be underestimated in dry conditions: While there were no significant global effects of temperature for maize and soybeans yields for average SPEI, the combined effects of high temperatures and drought significantly decreased yields of maize, soybeans, and wheat by 11.6, 12.4, and 9.2%, respectively.
[本文引用: 3]
DOI:10.1016/j.agrformet.2014.09.026URL [本文引用: 1]
DOI:10.1016/j.eja.2013.09.020URL [本文引用: 1]
DOI:10.1016/j.agee.2012.11.009URL [本文引用: 2]
URLPMID:27323866 [本文引用: 1]
DOI:10.1017/S0021859697004668URL [本文引用: 2]
DOI:10.2134/agronj1991.00021962008300010042xURL [本文引用: 2]
URL [本文引用: 3]
本文系统地模拟了小麦植株茎顶端不同类型原基的发育过程,建立了叶原基分化、小穗原基分化和小花原基分化、退化、败育、受精结实及籽粒生长的子模型。模型引入每小穗分化的最大小花原基数、退化的最大小花原基数和籽粒潜在重量3个遗传参数,分别反映了不同小麦品种小花分化、退化和籽粒生长等方面的遗传差异。利用南京地区
URL [本文引用: 3]
本文系统地模拟了小麦植株茎顶端不同类型原基的发育过程,建立了叶原基分化、小穗原基分化和小花原基分化、退化、败育、受精结实及籽粒生长的子模型。模型引入每小穗分化的最大小花原基数、退化的最大小花原基数和籽粒潜在重量3个遗传参数,分别反映了不同小麦品种小花分化、退化和籽粒生长等方面的遗传差异。利用南京地区
DOI:10.1016/j.njas.2009.12.003URL [本文引用: 9]
DOI:10.1626/pps.5.248URL [本文引用: 2]
[本文引用: 1]
[本文引用: 1]
DOI:10.1016/j.fcr.2005.11.006URL [本文引用: 2]
DOI:10.3864/j.issn.0578-1752.2011.10.004URL [本文引用: 2]
【Objective】Grain protein content is an important quality index in rice. The objective of this study was to develop a process based simulation model for predicting the content and accumulation of grain protein under different cultural conditions. 【Method】On the basis of the field experiments involving different eco-sites, cultivar types and nitrogen rates, the fundamental relationships between grain protein accumulation and environmental and genetic factors were quantified by modeling the processes of nitrogen assimilation and partitioning within plant. 【Result】The model proposed that the rate of individual grain nitrogen accumulation was determined by the nitrogen availability restricted by source and nitrogen accumulation rate restricted by sink. Nitrogen availability of individual grain restricted by source was the sum of nitrogen uptake and remobilization from the vegetative organs post-anthesis, whereas nitrogen accumulation rate restricted by sink was dependent on potential nitrogen accumulation rate and interactive effects of temperature, water and nitrogen factors. Post-anthesis nitrogen uptake exhibited a logarithmic relationship to increasing grain weight. Nitrogen remobilization from the vegetative organs was provided from nitrogen accumulated in both leaves and stems. Relative nitrogen contents in leaves and stems pre-anthesis linearly increased with the accumulative growing degree-days after sowing, while those post-anthesis linearly decreased with the growing degree-days. The model was tested using the independent data sets of different years, eco-sites, cultivars, nitrogen rates, and it exhibited a good fit between the simulated and observed values, with the R2 of 0.968, 0.980, 0.974, 0.970 and 0.976, and RMSE of 16.55%, 13.24%, 9.53%, 10.93% and 9.29% for nitrogen uptake amounts of leaf and stem before anthesis, grain nitrogen uptake amount after anthesis, and nitrogen translocation amount of leaf and stem after anthesis, respectively, with the RMSE of 7.82% and R2 of 0.930 for grain protein content, respectively.【Conclusion】The simulation model based on nitrogen assimilation and translocation in rice could give a reliable prediction of plant nitrogen uptake and translocation amounts, and grain protein content and accumulation under different cultural conditions, which would provide a quantitative tool for grain quality prediction.
DOI:10.1016/j.fcr.2006.12.005URL [本文引用: 2]
DOI:10.3724/SP.J.1258.2011.00431URL [本文引用: 2]
Aims Our objective was to develop a simulation model of grain starch formation in rice plants by analyzing the dynamic patterns of carbon assimilation and translocation under varied environmental factors and genetic types. Methods We used field experiments involving different eco-sites, growing seasons, cultivar types and nitrogen rates in developing a model of grain starch accumulation. Important findings The model proposed that the rate of grain starch accumulation was determined by (a) carbon availability restricted by source and (b) carbon accumulation rate restricted by sink. Carbon accumulation rate restricted by sink was dependent on the potential starch accumulation rate and the interaction of influencing factors: temperature, water, nitrogen conditions within plants and the ability of carbon translation into starch. Carbon availability in grains restricted by source was the sum of carbon assimilation from the photosynthetic organs and remobilization from the vegetative organs after anthesis. Photosynthetic product transported to grain directly after anthesis exhibited a logarithmic relationship to post-anthesis growing degree days. Post-anthesis carbon remobilization from the vegetative organs included remobilization from leaves and stems. Testing of the model with independent datasets involving different years, eco-sites, varieties and nitrogen rates indicated values of RMSE of 3.61% and 4.51% and R2 of 0.994 and 0.959 for starch accumulation and content, respectively. Results showed that the model could predict accumulation and content of grain starch in rice under different cultivated conditions, which provides a quantitative tool for quality prediction and regulation.
DOI:10.1016/j.fcr.2015.02.023URL [本文引用: 2]
DOI:10.1016/j.envexpbot.2016.08.006URL [本文引用: 2]
DOI:10.1016/j.agrformet.2017.08.018URL [本文引用: 3]
DOI:10.1016/j.agrformet.2017.04.016URL [本文引用: 2]
[本文引用: 2]
[D].
[本文引用: 3]
[D].
[本文引用: 3]
DOI:10.2135/cropsci1989.0011183X002900040045xURL [本文引用: 1]
DOI:10.2135/cropsci1989.0011183X002900040038xURL
DOI:10.2135/cropsci1989.0011183X002900040039xURL [本文引用: 1]
[D].
[本文引用: 1]
[D].
[本文引用: 1]
DOI:10.1016/j.fcr.2013.03.012URL [本文引用: 1]
Plant-based analytical techniques of nitrogen (N) nutrition, established on the concept of critical nitrogen (N-c), can be used to diagnose the in-season N status of rice, which in turns can provide understanding of N nutrition and serve as a guide for the profitability and sustainability of agricultural production system. The objectives of present study were to develop an appropriate N-c curve for Japonica rice, to compare this curve with existing N-c dilution curve for Indica rice and to assess its plausibility to estimate the level of N nutrition for rice crop in east China. Three field experiments were conducted with varied N rates (0-360 kg N ha(-1)) in three Japonica rice (Ouzo sativa L.) hybrids, Lingxiangyou-18 (LXY-18), Wuxiangjing-14 (WXJ-14) and Wuyunjing (WYJ) in Jiangsu province of east China. Five hills from each plot were sampled from active tillering to heading for growth analysis. The N-c dilution curve for rice, based on whole-plant N concentration, was described by the equation (N-c = 3.53W(-0.28)), when aboveground biomass ranged from 1.55 to 12.37 t ha(-1). However, for above-ground biomass <1.55 t ha(-1), the constant critical value N-c = 3.05% DM was applied, which was independent of aboveground biomass. Our N-c dilution curve was lower than the existing curve of Indica rice in tropics. The N nutrition index (NNI) and accumulated N deficit (N-and) ranged from 0.58 to 1.06 and 127 to -12 kg ha(-1), respectively, during main development stages under different N treatments in 2010 and 2011. Different N fertilizations were suggested for unit NNI increase or unit N-and decrease at different stages. LXY-18 have more N assimilation tendency than WXJ-14 for satisfying rice growth for same dry matter. The N-c dilution curve, resulting NNI and N-and, adequately identified situations of limiting and non-limiting N nutrition and could be used as a reliable indicator of N stress during the growing season of Japonica rice in east China. (C) 2013 Elsevier B.V.
DOI:10.1016/j.fcr.2013.12.007URL [本文引用: 1]
Accurate measurement of the nitrogen (N) required for plant growth helps optimize grain yield, farm profits, and N-use efficiency. Critical nitrogen (N-c) curves have been developed to describe N dilution in plant tissues during crop growth and to estimate the N status of whole plants; however, N-c curves for leaves have yet to be constructed. We constructed and validated a leaf N-c curve for winter wheat based on leaf dry matter (LDM) and compared it with published whole-plant N-c curves to explore the potential for estimating leaf N status of winter wheat in eastern China. Four field experiments were conducted using a range of N fertilization levels (0-375 kg ha(-1)) applied to six wheat cultivars in eastern China. For our growth analyses, we determined LDM and leaf N concentration (LNC) in the developmental phases from spring regrowth to heading. The leaf N-c curve fit the following relationship: N-c =3.05LDM(-0.15) when LDM ranged from 0.52 to 2.64 t ha(-1). However, when LDM was <0.52 t ha(-1), we applied a constant leaf critical value of 3.37%. The curve we constructed was lower than the reference whole-plant N-c curve. The N nutrition index (NNI) ranged from 0.34 to 1.31 during the vegetative stage across the 2009-2011 seasons. There was a significant positive relationship between the difference values of NNI (Delta NNI) and N (Delta N) applications over the four wheat developmental stages. We obtained a root-mean-squared-error (RMSE) of 24.53 kg ha(-1) between the predicted and observed Delta N values when testing the models with independent data. The leaf N-c dilution curve correctly identified N-limiting and non-N-limiting statuses and may be used as a reliable indicator of N stress during the growing season of winter wheat in eastern China. (C) 2013 Elsevier B.V.
DOI:10.1017/S0021859618001004URL [本文引用: 1]
URL [本文引用: 1]
A deep understanding of crop-water eco-physiological relations is the basis for quantifying plant physiological responses to soil water stress. Pot experiments were conducted to investigate the winter wheat crop-water relations under both drought and waterlogging conditions in two sequential growing seasons from 2000 to 2002, and then the data were used to develop and validate models simulating the responses of winter wheat growth to drought and waterlogging stress. The experiment consisted of four treatments, waterlogging (keep 1 to 2 cm water layer depth above soil surface), control (70%-80% field capacity), light drought (40%-50% field capacity) and severe drought (30%-40% field capacity) with six replicates at five stages in the 2000-2001 growth season. Three soil water content treatments (waterlogging, control and drought) with two replicates were designed in the 2001-2002 growth season. Waterlogging and control treatments are the same as in the 2000-2001 growth season. For the drought treatment, no water was supplied and the soil moisture decreased from field capacity to wilting point. Leaf net photosynthetic rate, transpiration rate, predawn leaf water potential, soil water potential, soil water content and dry matter weight of individual organs were measured. Based on crop-water eco-physiological relations, drought and waterlogging stress factors for winter wheat growth simulation model were put forward. Drought stress factors integrated soil water availability, the sensitivity of different development stages and the difference between physiological processes (such as photosynthesis, transpiration and partitioning). The quantification of waterlogging stress factor considered different crop species, soil water status, waterlogging days and sensitivity at different growth stages. Data sets from the pot experiments revealed favorable performance reliability for the simulation sub-models with the drought and waterlogging stress factors.
DOI:10.1111/gcb.13212URL [本文引用: 1]
DOI:10.1016/j.eja.2017.12.001URL [本文引用: 2]
DOI:10.1111/gcb.2019.25.issue-4URL [本文引用: 3]
URL [本文引用: 2]
The objective of this paper was to develop a morphological parameter-based root geometric model of rice and realize the dynamic three-dimensional visualization of rice roots under different growth conditions. The three-dimensional display model of single
URL [本文引用: 2]
The objective of this paper was to develop a morphological parameter-based root geometric model of rice and realize the dynamic three-dimensional visualization of rice roots under different growth conditions. The three-dimensional display model of single
URLPMID:21548300 [本文引用: 2]
Crop three-dimensional (3D) morphological modeling and visualization is an important part of digital plant study. This paper aimed to develop a 3D morphological model of wheat root system based on the parameters of wheat root morphological features, and to realize the visualization of wheat root growth. According to the framework of visualization technology for wheat root growth, a 3D visualization model of wheat root axis, including root axis growth model, branch geometric model, and root axis curve model, was developed firstly. Then, by integrating root topology, the corresponding pixel was determined, and the whole wheat root system was three-dimensionally re-constructed by using the morphological feature parameters in the root morphological model. Finally, based on the platform of OpenGL, and by integrating the technologies of texture mapping, lighting rendering, and collision detection, the 3D visualization of wheat root growth was realized. The 3D output of wheat root system from the model was vivid, which could realize the 3D root system visualization of different wheat cultivars under different water regimes and nitrogen application rates. This study could lay a technical foundation for further development of an integral visualization system of wheat plant.
URLPMID:22007453 [本文引用: 1]
Based on the field experiments with different plant-type wheat (Triticum aestivum) cultivars and varied population densities, the time-course changes in the angle between stem and sheath (stem-sheath angle) on main stem were observed, and a process-based model was developed for simulating the growth dynamics of stem-sheath angle on the main stem by using system analysis method and dynamic modeling technology. The stem-sheath angle increased with the growth of corresponding leaves, and decreased with increasing population density. The maximum stem-sheath angle decreased with increasing leaf position, except for the first leaf on main stem. The growth dynamics of stem-sheath angle could be described with Logistic equation, and the changes in the maximum stem-sheath angle with leaf position could be quantified with two different equations. The maximal value of stem-sheath angle at the second leaf position was considered as the cultivar parameter to reflect the genetic differences, and the plant number per unit area was used to quantify the effects of population density. The independent field experiment dataset of different wheat cultivars was used to test the model, and the average RMSE between estimated and observed values was 1.7 degrees, suggesting that the present model had good performance and reliability on predicting the growth dynamics of wheat stem-sheath angle, and provided a key module for wheat plant-type simulation and visualization.
DOI:10.3864/j.issn.0578-1752.2012.21.004URL [本文引用: 1]
【Objective】The objective of this paper is to develop a dynamic simulation model on angle between stem and sheath at different leaf positions on main stem in different rice cultivars and nitrogen application rates.【Method】Based on rice experiments with different cultivars and nitrogen rates, the values of angel between stem and sheath of different leaf positions on main stem during different development stages were continuously observed, a dynamic simulation model for changes of angle between sheath and stem at different leaf positions on main stem was developed by using dynamic modeling technology. 【Result】 Rice angle between stem and sheath increased with leaf development progress, the duration from the beginning of angle formation to the maximal value was about three leaf ages and the angles increased with the increasing nitrogen rates. From the first leaf to the third leaf, the maximum angle between stem and sheath at each leaf position increased with the increasing leaf position, and then decreased with the increase of leaf position. The logistic equation could be used to describe the change process of the angle between stem and sheath on main stem with growing degree days (GDD) in different varieties and nitrogen rates, and the maximum angle between stem and sheath with leaf position on main stem could be described with linear piecewise function. A variety parameter (the maximum angle between stem and sheath at the third leaf position) was introduced to quantify the variety characteristics on the angle between stem and sheath. Nitrogen factor was also used to reflect the effect of nitrogen on the angle between stem and sheath. 【Conclusion】A set of independent pot and pool experiments data were used to test the model, and the root mean square error (RMSE) between observed and simulated values was 2.31° and 2.78°, respectively, and the relative RMSE (RRMSE) was 11.56% and 14.77%, respectively, which indicated that the model has a good performance on predicting the angle between stem and sheath at different leaf positions on main stem. These results would provide technological support for the visualization of rice plant.
DOI:10.1016/j.njas.2009.11.001URL [本文引用: 1]
URL [本文引用: 1]
With the development of digital agriculture, the visualization expression of plant growth process is very important. Quantifying the dynamic process of leaf color is the basic part of plant growth visualization. At present, the study on plant leaf color visualization at home and abroad is emphasized on reversing and rebuilding crop virtual growth with the figure identifying technique in computer, however, simulation model and visualization technique based on leaf color dynamic process have not been established successfully.
Modeling leaf color dynamics in rice is an important task for realizing virtual and digital plant growth. Based on time-course observations on leaf color changes at different leaf positions of stem and tillers under different nitrogen rates and water conditions with four rice cultivars, we developed a simulation model on leaf color dynamic changes in rice in relation to GDD. Leaf color changes in the model were described with SPAD in three phases. The first phase during leaf growth period was based on the exponential relationship of leaf color to cumulative GDD; the second phase during leaf function period was represented with a relative stable SPAD; the third phase during leaf senescence period was described in a quadratic equation between SPAD and GDD. In addition, the effects of nitrogen and water conditions on leaf color were quantified through the effectiveness values of leaf nitrogen concentration and water content in relation to SPAD. Then, the RGB values were further predicted from the changing SPAD. The model was validated with the independent field experiment data involving different rice cultivars and nitrogen rates. The average RMSEs between the simulated and observed SPAD dynamics at different leaf positions were 2.58, 3.69, and 3.82, respectively, for three leaf color phases on main stem, 4.65, 4.39, 3.51, and 4.25, respectively, for four individual tillers in rice, and 2.98, 3.25, respectively, for SPAD and R, G values.
The results indicate that the present model has a good performance in predicting leaf color changes at different leaf positions in rice under different growth conditions, and thus lays a foundation for further constructing digital and visual rice growth system.
DOI:10.1016/S2095-3119(16)61597-6URL [本文引用: 1]
DOI:10.1371/journal.pone.0171890URLPMID:28207799 [本文引用: 1]
The leaf angle between stem and sheath (SSA) is an important rice morphological trait. The objective of this study was to develop and validate a dynamic SSA model under different nitrogen (N) rates for selected rice cultivars. The time-course data of SSA were collected in three years, and a dynamic SSA model was developed for different main stem leaf ranks under different N rates for two selected rice cultivars. SSA increased with tiller age. The SSA of the same leaf rank increased with increase in N rate. The maximum SSA increased with leaf rank from the first to the third leaf, then decreased from the third to the final leaf. The relationship between the maximum SSA and leaf rank on main stem could be described with a linear piecewise function. The change of SSA with thermal time (TT) was described by a logistic equation. A variety parameter (the maximum SSA of the 3rd leaf on main stem) and a nitrogen factor were introduced to quantify the effect of cultivar and N rate on SSA. The model was validated against data collected from both pot and field experiments. The relative root mean square error (RRMSE) was 11.56% and 14.05%, respectively. The resulting models could be used for virtual rice plant modeling and plant-type design.
URL [本文引用: 2]
Crop organ morphological model is one of the key technologies of virual crop. By observing and analyzing the morphological and topological structures of wheat spike, the morphological parameter-based 3D geometric model and visualization method were developed. Based on the existing morphological model of spike in wheat, the 3D morphological geometric model of wheat spike was constructed by integrating the topological structure of spike, including the submodels of ear axis, spikelet (including outer bran, awn and anther) and spike shape. The ear axis was constructed by connected proglottids which were represented by slant cylinder. Based on the surface vertical curve, the outer bran was simulated by approximate semiellipsoid with triangular faces. The awn, with transversal surface as nearly equilateral triangular, was constructed by triangular faces based on the curve of awn. The anther on the top of floret in flowering stage was simulated with NURBS surface. In addition, the spike shape was controlled by using hierarchical model. Then according to the topological structure, the above organ models were organized together to rebuild the whole 3D geometric model of wheat spike. By further integrating the rendering models of color, texture and light, the visualization of growth dynamic of wheat spike was realized based on the platform of Microsoft .Net and CSOpenGL graphic library. The reconstructed geometric model with three dimensions can simulate visualization of growth dynamic of wheat spike under different varieties and treatments. The result will be helpful to realizing the realistic simulation of wheat plant, and the digitalization and visualization of growth dynamic of wheat.
DOI:10.1016/j.eja.2013.08.008URL [本文引用: 1]
This paper was to develop the models for predicting the dynamics of panicle geometric. morphology, panicle and branch curves and panicle color, and to visualize rice panicle in three dimensions (3D). Based on three experiments with different rice (Oryza sativa L.) cultivars, the time-course data were collected on the panicle geometric morphology, (including the number of branches and spikelets, the lengths of panicle and branches, and the diameter of panicle axis), the spatial coordinates of panicle axis and branches, and the RGB (red, green and blue) values of panicle color in rice. The dynamics of rice panicle morphology, panicle and branch curves, and RGB values of panicle color with thermal time (TT) were then characterized and simulated. The derived models were further used to visualize rice panicle in 3D. The results indicated that some appropriate functions (quadratic, logistic, exponential and Gaussian) could be chosen to describe the dynamics of the panicle geometric morphology and the RGB values of panicle color with time (growing process) and space (distributions of panicle organs) during panicle development. Combining the above models with the topological structure of rice panicle, rice panicle was visualized with Microsoft.Net and OpenGL (a graphics library). Validation of the models with the independent data indicated that all relative root mean square errors (RRMSEs) between the measured and simulated values were below 20%. Comparison of virtual and real panicles at different development stages showed that the virtual rice panicles were quite similar to real panicles. Overall, the present study could effectively simulate the dynamic changes of 3D morphology and color characteristics of rice panicle, and would provide a key technological support for fulfilling visualization of the whole rice plant. (C) 2013 Elsevier B.V.
[本文引用: 1]
[本文引用: 1]
DOI:10.1016/S2095-3119(17)61769-6URL [本文引用: 1]
URL [本文引用: 2]
To effectively improve realistic and efficiency of visualization of wheat population, a real-time rendering algorithm based on multi-technology integration was developed for visualization of wheat population growth. Firstly, based on the rule of morphological formation of wheat population, differences between individual architectures in population were analyzed. Secondly, in order to improve rendering efficiency, level of detail (LOD) model was adopted, space dividing and selection of level of detail were decided by sight position, sight angle and sight line. View frustum culling was used to reduce the number of detecting point and improve speed of sigle point culling. Tree-structure display list was used to improve data strcture design. Thirdly, external reference and instance technology was used to improve realistic of visualization by generate several diffferent samples which would be used when wheat population were rendering. Finally, a simulation experiments for comparison showed that the rendering algorithm based on multi-technology integration improved efficiency of real-time visualization of wheat population, reduced memory requirement, the techologies for visualization of wheat population growth had a good performance on dynamic and realistic characteristics. These results are helpful for development of a visualization wheat growth system.
URL [本文引用: 2]
Driven by weather, soil, variety and cultivation techniques databases and integrating process-based growth simulation model, morphogenesis model, visualization model, strategy analysis and estimate model, weather data generation model and variety parameter debug model, a model-based visual growth system in rice (MVGSR) was developed using component-based software and visualization technology. The system was programmed in the .NET framework with the C# language, and the OpenGL library was used for realizing 2D and 3D graphics application and visualization. The implemented system could be used for predicting growth progress and visualizing morphological architecture of rice plant under various environments, genotypes and management strategies, and had the functions as data management, growth simulation, strategy evaluation, real-time prediction, temporal and spatial analysis and system help. The MVGSR should be useful for improving the levels of digitalization and visualization of crop growth and production system and lay a foundation for development of visual agriculture.
DOI:10.1016/S2095-3119(13)60528-6URL [本文引用: 1]
The accurate assessment of the spatiotemporal changes in soil nutrients influenced by agricultural production provides the basis for development of management strategies to maintain soil fertility and balance soil nutrients. In this paper, we combined spatial measurements from 2 157 soil samples and geostatistical analysis to assess the spatiotemporal changes in soil organic carbon (SOC), total nitrogen (TN), available phosphorus (AP) and available potassium content (AK) from the first soil survey (in the 1980s) to the second soil survey (in the 2000s) in the Taihu region of Jiangsu Province in China. The results showed that average soil nutrients in three soil types all exhibited the increased levels in the 2000s (except for AK in the yellow brown soil). The standard deviation of soil nutrient contents increased (except for TN in the paddy soil). Agricultural production in the 20 years led to increases in SOC, TN, AP and AK by 74, 82, 89 and 65%, respectively, of the Taihu areas analyzed. From the 1980s to 2000s all the nugget/sill ratios of soil nutrients indices were between 25 and 75% (except for AK in the yellow brown soil in the 2000s), indicating moderate spatial dependence. The ratio of AP in the yellow brown soil in the 2000s was 88.74%, showing weak spatial dependence. The Spatial correlation range values for SOC, TN, AP and AK in the 2000s all decreased. The main areas showing declines in SOC, TN and AP were in the northwest. For AK, the main region with declining levels was in the east and middle of western areas. Apparently, the increase in soil nutrients in the Taihu region can be mainly attributed to the large increase in fertilizer inputs, change in crop systems and enhanced residues management since the 1980s. Future emphasis should be placed on avoiding excess fertilizer inputs and balancing the effects of the fertilizers in soils.
DOI:10.1016/j.agrformet.2016.02.016URL [本文引用: 1]
URLPMID:26110263 [本文引用: 2]
DOI:10.1111/gcb.12442URLPMID:24259291 [本文引用: 2]
Wheat is sensitive to high temperatures, but the spatial and temporal variability of high temperature and its impact on yield are often not known. An analysis of historical climate and yield data was undertaken to characterize the spatial and temporal variability of heat stress between heading and maturity and its impact on wheat grain yield in China. Several heat stress indices were developed to quantify heat intensity, frequency, and duration between heading and maturity based on measured maximum temperature records of the last 50 years from 166 stations in the main wheat-growing region of China. Surprisingly, heat stress between heading and maturity was more severe in the generally cooler northern wheat-growing regions than the generally warmer southern regions of China, because of the delayed time of heading with low temperatures during the earlier growing season and the exposure of the post-heading phase into the warmer part of the year. Heat stress between heading and maturity has increased in the last decades in most of the main winter wheat production areas of China, but the rate was higher in the south than in the north. The correlation between measured grain yields and post-heading heat stress and average temperature were statistically significant in the entire wheat-producing region, and explained about 29% of the observed spatial and temporal yield variability. A heat stress index considering the duration and intensity of heat between heading and maturity was required to describe the correlation of heat stress and yield variability. Because heat stress is a major cause of yield loss and the number of heat events is projected to increase in the future, quantifying the future impact of heat stress on wheat production and developing appropriate adaptation and mitigation strategies are critical for developing food security policies in China and elsewhere.
URL [本文引用: 1]
The climate resources during rice-growing periods in main growing regions of China are highly uncertain because of its vast area and marked variation. The daily meteorological data during the years from 1961 to 1970 (1960s) and 1996 to 2005 (2000s) of 333 weather stations in main rice growing regions of China were processed to generate the gridded daily meteorological surface data using ANUSPLIN and ARCGIS. The spatial and temporal distribution characteristics of the climate resources for the rice production, including total sunshine hours, total growing degree days above 10℃, average difference of diurnal air temperature, total precipitation, total rainfall days and average daily precipitation during rice-growing periods between two decades (1960s and 2000s) were calculated and analyzed based on the grid cell. As compared with 1960s, the total sunshine hours in rice-growing periods of 2000s decreased by 11.93%, and the decreasing rates of total sunshine hours in the Northeast and Southwest China were lower than those in the Middle and South China. From 1960s to 2000s, the total growing degree days above 10℃ increased by 9.40%, and the increasing rates of total growing degree days above 10℃ in the Northeast and Southwest China were faster than those in the Middle and South China. However, in part areas of the Middle and South China, the total growing degree days above 10℃ during rice-growing periods decreased. The average differences of diurnal air temperature during rice-growing periods of 2000s decreased by 4.86% as compared with 1960s, while increased in part areas of the Middle and South China. The decreasing rates of average difference of diurnal air temperature in the Northeast and Southwest China were higher than those in the Middle and South China. Compared with 1960s, total precipitation during rice-growing periods in 2000s increased by 1.59% and average daily precipitation increased by 3.22%. The spatial distribution of the change rate of average daily precipitation was similar to that of total precipitation, the total precipitation and average daily precipitation decreased in Ningxia province and the Northeast China, while increased in the Middle and South China. Compared with 1960s, the total rainfall days during rice-growing periods of 2000s decreased by 1.60%, and the decreasing rates of total rainfall days in the Northeast and Middle China were lower than that in the South China. These results can provide the technical support for further analysis of yield increasing potential and yield increasing method of rice in China.
URL [本文引用: 2]
【Objective】 The objective of this study was to predict regional wheat productivity, which would lay a foundation for quantitative evaluating agricultural productivity and precision management. 【Method】 Considering the approaches related to scaling-up the crop model from plot to region level, a regional wheat model was developed by integrating the WheatGrow model with GIS. To address the spatial variability, grid-based data as model input were generated in advance by interpolation and overlaying with the aid of GIS. When all the necessary input data were available, the target region was partitioned into smaller and relatively homogeneous spatial grids, and crop yields were simulated with WheatGrow for each grid cell. The regional wheat productivity of Jiangsu Province in 2000 was simulated. 【Result】 The distribution of wheat yield that simulated by the regional wheat model based on grid input data, was coincident with statistic data. The mean RMSE of wheat yield between simulated result and statistics was 496.48 kg?hm-2. 【Conclusion】 The results indicated that the GIS based regional wheat model has a good performance in predicting regional wheat productivity.
DOI:10.1016/j.agrformet.2012.12.008URL [本文引用: 2]
DOI:10.1038/s41598-017-06312-xURLPMID:28729701 [本文引用: 3]
Wheat production is of great importance for national food security and is greatly influenced by the spatial variation of climatic variables, soils, cultivars, etc. This study used WheatGrow and CERES-Wheat models integrated with a GIS to estimate winter wheat productivity, yield gap and water use in the main wheat production regions of China. The results showed that the potential wheat yield gradually increased from south to north and from west to east, with a spatial distribution consistent with the accumulated hours of sunshine. The gap between potential and actual yield varied from 382 to 7515 kg ha(-1), with the highest values in Shanxi, Gansu and Shaanxi provinces and the lowest values in Sichuan province. The rainfed yield decreased gradually from south to north, roughly following the pattern of the ratio of accumulated precipitation to accumulated potential evapotranspiration. Under the scenario of autoirrigation, relatively high irrigation water use efficiency was found in western Shandong and southern Sichuan, as well as in northern Henan, Shanxi and Shaanxi. Furthermore, the limiting factors were analysed, and effective measures were suggested for improving regional winter wheat productivity. These results can be helpful for national policy making and water redistribution for agricultural production in China.
[本文引用: 2]
DOI:10.3864/j.issn.0578-1752.2013.16.004URL [本文引用: 1]
【Objective】A method for correcting Regional Climate models (RCMs) output was developed in this research, which will lay a foundation for crop model prediction under future climate scenarios. 【Method】 The daily rainfall intensity, rainfall frequency, solar radiation, maximal and minimal temperatures output data of RegCM3 from 1994 to 2010 were corrected based on the historical daily weather records from 1960 to 1993 in Xuzhou, Huai’an, Zhengzhou, Weifang and Shijiazhuang. 【Result】 Compared with the raw meteorological data from RegCM3, the corrected monthly mean meteorological variables, the corrected monthly meteorological variables, and the probability distribution of daily rainfall, temperature and solar radiation from 1994 to 2010 agreed better with the observed values, especially for the extreme high temperature and high rainfall frequency. In addition, dry spell length after correction in five eco-sites was consistent with the observed values. The determination coefficient and normalized root mean square error (NRMSE) between observed and simulated yields from WheatGrow model with daily corrected RegCM3 at above five eco-sites reached 0.72 and 10.5%, which were 0.35 higher and 8.2% lower than those with daily raw RegCM3 outputs, respectively.【Conclusion】Therefore, the correction method in this research could be further used to correct the future meteorological data which generated by RegCM3, and the corrected meteorological data could be taken as the input data of crop model to improve the prediction accuracy of crop model.
DOI:10.1038/nclimate3115URL [本文引用: 2]
DOI:10.1016/j.eja.2017.11.002URL [本文引用: 1]
URL [本文引用: 1]
In this study, a deterministic algorithm named Ensemble Square Root Filter (EnSRF), an algorithm significantly improved from the Ensemble Kalman Filter (EnKF), was used to integrate remotely sensed information (ASD spectral data, HJ-1 A/B CCD and Landsat-5 TM data) with a wheat (Triticum aestivum L.) growth model (WheatGrow). The analyzed values of model variables, leaf area index (LAI) and leaf nitrogen accumulation (LNA), were calculated based on EnSRF without perturbed measurements. Independent datasets were used to test EnSRF and the root mean square error (RASE) values were 0.81 and 0.82 g m(-2), with relative error (RE) values of 0.15 and 0.13, for LAI and LNA, respectively. RMSE values for IAI and LNA were 1.39 and 1.70 g m(-2) respectively (RE, 0.28 and 0.34) based on EnKF, 1.17 and 1.80 g m(-2) (RE, 0.24 and 0.35), respectively, based on the WheatGrow model alone, and 0.97 and 1.25 g m(-2) (RE, 0.21 and 0.24), respectively, based on the remote sensing models. These results indicated that the LAI and LNA values based on EnSRF matched the measured values well compared with the EnKF, WheatGrow and remote sensing models. In addition, the predicted results are consistent with the temporal and spatial distribution of winter wheat growth status and grain yields in the study area, with RE values of less than 0.2 and 0.1 for LAI and LNA, respectively. These results provide an important approach for simulating winter wheat growth status based on combining remote sensing and crop growth models.
DOI:10.1117/1.JRS.8.083674URL [本文引用: 2]
[本文引用: 2]
DOI:10.1016/j.fcr.2016.04.014URL [本文引用: 2]
[D].
[本文引用: 1]
[D].
[本文引用: 1]
[D].
[本文引用: 1]
[D].
[本文引用: 1]
DOI:10.1016/j.fcr.2013.04.022URL [本文引用: 3]
Separation of the influencing factors (climate, soil, variety, management) affecting crop yield could provide valuable insight into how crop responds to climate change and how crop yield can be enhanced in the future. In this study, we reported the changes of climatic conditions, soil nutrients, variety types and management practices in the Taihu region (a typical rice growing zone) of east China in two periods (the 1980s and the 2000s), and simulated the changes of rice (Oryza sativa L) yields under different scenarios by using the APSIM-Oryza model. The contributions of the influencing factors in rice growing system were also calculated. The results revealed that there was a warming trend in the rice growing period in the Taihu region. However, the precipitation and sunshine hours in the rice growing season showed a decreasing trend in the past 30 years. Compared with the soil nutrients in the 19805, the mean concentrations of soil organic carbon, total nitrogen, available phosphorus and potassium in the 2000s in the Taihu region were increased by 15.85%, 79.55%, 124.55% and 10.37%, respectively. The rice varieties in the 1980s could be described as the 'panicle weight type', while in the 2000s as the 'panicle number type'. The differences in management practices between 1980s and 2000s were mainly attributed to the fertilization and irrigation methods. From the 1980s to 2000s, the average rice yield in the Taihu region increased by 46.3%. The individual contribution of the climate change, soil improvement, variety updating and management progress on rice productivity was estimated as -19.5%, 12.7%, 21.7% and 34.6%, respectively. In addition, the spatial variation of rice yields in the whole region was reduced from 13.7% to 7.4% with the soil fertility improvement. The results indicate that future adaptations to climate change for rice yields would require either enhanced tolerance to high temperatures in the existing rice varieties or change in the current management practices, while balancing the soil fertility is a continuing process. (C) 2013 The Authors. Published by Elsevier B.V.
[D].
[本文引用: 1]
DOI:10.1016/j.eja.2015.02.010URL [本文引用: 1]
DOI:10.1016/j.agrformet.2020.107900URL [本文引用: 1]
URL [本文引用: 1]
There are a great number of problems with the integration process between crop models and GIS, such as duplicated function development, model sharing difficulty, and limited geographic processing online integration capabilities, etc. Web service composition framework for regional applications of crop models based on service-oriented architecture(SOA) was designed in this paper. The development process, interface design and implementation method about model computing web services, dynamic thematic map web services and spatial interpolation web services were illustrated by using ArcGIS Service and Model Builder as development platform. Combined with rich client technologies, the wheat production and management support prototype system based on service-oriented architecture and WebGIS (WPMSS-GISOA) was developed. The functions of map data uploading and publishing , weather and soil data querying, wheat planting design, spatial interpolation analysis, and so on were realized in this system. Functional test indicated that the web service composition framework for regional applications of crop models based on service-oriented architecture and WebGIS was feasible, which provides a reference for online seamless integration between crop models and geographic information system.
URL [本文引用: 2]
Growth model-based decision support system(DSS) for crop management is the tool to help users make decision by simulation experiments and strategy analysis on the basis of crop growth model, DBMS and strategy evaluation system. Application of web technology to DSS is becoming a major direction for development of DSS in agriculture. Based on the stand-alone growth model-based decision support system for wheat management and the four-layer web structure of "Web browser/Web server/Application server/Database server", a growth model and web-application-based decision support system for wheat management(GMDSSWMw) with good compatibility, arrangement and security was developed by using the techniques of object-orientation, COM+ component and web application. The implemented system can be used for evaluating individual and comprehensive management strategies based on the results of wheat growth simulation under the web service environment. The test and application of the system showed that the GMDSSWMw was realized with proper functions of long-distance prediction, decision-making and dynamic regulation, thus providing basis for establishing web-based digital wheat farming system as well as other crops' management systems.
DOI:10.1016/j.fcr.2015.03.004URL [本文引用: 1]
[本文引用: 1]
DOI:10.1093/jxb/erz092URLPMID:30921457 [本文引用: 1]
In spite of the increasing expectation for process-based crop modelling to capture genotype (G) by environment (E) by management (M) interactions to support breeding selections, it remains a challenge to use current crop models to accurately predict phenotypes from genotypes or from candidate genes. We use wheat as a target crop and the APSIM farming systems model (Holzworth et al., 2014) as an example to analyse the current status of process-based crop models with a major focus on need to improve simulation of specific eco-physiological processes and their linkage to underlying genetic controls. For challenging production environments in Australia, we examine the potential opportunities to capture physiological traits, and to integrate genetic and molecular approaches for future model development and applications. Model improvement will require both reducing the uncertainty in simulating key physiological processes and enhancing the capture of key observable traits and underlying genetic control of key physiological responses to environment. An approach consisting of three interactive stages is outlined to (i) improve modelling of crop physiology, (ii) develop linkage from model parameter to genotypes and further to loci or alleles, and (iii) further link to gene expression pathways. This helps to facilitate the integration of modelling, phenotyping, and functional gene detection and to effectively advance modelling of GxExM interactions. While gene-based modelling is not always needed to simulate GxExM, including well-understood gene effects can improve the estimation of genotype effects and prediction of phenotypes. Specific examples are given for enhanced modelling of wheat in the APSIM framework.
DOI:10.1016/j.eja.2018.02.005URL [本文引用: 1]
DOI:10.1016/j.agrformet.2019.05.018URL [本文引用: 1]
DOI:10.1016/j.rse.2019.04.016URL [本文引用: 1]
DOI:10.3864/j.issn.0578-1752.2013.11.005URL [本文引用: 1]
【Objective】 Fast and accurate estimation of crop growth model parameters is the basis of the crop system simulation.【Method】In this paper, a newly improved genetic algorithm, named individual advantage genetic algorithm (IAGA), is proposed and applied to the field of the parameters evaluation of the rice development stages model. Firstly, the individual advantage operator was introduced into the genetic algorithm, thus improved the mutation operator and the update strategy of population. Secondly, two rice development stages models, RiceGrow and ORYZA2000, were coupled with IAGA in a way of total embedment, and realized automatic estimation of the parameters in the models. At last, a series of comparative experiments were carried out to verify the effectiveness of IAGA with multi-year field trial data of Shanyou63, and other four rice varieties in Xuzhou, Gaoyao, etc.【Result】The experimental verification results which cover RMSE<3.05 d, NRMSE<3.19%, MDA<2.41 d, R2>0.9877, indicated that the accuracy of the model parameters obtained by IAGA was pretty high. The amount of data used for the parameters estimation had little effect on the results. The maximum NRMSE of the fitting results increased from 2.58% to 3.08% when the amount of data used for the parameters estimation from three years to six years was changed. More accurate model parameters were obtained when we select the data of every other year, including the maximum and minimum value of the whole growth period. Compared with the shuffled complex evolution algorithm, genetic simulated annealing algorithm and standard particle swarm algorithm, IAGA could obtain more accurate model parameters.【Conclusion】The IAGA can achieve automatic determination of rice development stages model parameters, therefore it provides an effective and new method for estimating parameters for crop growth model quickly and accurately.
DOI:10.1016/j.fcr.2016.05.001URL [本文引用: 1]
