 ,1,2, 雷秋良,1, 秦丽欢1, 朱阿兴3,4, 李晓虹1, 翟丽梅1, 王洪媛1, 武淑霞1, 闫铁柱1, 李文超1, 胡万里5, 任天志6, 刘宏斌1
Impact of Soil Data with Different Precision on Water Quality and Flow Simulation
LI Ying,1,2, LEI QiuLiang,1, QIN LiHuan1, ZHU AXing3,4, LI XiaoHong1, ZHAI LiMei1, WANG HongYuan1, WU ShuXia1, YAN TieZhu1, LI WenChao1, HU WanLi5, REN TianZhi6, LIU HongBin1通讯作者:
责任编辑: 李云霞
收稿日期:2019-09-23接受日期:2019-12-8网络出版日期:2020-08-16
| 基金资助: |
Received:2019-09-23Accepted:2019-12-8Online:2020-08-16
作者简介 About authors
李影,Tel:18810031557;E-mail:

摘要
关键词:
Abstract
Keywords:
PDF (3232KB)元数据多维度评价相关文章导出EndNote|Ris|Bibtex收藏本文
本文引用格式
李影, 雷秋良, 秦丽欢, 朱阿兴, 李晓虹, 翟丽梅, 王洪媛, 武淑霞, 闫铁柱, 李文超, 胡万里, 任天志, 刘宏斌. 不同精度的土壤数据对水质和水量模拟的影响[J]. 中国农业科学, 2020, 53(16): 3319-3332 doi:10.3864/j.issn.0578-1752.2020.16.010
LI Ying, LEI QiuLiang, QIN LiHuan, ZHU AXing, LI XiaoHong, ZHAI LiMei, WANG HongYuan, WU ShuXia, YAN TieZhu, LI WenChao, HU WanLi, REN TianZhi, LIU HongBin.
0 引言
【研究意义】当前我国水质污染情势严峻,成为制约我国可持续发展的主要因素之一[1,2]。人类的耕作、养殖和生产生活等活动引起的面源污染是造成水质恶化的主要原因[3,4,5]。由于面源污染的广泛性、复杂性和空间异质性等特征,基于污染物迁移转化过程的分布式水文模型逐渐被用于面源污染的研究中,如SWAT(soil & water assessment tool)模型、AnnAGNPS(annualized agricultural non-point source pollution model)模型和HSPF(hydrological simulation program- fortran)模型等[6,7,8]。此类模型可用于定量化描述人类活动对流域污染物产生和迁移过程的影响[9],为流域的规划和管理提供决策依据。虽然分布式模型在污染物的空间识别上具有绝对的优势,但它的复杂性和对数据的强依赖性,使得其在应用过程中具有很大的不确定性。依据来源的不同,可将不确定性划分为:模型的结构、输入数据和参数不确定性[10,11]。在众多的模型中,SWAT模型是采用日尺度作为最低模拟时间尺度的半分布式模型。该模型在我国得到了广泛的应用且模拟结果都可达到决定系数R2≥0.6,纳什系数NS≥0.5的可接受模拟效果[6,12-13]。然而,当前对于SWAT模型在使用过程中的不确定性问题的关注却远远不够。【前人研究进展】土壤数据作为流域模拟中的重要输入数据之一,其来源和分辨率的不同会影响地表的产流过程[14],这要归因于其属性的空间分布特征对模型坡面产流空间分布的影响[15]。国内外****研究了土壤数据对环境模型模拟的影响,发现土壤特征差异会放大气象条件的差异,并显著影响流域的水文响应,因此强调开发精细土壤数据库的必要性[16];但也有研究表明,模型的模拟效果与污染物类型有关,对土壤数据的精度不敏感[17];甚至有研究显示在低分辨率的土壤数据下径流模拟效果反而略好于高精度数据[18]。此外,土壤数据对模型的影响存在尺度效应,在汇流面积大于10 km2时,基于不同来源土壤数据的模拟结果吻合度较高[19,20]。由于土壤数据的可获取性,当前对于美国SSURGO和STATSGO两种土壤图的研究较多。尽管当前研究表明了不同的土壤图会对水文响应单元(hydrologic response unit, HRU)划分、水质水量模拟及相关参数的提取产生影响,但影响程度却存在差异[21,22],也未明确哪个土壤图更有优势[23]。全国第二次土壤普查形成了不同精度的土壤图,1﹕5万土壤图(县级土壤图)、1﹕50万土壤图(省级土壤图)和1﹕100万土壤图(国家级土壤图),是目前我国可以获得的3种类型土壤图,但鲜有研究分析这3种土壤图数据对流域模拟的影响。【本研究切入点】综上所述,应用精细分辨率土壤数据,需要花费更多的精力来收集或生产土壤数据、准备和校准模型,但当前的研究结果对于模型模拟所需土壤图的最佳分辨率仍然存在争议。此外,已有研究大多只关注于土壤数据对水量和水文过程模拟的影响,而对于水质的研究仍然较为缺乏。【拟解决的关键问题】鉴于此,本文采用当前应用广泛的SWAT模型,研究不同精度(1﹕5万、1﹕50万和1﹕100万)的土壤数据对HRU划分、模型参数和水质水量模拟的影响,以期丰富这一领域的建模先验知识,为流域水质和水量模拟时选取土壤基础数据提供依据。1 材料与方法
1.1 研究区概况
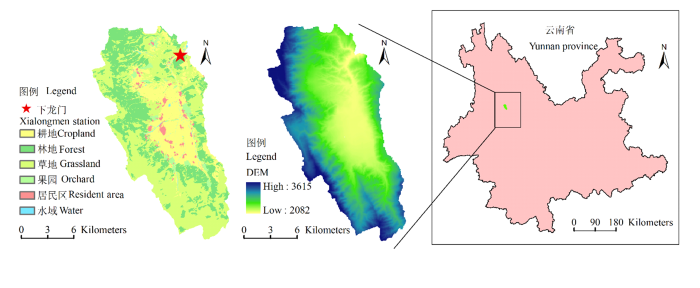
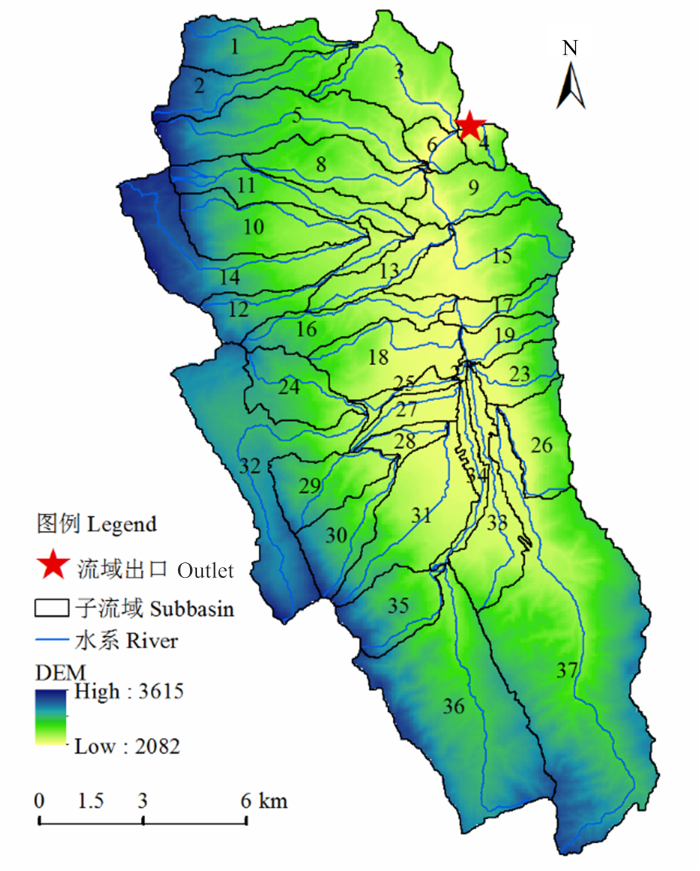
凤羽河流域(99.86°—100.03°E,25.88°—26.10°N)地处云南省大理白族自治州,被称为“洱海之源”,是洱海的源头。该流域位于我国西南山区,坡度较大,流域的平均坡度约19°。流域总面积为217 km2,主干河流全长12.8 km。流域内干湿季明显,年均气温在13.9℃,近5年平均降雨量为1 328 mm(下龙门监测站数据),7、8、9月的降水量占全年降水量的70.72%。该流域包含茈碧湖镇和凤羽镇的9个行政村,总人口约35 400人。流域内经济主要依靠种植业和养殖业,二者贡献了总产值的60%以上。其中,种植以水旱轮作和旱旱轮作为主;养殖以散养为主。流域内土地利用现状为草地(45.93%)、林地(29.59%)、果园(2.26%)、农村居民点(1.41%)和水域(0.03%)。此外,农用地占20.78%,包括旱地(8.89%)和水田(11.89%)(图1)。流域内的主要面源污染源为农村生活源、农田种植源和畜禽养殖源[24,25]。图1
 新窗口打开|下载原图ZIP|生成PPT
图1凤羽河流域位置图、数字高程图、土地利用图和流域出口监测点
Fig. 1Location of Fengyu river watershed in Yunnan province, digital elevation model (DEM), land use and monitoring site
1.2 数据资料
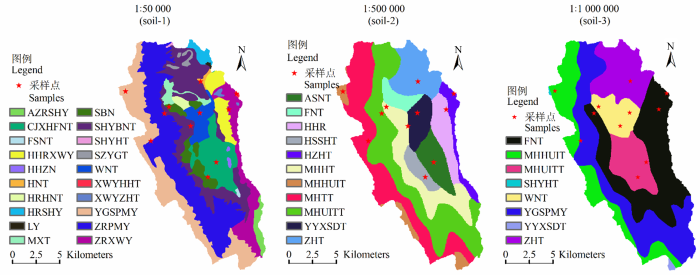
SWAT模型需要的输入数据主要为空间数据和属性数据。1.2.1 空间数据 本文用于构建SWAT模型的空间数据包括:DEM图、土壤类型图、土地利用图和水系图,栅格大小均为25 m×25 m。数据的详细信息如表1所示。其中,3种不同比例尺土壤图的土壤分类情况和实测采样点位置如图2所示。对比不同土壤图可知,随着比例尺的减小,较小的土壤斑块被合并,空间数据精细度降低。其中,1﹕5万的土壤图土壤分类为20种、1﹕50万的土壤图土壤分类为11种、1﹕100万的土壤图土壤分类为8种,3种土壤数据不仅在土壤分类的详细程度上有差异,同时各类土壤的边界也有明显的差别。
Table 1
表1
表1空间数据的精度和来源
Table 1
| 数据类别 Data item | 数据来源 Data source | 比例尺 Scale | 数据用途 Purpose |
|---|---|---|---|
| 数字高程图 Digital elevation model | 国家基础地理信息中心 National geomatic center of China | 1﹕50000 | 坡度、河网的提取及流域的划分 Extracting slope, river network and watershed division |
| 土地利用数据 Land use data | 大理州洱源县土地局(2003年) Land Resources Bureau | 1﹕10000 | 获得流域内土地利用类型及比例 Land use information |
| 水系图 Drainage map | 国家基础地理信息中心 National geomatic center of China | 1﹕250000 | 获得流域内水系分布情况 Distribution of river systems |
| 土壤图(soil-1) Soil map | 全国第二次土壤普查土壤图 The 2nd national soil survey | 1﹕50000 | 获得土壤类型及分布 Soil type and distribution |
| 土壤图(soil-2) Soil map | 全国第二次土壤普查土壤图 The 2nd national soil survey | 1﹕500000 | 获得土壤类型及分布 Soil type and distribution |
| 土壤图(soil-3) Soil map | 中国科学院南京土壤研究所 Institute of soil science, CAS | 1﹕1000000 | 获得土壤类型及分布 Soil type and distribution |
新窗口打开|下载CSV
图2
 新窗口打开|下载原图ZIP|生成PPT
图23种比例尺的土壤图和采样点
Fig. 2Soil maps of three scales and samples
1.2.2 属性数据 模型所需的其他数据主要包括:气象数据、土壤属性数据、农田管理措施、农村生活污染及畜禽养殖。这些数据通过实际的站点监测和现场调查获得,数据的详细信息如表2所示。
Table 2
表2
表2模型所需其他数据及其来源
Table 2
| 数据类别 Data item | 数据来源 Data source | 数据用途 Purpose |
|---|---|---|
| 气象数据 Weather data | 气象观测站 Weather station | 降水、气温、太阳辐射、风速等数据 Precipitation, temperature and so on |
| 土壤属性数据 Soil properties data | 土种志,野外挖掘土壤剖面及采样实测 Annals of soil classification, soil profiles and samples | 获得土壤物理及化学属性数据 Soil physical and chemical properties |
| 农田管理措施 Management information | 农户调查、统计资料 Survey and statistical data | 作物种植模式、施肥、灌溉和耕作情况 Field management data |
| 农村生活污染及畜禽养殖 Living pollution and livestock farming | 农户调查、统计资料 Survey and statistical data | 农村污水、固废垃圾产生量及处理方式,畜禽养殖 规模及其粪便处理方式等 Waste water, solid waste and livestock data |
新窗口打开|下载CSV
其中,土壤属性数据的物理属性数据包括土壤分层、土层结构、含水量、导水率、容重等;化学属性数据包括土壤中硝态氮、有机氮和无机磷等的含量。这些数据通过挖土壤剖面(每个土壤类型一个剖面),取土壤样品测试得到(土壤采样点分布见图2),具体测试结果可参考文献[26],未采集到的土壤类型数据通过土种志获得。
流域轮作方式主要为玉米-蚕豆和水稻-蚕豆,因此土地利用的属性数据主要输入了水稻、玉米和蚕豆的土地覆盖/植物生长数据库中的变量,对于其他类型的土地利用采用模型默认值。具体管理措施来自参考文献[26,27],其中灌溉用水量取自子流域所在的河道。
将流域内农村生活的排放作为点源输入模型中,通过流域的实地调查和查阅文献,确定各子流域的人口数量和排污系数。其中流域内人均年总氮(TN)排放量为1.87 kg、总磷(TP)排放量为0.22 kg,流域的入河系数为0.15 [25]。
1.2.3 实测数据
(1)水质数据。2011年1月至2013年12月,在凤羽河小流域出口(下龙门监测站)(图1),每天进行一次人工水样采集,并进行实验室分析。测试指标包括可溶性总氮、TN、TP和含沙量。水样采集后在4℃低温下冷藏保存,之后分别利用过滤烘干法测定含沙量;利用紫外分光光度计比色法测定总氮、溶解性总氮和含量;利用靛酚蓝比色法测定含量;利用钼蓝比色法测定溶解性总磷和总磷含量[26,27]。(2)水量数据。2010年6月至2012年6月,在下龙门监测站,使用Stalker II SVR测量流量数据。2012年6月,在下龙门监测站安装了Waterlog H-3553气泡水位计并可通过无线传输实现水位的远程自动实时监测。根据在流域出口的实测流量和水位数据建立水位-流量关系曲线Q=(4.09×H-81.54)2.20,H为水位计高度(m),Q为与H匹配的流量(m3·s-1),得到高频率的实时流量数据。
1.3 研究设计
SWAT模型[28]是一个日时间尺度上的连续模型,可以对流域等大尺度范围的多种污染物和水文过程进行模拟,具有计算效率高、模拟周期长等特点,已经成为流域水循环、污染源评价和流域管理措施分析的重要工具之一。本研究利用空间数据、属性数据及水文、气象监测数据,结合1﹕5万、1﹕50万和1﹕100万3种不同精度的土壤数据,分析不同的土壤图精度是否会对SWAT模型的模拟结果产生影响:
(1)水文响应单元(HRU)是SWAT模型进行流域模拟的基本单元,HRU的划分对于准确的模拟有着至关重要的作用。考虑流域中不同土壤所占比例及土壤类型的面积,设定0—16%的划分阈值范围,子流域中每种土地利用下小于该面积阈值的土壤类型将被忽略。通过不同的阈值设置生成HRU,分析不同阈值下模型划分HRU数量的差异。通过比较不同精度土壤数据对HRU划分的影响,可以在一定程度上反映其对SWAT模型模拟的影响。
(2)在流域土地利用类型划分阈值设置为10%、土壤类型划分阈值设置为10%和坡度面积的划分阈值设置为5%的前提下[26],运用3种不同精度的土壤数据进行凤羽河流域的水文和水质模拟,利用SWAT-CUP软件进行参数的调整和模拟效果的分析。为避免4个指标率定过程的相互影响,将流量、泥沙、总氮及总磷数据同时进行率定,分别得到1﹕5万(soil-1)、1﹕50万(soil-2)和1﹕100万(soil-3)3种不同精度土壤图所建SWAT工程对4个模拟指标的最佳综合模拟效果。
1.4 模型的率定
在模型率定之前进行了参数的敏感性分析。对SWAT输入输出文件手册中列出的水文循环、营养物、泥沙和河道过程相关的103个参数(剔除了已有的土壤参数和SWAT-CUP中没有的参数)进行了敏感性分析,利用SWAT-CUP软件设置运行次数为1 000次。同时参考了文献[29]中用于径流和硝态氮率定所选取的38个参数,以及文献[26,27]中的参数敏感性分析结果和选定的率定参数,对本文中率定的参数进行了补充,最终选取了与流量、泥沙、总氮和总磷模拟过程关系密切的43个参数,见表3—6。对于模型的率定,采用SWAT-CUP软件中的SUFI-2算法进行自动率定,在调整参数过程中不对土壤参数和实测参数进行率定。参照(公式4)将4个因子的整体表现效果设置为目标函数,并对模拟效果进行综合分析。因此,率定的目的是达到流量、泥沙、总氮和总磷4个项目的综合效果最优,这样才能说明模型在流域的应用是最佳状态。Table 3
表3
表3选取的水文循环参数及其初始阈值
Table 3
| 参数 Parameter | 参数说明 Parameter description | 初始阈值 Initial threshold | |
|---|---|---|---|
| R_CN2.mgt | 水分条件Ⅱ时的初始SCS径流曲线数 Initial SCS runoff curve number for moisture condition II | -1 | 0.5 |
| V_ALPHA_BF.gw | 基流α因子 Baseflow alpha factor | 0 | 1 |
| V_RCHRG_DP.gw | 深层含水层的渗透系数 Deep aquifer percolation fraction | 0 | 1 |
| V_GW_REVAP.gw | 地下水的revap系数 Groundwater “revap” coefficient | 0.02 | 0.2 |
| V_GW_DELAY.gw | 地下水的时间延迟 Groundwater delay time | 0 | 500 |
| V_GWQMN.gw | 发生回归流的浅层含水层的水位阈值 Threshold depth of water in the shallow aquifer required for return flow to occur | 0 | 5000 |
| V_SHALLST.gw | 浅层含水层的初始水深 Initial depth of water in the shallow aquifer | 0 | 50000 |
| V_DEEPST.gw | 深层含水层的初始水深 Initial depth of water in the deep aquifer | 0 | 50000 |
| V_SLSUBBSN.hru | 平均坡长 Average slope length | 10 | 150 |
| V_OV_N.hru | 坡面漫流的曼宁系数n值 Manning’s “n” value for overland flow | 0.01 | 30 |
| V_ESCO.hru | 土壤蒸发补偿因子 Soil evaporation compensation factor | 0.01 | 1 |
| V_LAT_TTIME.hru | 侧向流的运动时间 Lateral flow travel time | 0 | 180 |
| V_EPCO.hru | 植物吸收补偿因子 Plant uptake compensation factor | 0 | 1 |
| V_HRU_SLP.hru | 平均比降 Average slope steepness | 0 | 1 |
| V_CH_N2.rte | 主河道的曼宁系数n值 Manning’s “n” value for the main channel | -0.01 | 0.3 |
| V_FFCB.bsn | 初始土壤蓄水量 Initial soil water storage | 0 | 1 |
| V_SURLAG.bsn | 地表径流滞后系数 Surface runoff lag coefficient | 0.05 | 24 |
新窗口打开|下载CSV
Table 4
表4
表4选取的营养物参数及其初始阈值
Table 4
| 参数 Parameter | 参数说明 Parameter description | 初始阈值 Initial threshold | |
|---|---|---|---|
| V_BIOMIX.mgt | 生物混合效率 Biological mixing efficiency | 0 | 1 |
| V_FRT_SURFACE.mgt | 表层10 mm土壤中的施肥量占施肥总量的分数 Fraction of fertilizer applied to top 10 mm of soil | 0 | 1 |
| V_FILTERW.mgt | 过滤带宽度 Width of edge-of-field filter strip | 0 | 100 |
| V_GWSOLP.gw | 向子流域河流输入的地下水中可溶性磷浓度 Concentration of soluble phosphorus in groundwater contribution to streamflow from subbasin | 0 | 1000 |
| V_ERORGN.hru | 泥沙运移中有机氮的富集比 Organic N enrichment ratio for loading with sediment | 0 | 5 |
| V_ERORGP.hru | 泥沙运移中有机磷的富集比 Phosphorus enrichment ratio for loading with sediment | 0 | 5 |
| V_CDN.bsn | 反硝化指数速率系数 Denitrification exponential rate coefficient | 0 | 3 |
| V_SDNCO.bsn | 发生反硝化作用的土壤含水量阈值 Denitrification threshold water content | 0 | 1 |
| V_RSDCO.bsn | 残留物的分解系数 Residue decomposition coefficient | 0.02 | 0.1 |
| V_PPERCO.bsn | 磷的渗流系数 Phosphorus percolation coefficient in soil layer | 10 | 17.5 |
| V_PHOSKD.bsn | 磷的土壤分配系数 Phosphorus soil partitioning coefficient | 100 | 200 |
| V_NPERCO.bsn | 硝酸盐的渗流系数 Nitrate percolation coefficient | 0 | 1 |
| V_BC1_BSN.bsn | NH3生物氧化的速率常数 Rate constant for biological oxidation of NH3 | 0.1 | 1 |
| V_BC2_BSN.bsn | 从NO2到NO3的生物氧化速率常数 Rate constant for biological oxidation NO2 to NO3 | 0.1 | 1 |
| V_BC3_BSN.bsn | 从有机氮到氨基的水解速率常数 Rate constant for hydrolysis of organic nitrogen to ammonia | 0.02 | 0.4 |
| V_BC4_BSN.bsn | 从有机磷到可溶性磷的腐化速率常数 Rate constant for decay of organic phosphorus to dissolved phosphorus | 0.01 | 0.7 |
新窗口打开|下载CSV
Table 5
表5
表5选取的泥沙参数及其初始阈值
Table 5
| 参数 Parameter | 参数说明 Parameter description | 初始阈值 Initial threshold | |
|---|---|---|---|
| R_USLE_C.plant.dat | USLE方程中的C因子的最小值 Minimum value of USLE C factor | -10 | 10 |
| V_USLE_P.mgt | USLE方程中的P因子 USLE equation support practice factor | 0 | 1 |
| V_LAT_SED.hru | 侧向流与地下径流中的泥沙含量 Sediment concentration in lateral and groundwater flow | 0 | 5000 |
| V_ADJ_PKR.bsn | 子流域(支流)泥沙演算的最大流速调节因子 Peak rate adjustment factor for sediment routing in the subbasin | 0.5 | 2 |
新窗口打开|下载CSV
Table 6
表6
表6选取的河道过程参数及其初始阈值
Table 6
| 参数 Parameter | 参数说明 Parameter description | 初始阈值 Initial threshold | |
|---|---|---|---|
| V_SPCON.bsn | 最大泥沙量的线性参数 Linear parameter for calculating the maximum amount of sediment | 0.0001 | 0.01 |
| V_SPEXP.bsn | 最大泥沙量的指数参数 Exponent parameter for calculating sediment restrained in channel sediment routing | 1 | 2 |
| V_CH_K2.rte | 主河道冲积物的有效渗透系数 Effective hydraulic conductivity in main channel alluvium | -0.01 | 500 |
| V_CH_COV1.rte | 河道侵蚀因子 Channel erodibility factor | -0.05 | 0.6 |
| V_CH_COV2.rte | 河道覆盖因子 Channel cover factor | -0.001 | 1 |
| V_ALPHA_BNK.rte | 河岸调蓄的基流α因子 Baseflow alpha factor for bank storage | 0 | 1 |
新窗口打开|下载CSV
选取SWAT-CUP中的通用评价指标相关系数R2和纳什系数NS进行模拟效果的评价。当相关系数R2≥0.6,且纳什系数NS≥0.5时,模型模拟结果是满意的[30]。R2和NS的计算方法如下所示:
式中,Qm,i为第i天的监测数据,Qs,i为第i天的模拟值,$\bar{Q}_{m}$为监测数据平均值,$\bar{Q}_{s}$为模拟值平均值。
如果有多个变量,则目标函数为:
w为权重(在本研究将泥沙的权重设为1.5,径流、总氮和总磷的权重设为1),j为模拟变量。
NS为纳什系数。如果有多个变量,则目标函数为:
率定过程中选取的率定参数及初始阈值如表3—6所示,其中R表示在参数调整中作相对初始值变化调整,V表示在参数调整过程中做绝对值变化调整(直接赋新值),率定的实测数据范围为2011年1月至2013年12月。
2 结果
2.1 不同精度土壤数据对HRU分配和模型参数的影响
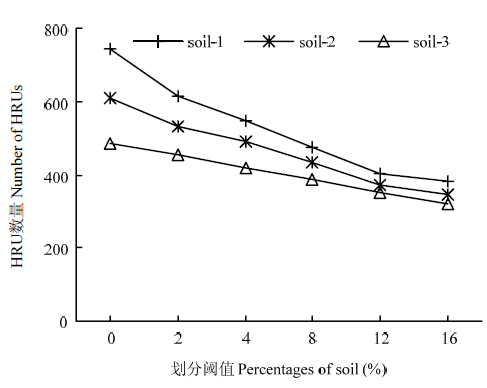
图3为3种不同精度的土壤图在不同的土壤阈值设定下生成HRU的数量。从图中可以看出,随着土壤划分阈值从0—16%逐渐增加,1﹕5万(soil-1)土壤数据的HRU划分数量从741减少到382个,1﹕50万(soil-2)土壤数据HRU的划分数量从611减少到347个,1﹕100万(soil-3)土壤数据HRU的划分数量从487减少到320个。由此可知,不同土壤图划分的HRU数量在阈值较小时存在较大的差别,随着土壤阈值逐渐增加,3种土壤数据所生成的HRU个数均逐渐减少,且不同土壤数据之间的差别也逐渐减小。此外,随着精度的降低,HRU随阈值增加而减少的趋势逐渐变缓,这说明HRU的划分对高分辨率的土壤数据影响更大。土壤数据引起HRU划分的差异,会进一步影响SWAT模型对流域水文过程及污染物迁移过程的模拟。图3
 新窗口打开|下载原图ZIP|生成PPT
图3不同土壤数据的阈值设置对HRU划分的影响
Fig. 3Effects of threshold settings on HRU numbers based on the difference soil datasets
表7统计了3种土壤数据下所提取的几个重要模型参数。不同精度的土壤数据下所得到的CN2、SOL_ZMX和SOL_Z、SOL_BD、SOL_AWC、SOL_K、USLE_K都有所差异。3种土壤图所得到的CN2分别为77.93、77.43和66.23;得到的SOL_ZMX分别为722.73、879.93和526.07 mm;以第一层土壤为例得到的SOL_Z分别为211.24、160.66和201.79 mm;得到的SOL_BD分别为1.19、1.15和1.27 g·cm-3;得到的SOL_AWC分别为0.16、0.36和0.18 mm·mm-1;得到的SOL_K分别为21.61、42.56和21.18 mm·h-1;得到的USLE_K分别为0.27、0.29和0.24。由此可以看出,对于参数CN2、SOL_ZMX、SOL_BD和USLE_K,soil-2与soil-1的差异更小;而对于参数SOL_Z、SOL_AWC和SOL_K,soil-3与soil-1的差异更小。
Table 7
表7
表7不同土壤数据下的模型参数
Table 7
| 土壤数据 Soil data | SCS径流曲线数CN2 | 最大根系深度 SOL_ZMX (mm) | 土层埋深 SOL_Z (mm) | 湿容重 SOL_BD (g·cm-3) | 有效含水量SOL_AWC (mm·mm-1) | 饱和渗透系数SOL_K (mm·h-1) | 土壤侵蚀K因子USLE_K |
|---|---|---|---|---|---|---|---|
| soil-1 | 72.93 | 722.73 | 211.24 | 1.19 | 0.16 | 21.61 | 0.27 |
| soil-2 | 77.43 | 879.93 | 160.66 | 1.15 | 0.36 | 42.56 | 0.29 |
| soil-3 | 66.23 | 526.07 | 201.79 | 1.27 | 0.18 | 21.18 | 0.24 |
新窗口打开|下载CSV
2.2 不同精度土壤数据对模型模拟效果的影响
利用SWAT-CUP软件分别进行参数的调整和模拟效果的分析,表8为基于3种不同土壤图的模型在率定前后模型表现效果的评价结果。从表中可以看出,在校准之前,泥沙的模拟效果最好(泥沙的NS值较流量、总氮和总磷高),流量次之,而总氮和总磷的模拟效果最差,并且与实测值相差很大,不可以进行使用。因此在默认参数下,3种土壤数据所建立的模型对于总氮、总磷的模拟是完全不可信的(NS远远小于0);经过校准之后模型的表现效果(各评价指标)有显著的提高,这说明对于模型参数的校准十分必要,模型参数的校准可以大幅度提高模型在流域的模拟效果。通过对模型校准后各评价指标的分析,发现经过校准后径流的模拟效果最好,而对于泥沙的模拟效果均不太理想(NS<0.5)。Table 8
表8
表8校准前后模型的表现效果
Table 8
| 土壤数据 Soil data | 项目 Item | 校准后 After calibration | 校准前 Before calibration | ||
|---|---|---|---|---|---|
| R2 | NS | R2 | NS | ||
| soil-1 | 流量Flow | 0.81 | 0.68 | 0.84 | -5.29 |
| 泥沙 Sediment | 0.44 | 0.43 | 0.49 | 0.31 | |
| 总氮Total nitrogen | 0.58 | 0.57 | 0.50 | -605.73 | |
| 总磷Total phosphorus | 0.53 | 0.53 | 0.30 | -5007.4 | |
| soil-2 | 流量Flow | 0.86 | 0.79 | 0.77 | -6.86 |
| 泥沙 Sediment | 0.46 | 0.41 | 0.50 | 0.1 | |
| 总氮Total nitrogen | 0.71 | 0.59 | 0.53 | -710.97 | |
| 总磷Total phosphorus | 0.75 | 0.75 | 0.31 | -1539.57 | |
| soil-3 | 流量Flow | 0.75 | 0.64 | 0.86 | -5.27 |
| 泥沙 Sediment | 0.43 | 0.38 | 0.45 | 0.28 | |
| 总氮Total nitrogen | 0.85 | 0.69 | 0.49 | -1097.61 | |
| 总磷Total phosphorus | 0.63 | 0.62 | 0.29 | -5717.73 | |
新窗口打开|下载CSV
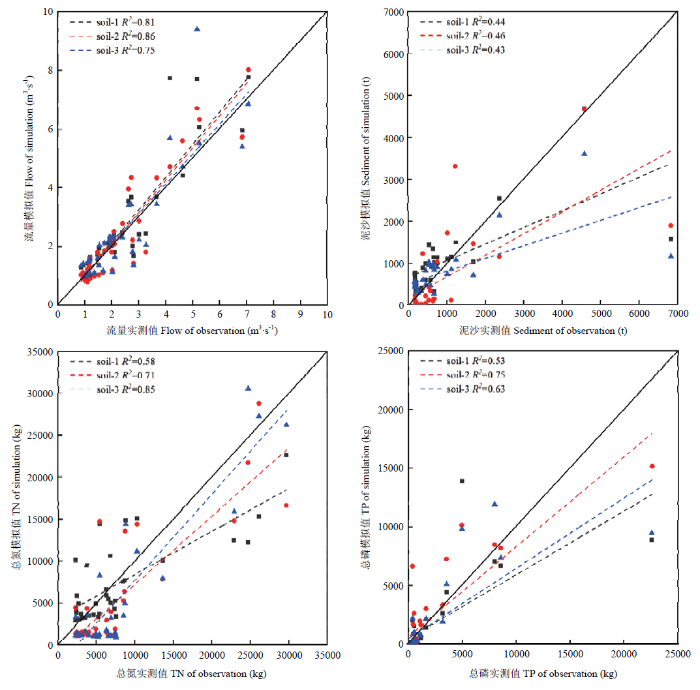
基于3种土壤图进行模型的建立和参数的率定后,模型的表现效果见图4。从中可以看出对于流量的模拟存在普遍的高估,R2分别为0.81、0.86和0.75,模拟效果较为接近;模拟的泥沙产量在总量较低时存在高估,在总量较高时出现低估;对于总氮的模拟,基于1﹕50万和1﹕100万的土壤图存在低估现象,而基于1﹕5万的土壤图在总量较低时会出现高估现象;对于总磷的模拟,3种土壤数据所建立的SWAT工程在模拟过程中存在普遍的低估现象。因此,不同精度的土壤数据对于不同指标的模拟效果存在差异,并非精度越高模拟效果必然越好。为了评价3种土壤图对4个指标的综合表现效果,将3个SWAT工程模拟的4个指标(流量、泥沙、总氮和总磷)的R2和NS进行平均,得到基于1﹕5万、1﹕50万和1﹕100万土壤图模拟结果的平均R2分别为0.59、0.70和0.67,平均NS分别为0.55、0.64和0.58。因此,从模拟的整体效果来说,基于1﹕50万土壤图的模拟整体效果最好,其次是基于1﹕100万土壤图的模拟,而基于1﹕5万土壤图的模拟效果反而最差。因此,对于流域出口流量、泥沙、总氮和总磷模拟来说,如果考虑成本和模拟效果,在建立模型的时候并不需要追求过高精度的土壤数据。
图4
 新窗口打开|下载原图ZIP|生成PPT
图43种精度土壤数据在进行模型校准后的模拟效果
Fig. 4Simulation performance for the three types of soil data after model calibration
2.3 不同精度土壤数据的空间尺度效应
图5显示了凤羽河子流域的划分结果和水系汇流情况,流域出口位于4号子流域。基于子流域面积和流域的汇流情况进行了不同精度土壤数据的空间尺度效应分析。图5
 新窗口打开|下载原图ZIP|生成PPT
图5子流域划分图
Fig. 5Subbasin map
以1﹕5万的土壤数据为标准,以第一层土壤层为例分析了基于不同土壤图获得的模型参数随子流域面积的变化情况,如图6所示。从图中可以看出,当子流域面积较小的时候,不同土壤数据计算得到的模型参数之间的差异较大,子流域间参数差异存在较大的变幅;随着子流域面积的增大,基于不同土壤数据的子流域参数的差别逐渐趋于稳定。说明随着面积的增大,不同土壤数据得到的土壤平均属性趋于一致,大的子流域面积可以在一定程度上综合掉土壤参数的空间异质性。
图6
 新窗口打开|下载原图ZIP|生成PPT
图6基于不同土壤图获得的土壤参数随子流域面积的变化
Fig. 6Differences between soil parameters from different soil data across varying subbasin areas
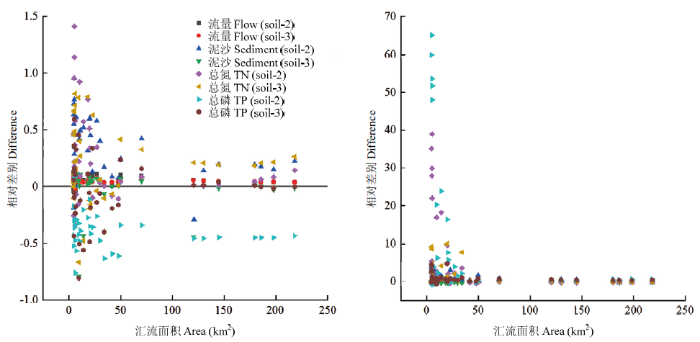
以1﹕5万(soil-1)的土壤数据为标准,对基于不同土壤图的模拟结果的差异随汇流面积的变化进行分析,如图7所示。图7显示了在进行模型校准前后soil-2和soil-3与soil-1结果的差异。从图中可以看出,在校准之前,当子流域面积较小的时候,不同精度的土壤数据模拟结果的差异在不同子流域之间差别较大,随着子流域面积的增大,基于不同土壤数据模拟结果的差别逐渐变小,并且逐渐趋于稳定;校准后,soil-2和soil-3的模拟结果与soil-1相比,在汇流面积较小时差异很大,在流域出口差异收敛于0,也就是说对于不同精度的土壤数据来说,模型的校准增加了较小汇流面积时的模拟差异,但随着汇流面积的增加,差异迅速减小并趋于稳定,收敛于0。这说明校准过程会在较小的汇流面积上产生较大的影响。
图7
 新窗口打开|下载原图ZIP|生成PPT
图7在进行模型校验前(左)后(右)基于不同土壤数据模拟结果的差异与汇流面积的关系
Fig. 7Differences in simulation results based on different soil data across varying subbasin areas
3 讨论
3.1 土壤数据精度对模拟的影响与模拟指标有关
本研究利用1﹕5万、1﹕50万和1﹕100万的土壤数据在面积为217 km2的小流域进行建模,发现3种土壤数据对流量模拟的差异小于对水质的模拟。土壤数据作为SWAT模型中重要的输入信息之一,具有很强的空间变异性,通过影响流域的水文过程而影响模型的模拟[16]。不同分辨率的土壤数据会对SWAT模型模拟的土壤参数产生影响,其中含水量差异显著,进而显著影响水文响应单元的划分,但对于土壤蒸发的计算没有显著影响[18]。而已有研究也表明不同比例尺的土壤数据对SWAT模型模拟的影响与模拟项目有关。例如许多****探讨了美国比例尺为1﹕12000—63360的县级SSURGO土壤数据和1﹕25万—50万比例尺的州级STATSGO土壤数据对流域水文模型的流量与水质的影响。在流量预测的影响方面,模型校准前后存在差异,校准前应用STATSGO数据进行流量预测效果相对高于SSURGO数据;在校准后,SSURGO土壤数据整体上提供了更好的流量预测结果[23],使用SSURGO导致传输损失较少,较高的地表径流归因于较高的土壤数据分辨率[22,23]。然而,在更大尺度流域应用不同比例尺土壤数据时,不同比例尺土壤图之间对于流量的预测差异不大[17],甚至低分辨率的数据效果反而略好于高分辨率[18]。与之相反,对SSURGO和STATSGO数据的研究表明,土壤数据分辨率的不同对营养物负荷影响比较显著[31]。与SSURGO数据相比,1﹕25万和1﹕50万STATSGO土壤图显著降低了月平均氮负荷[32]。3.2 不同土壤数据的模拟效果存在尺度效应
不同土壤数据对SWAT模型的模拟效果与流域尺度关系密切,不同土壤数据对模型模拟效果的影响存在时空尺度效应[33]。在本研究中,随着汇流面积的增大,基于3种土壤数据提取的模型参数和模拟结果的差异逐渐减小,说明不同土壤数据参数在较小的空间尺度差异更大,进而对模型产生影响。主要原因在于模型在地表径流计算过程中,进行了土壤水文组的划分,概括了土壤信息,降低了土壤信息的精度;同时,在小的尺度上土壤的异质性影响较为严重,而在大的空间尺度上土壤属性的均值较为一致[20]。已有研究表明对于大于10 km2的子流域,采用10 m的SoLIM模型生成的土壤数据和1﹕24 000 SSURGO土壤数据对于流量的模拟没有显著差异,在较大的尺度上,使用精度低的土壤数据同样可以达到理想的模拟效果[20]。此外,空间尺度对流域演算过程的影响呈线性相关关系,最小模拟单元级别下的径流模拟差异非常大,但差异随着模拟单元的空间尺度的增加而逐渐降低[19,34]。虽然不同模型对土壤数据的敏感性不同,但模拟的差别也会随流域面积的增大而降低[35]。这说明不同土壤数据对于模型提取的土壤参数存在空间尺度效应,进而对模型的模拟产生影响。3.3 流域模型模拟效果受其他因素影响
通过本文的研究发现,SWAT模型的模拟效果在较大尺度上受土壤数据影响不明显,可能是由于流域模拟效果受CN2[14]、地貌和气候的综合影响更为明显,这些因素会在一定程度上掩盖土壤数据所带来的不确定性。另外,模型率定调整参数的过程以同一套实测数据为率定目标不可避免的掩盖了土壤数据的不确定性对模型模拟过程的影响。本文研究结果也显示出3个模型表现效果的差异在率定后出现了明显的变化。也有研究表明,相较于土壤图分辨率,土壤数据的来源对于模型输出的影响更大[17]。因此,土壤图的质量和适用性不仅取决于比例尺,还取决于制图方式[36]。不同制图方法会造成地表产流和产沙模式存在高度的空间变异性[37],WAHREN等将传统的土壤图和SoLIM生成的数字土壤图应用到SWAT模型中,在模拟出口日流量时,尽管均取得满意的模拟效果,但SoLIM派生的土壤数据对旱季的第一次峰值流量模拟拟合程度更好。从传统土壤数据与数字土壤制图数据在水文模型中的应用对比来看,更详细的反映土壤属性空间变异性的制图方法(SoLIM)对峰值径流事件的模拟效果更好[38,39]。此外,土壤制图采用的插值方法也会影响土壤图精度[36]。ZIADAT等[40]的研究对比了传统插值方法和SLEEP(soil-landscape estimation and evaluation program)方法,结果表明相比于传统的反距离加权和克里金插值方法,虽然模型对SLEEP方法使用的土壤样点数量并不敏感,但SLEEP方法制作的土壤数据在环境模型应用中的效果更好。因此,提高土壤制图方法的精确性也是减少SWAT模型模拟不确定性的重要途径。从已有研究及本文的研究结果来看,在应用SWAT模型进行流域模拟时,土壤数据分辨率与模型的模拟结果并无明显的因果关系,提高土壤数据分辨率不一定会得到更好的模拟效果。同时,土壤数据对SWAT模型的影响存在着空间尺度效应,因此,在实际模型模拟中应根据流域大小和模拟指标选择土壤数据的精度。此外,土壤图的制作方法也是提高模型模拟精度的关键。
4 结论
(1)不同精度的土壤数据对HRU的划分结果有明显影响,并且HRU划分数量的敏感性与划分阈值及土壤详细程度有关。此外,不同精度的土壤数据会明显影响模型参数,但各参数的大小与土壤图的详细程度没有对应关系。(2)模型参数的校准可以大幅度改善模型的模拟效果,不同的土壤数据对于不同模拟指标的模拟效果存在差异,但并非土壤数据越精细模拟效果越好。因此,在建立模型的时候,需要根据模拟目标具体而定,并不必要追求高精度的土壤数据。(3)随着子流域面积的增大,土壤的平均属性趋于一致,大的子流域面积在一定程度上综合了土壤参数的空间异质性;随着汇流面积的增大,土壤差异所带来的模拟结果的差异逐渐趋于稳定,校准过程会在较小的汇流面积上产生较大的影响。参考文献 原文顺序
文献年度倒序
文中引用次数倒序
被引期刊影响因子
[本文引用: 1]
[本文引用: 1]
[本文引用: 1]
[本文引用: 1]
[本文引用: 1]
URLPMID:24422427 [本文引用: 1]
[本文引用: 1]
[本文引用: 2]
[本文引用: 2]
[本文引用: 1]
[本文引用: 1]
[本文引用: 1]
[本文引用: 1]
[本文引用: 1]
[本文引用: 1]
[本文引用: 1]
[本文引用: 1]
[本文引用: 1]
DOI:10.1016/j.scitotenv.2018.06.048URLPMID:29894879 [本文引用: 1]

Despite the significant impacts of agricultural land on nonpoint source (NPS) nitrogen (N) pollution, little is known about the influence of the distribution and composition of different agricultural land uses on N export at the watershed scale. We used the Soil and Water Assessment Tool (SWAT) to quantify how agricultural distribution (i.e., the spatial distributions of agricultural land uses) and composition (i.e., the relative percentages of different types of agricultural land uses) influenced N export from a Chinese subtropical watershed, accounting for aquatic N retention by river networks. Nitrogen sources displayed high spatial variability, with 40.7% of the total N (TN) export from the watershed as a whole derived from several subwatersheds that accounted for only 18% of the watershed area. These subwatersheds were all located close to the watershed mouth. Agricultural composition strongly affected inputs to the river network. The percentages of dry agricultural land and rice paddy fields, and the number of cattle together explained 70.5% of the variability of the TN input to the river network among different subwatersheds. Total N loading to the river network was positively correlated with the percentage of dry land in total land areas and the number of cattle within subwatersheds, but negatively with the proportion of paddy fields. Distribution of agricultural land uses also affected N export at the mouth of the watershed. Moreover, N retention in the river network increased with increasing N transport distance from source subwatershed to the watershed mouth. Results provide important information to support improved planning of agricultural land uses at the watershed scale that reduces NPS nutrient pollution.
[D].
[本文引用: 1]
[D].
[本文引用: 1]
[本文引用: 2]
[本文引用: 2]
[本文引用: 1]
[本文引用: 2]
DOI:10.1016/j.scitotenv.2009.10.027URLPMID:19896162 [本文引用: 3]
In the present work, the concentrations of the organic pollutants nonylphenol (NP) and nonylphenol mono- and diethoxylates (NP1EO and NP2EO, respectively) in primary, secondary, mixed, aerobically-digested, anaerobically-digested, dehydrated, compost and lagoon sludge samples from different sludge treatments have been evaluated. Toxicological risk assessment of these compounds in sludge and sludge-amended soil has also been reported. NP, NP1EO and NP2EO were monitored in sludge samples obtained from treatment plants located in Andalusia (south of Spain) based on anaerobic treatments (11 anaerobic-digestion wastewater treatment plants and 3 anaerobic wastewater stabilization ponds) or on aerobic treatments (3 aerobic-digestion wastewater treatment plants, 1 dehydration treatment plant and 2 composting plants). The sum of NP, NP1EO and NP2EO (NPE) concentrations has been evaluated in relation to the limit value of 50 mg/kg set by the European Union Sludge Directive draft published in April 2000 (Working Document on Sludge). In most of the samples, NP was present at higher concentration levels (mean value 88.0 mg/kg dm) than NP1EO (mean value 33.8 mg/kg dm) and NP2EO (mean value 14.0 mg/kg dm). The most contaminated samples were compost, anaerobically-digested sludge, lagoon sludge and aerobically-digested sludge samples, which contained NPE concentrations in the ranges 44-962 mg/kg dm, 8-669 mg/kg dm, 27-319 mg/kg dm and 61-282 mg/kg dm, respectively. Risk quotients, expressed as the ratios between environmental concentrations and the predicted no-effect concentrations, were higher than 1 for NP, NP1EO and NP2EO in the 99%, 92% and 36% of the studied samples, respectively; and higher than 1 in the 86%, 6% and 2%, respectively, after sludge application to soil, leading to a significant ecotoxicological risk mainly due to the presence of NP.
[本文引用: 3]
[本文引用: 3]
[本文引用: 2]
DOI:10.11820/dlkxjz.2011.01.010URL [本文引用: 3]
流域水文模拟对输入数据空间详细程度的要求受流域面积大小的影响,而流域面积影响作用的定量描述有助于模拟时的数据选取。本文以美国Brewery Creek 流域(约19.5 km2)为例,在逐级连续的汇流面积上,分析了SWAT 模型基于1∶2.4 万的SSURGO和10m分辨率的SoLIM 土壤数据模拟的径流量的差别随汇流面积的变化。结果显示:汇流面积较小时,基于不同土壤图的模拟径流一致性较差;随着汇流面积的增大,模拟径流的差别逐渐减小并趋于稳定,在汇流面积大于约10 km2时,差别变得相对不明显,不同土壤数据的模拟径流相当。根据实验结果,流域径流模拟对数据的要求受模拟面积的潜在影响,当流域面积大于一定值时,较粗分辨率的输入数据同样可能取得较好的模拟效果。研究度量了面积对模型响应的潜在影响作用,为中小流域水文模拟时土壤数据的选取提供了初步参考。
[本文引用: 1]
DOI:10.1016/j.jenvman.2007.03.016URLPMID:17475392 [本文引用: 2]
The prediction accuracy of agricultural nonpoint source pollution models such as Soil and Water Assessment Tool (SWAT) depends on how well model input spatial parameters describe the characteristics of the watershed. The objective of this study was to assess the effects of different soil data resolutions on stream flow, sediment and nutrient predictions when used as input for SWAT. SWAT model predictions were compared for the two US Department of Agriculture soil databases with different resolution, namely the State Soil Geographic database (STATSGO) and the Soil Survey Geographic database (SSURGO). Same number of sub-basins was used in the watershed delineation. However, the number of HRUs generated when STATSGO and SSURGO soil data were used is 261 and 1301, respectively. SSURGO, with the highest spatial resolution, has 51 unique soil types in the watershed distributed in 1301 HRUs, while STATSGO has only three distributed in 261 HRUS. As a result of low resolution STATSGO assigns a single classification to areas that may have different soil types if SSURGO were used. SSURGO included Hydrologic Response Units (HRUs) with soil types that were generalized to one soil group in STATSGO. The difference in the number and size of HRUs also has an effect on sediment yield parameters (slope and slope length). Thus, as a result of the discrepancies in soil type and size of HRUs stream flow predicted was higher when SSURGO was used compared to STATSGO. SSURGO predicted less stream loading than STATSGO in terms of sediment and sediment-attached nutrients components, and vice versa for dissolved nutrients. When compared to mean daily measured flow, STATSGO performed better relative to SSURGO before calibration. SSURGO provided better results after calibration as evaluated by R(2) value (0.74 compared to 0.61 for STATSGO) and the Nash-Sutcliffe coefficient of Efficiency (NSE) values (0.70 and 0.61 for SSURGO and STATSGO, respectively) although both are in the same satisfactory range. Modelers need to weigh the benefits before selecting the type of data resolution they are going to use depending on the watershed size and level of accuracy required because more effort is required to prepare and calibrate the model when a fine resolution soil data is used.
[本文引用: 3]
DOI:10.1021/es0200903URL [本文引用: 1]
DOI:10.1021/es0200903URL [本文引用: 1]
[本文引用: 2]
[本文引用: 2]
[D].
[本文引用: 5]
[D].
[本文引用: 5]
[D].
[本文引用: 3]
[D].
[本文引用: 3]
[本文引用: 1]
[本文引用: 1]
[本文引用: 1]
DOI:10.13031/2013.23153URL [本文引用: 1]
DOI:10.4236/jwarp.2013.53027URL [本文引用: 1]
DOI:10.1016/j.jhydrol.2005.02.017URL [本文引用: 1]
[本文引用: 1]
DOI:10.1002/hyp.v26.9URL [本文引用: 1]
URL [本文引用: 1]
Effects of different soil data resolutions on distributed hydrological modeling and total water yield were investigated using a modeling approach.The semi-distributed SWAT(Soil and Water Assessment Tool) model and the fully distributed WetSpa(Water and Energy Transfer between Soil,Plant and Atmosphere) Extension were used in this study.Both the US SSURGO(Soil Survey Geographic) soil data and the detailed SoLIM(Soil-land Inference Model) soil data were utilized in the modeling investigation.Results show that different soil data resolutions will lead to a large discrepancy in modeling water yield at simulation points distributed over a watershed.However,the difference in simulation of total water yield decreases with increasing the area of watersheds.Based on the modeling experiment,it is recommended that detailed spatial data will be required where the simulation primarily focuses on the spatial distribution of water fluxes,while the data condition could be relaxed for the simulation of total water yield especially for large-sized watersheds.
DOI:10.18306/dlkxjz.2018.01.008URL [本文引用: 2]
The spatial distribution of soil reflects its formation and development. Digital soil mapping is a new and efficient technique to represent the spatial distribution of soil, which has experienced a rapid development over the last three decades. The theoretical bases are the soil forming factor theory and the first law of geography. Researchers have done significant work on the generation of environmental covariates, soil sampling methods, mapping methods, and production and evaluation of soil maps. The application cases are from small areas to big regions, even at the global scale. Future directions for digital soil mapping include: new techniques for depicting environmental covariates, especially for expressing human activities; efficient use of new data and legacy data; the reconciling of pedometric knowledge and mathematic models; and new computation ways supporting the use of big data.
[本文引用: 1]
URL [本文引用: 1]
As an important component of input data, soil information directly impacts the accuracy of the simulation of hydrologic model. Sensitivity of SWAT model to detailed soil information was investigated through comparison of the simulated stream flow produced by using SSURGO and SoLIM as different soil input data. A case study was conducted in Brewery Creek, a 19.5km2 area catchment in Dane County, Wisconsin. The simulation results before and after model calibration both indicate that there is only slight difference between the simulated streamflow. This study reveals the weak sensitivity of SWAT model to detailed soil information in the hydrological modeling of a small watershed. The main reason for lack of insignificant difference is that soil information was highly aggregated in the model and that the use of Curve Number as means for representing soil variability in the model also muted the impact of detailed spatial information.
DOI:10.1016/j.geoderma.2015.08.023URL [本文引用: 1]
[本文引用: 1]
