 ,, 卢峰,辽宁省农业科学院高粱研究所,沈阳 110161
Genetic Analysis on Growth Period and Plant Height Traits of Early-maturing Dwarf Sorghum Male-Sterile Line P03A
DUAN YouHou,, LU Feng,Sorghum Research Institute, Liaoning Academy of Agricultural Sciences, Shenyang 110161通讯作者:
责任编辑: 李莉
收稿日期:2019-07-31接受日期:2019-10-24网络出版日期:2020-07-16
| 基金资助: |
Received:2019-07-31Accepted:2019-10-24Online:2020-07-16
作者简介 About authors
段有厚,E-mail:

摘要
关键词:
Abstract
Keywords:
PDF (467KB)元数据多维度评价相关文章导出EndNote|Ris|Bibtex收藏本文
本文引用格式
段有厚, 卢峰. 早熟矮秆高粱不育系P03A生育期和株高性状的遗传分析[J]. 中国农业科学, 2020, 53(14): 2828-2839 doi:10.3864/j.issn.0578-1752.2020.14.007
DUAN YouHou, LU Feng.
0 引言
【研究意义】中国高粱新品种选育较长时间内多以高秆大穗型为主,株高普遍在180—220 cm,耐密性差,不抗倒伏,难以适应目前规模化、机械化生产,制约了中国高粱产业机械化规模化的进一步发展。因此,选育适于机械化栽培矮秆高粱亲本系及杂交种成为促进高粱产业发展的关键。早熟矮秆不育系的选育是组配早熟矮秆杂交种的关键,而研究高粱早熟矮秆性状遗传规律对早熟矮秆不育系的选育具有重要的指导意义。【前人研究进展】作物的农艺经济性状多属于数量性状,早期人们认为数量性状均由微效多基因控制,后来研究表明数量性状也可能由主基因和多基因共同作用。目前,国内外对高粱农艺性状遗传分析多基于杂交F1配合力分析[1,2,3,4,5,6,7],这些研究将控制某一性状的多基因作为整体估计总体效应。盖钧镒等[8]、ZHANG等[9]、WANG等[10]提出的主基因与多基因的遗传分析方法,把控制数量性状效应大的基因作为主基因,效应小的基因作为多基因,不仅可以鉴别主基因,而且可以检测多基因效应,并估计相应的遗传参数,更精确有效地分析遗传效应。该方法在小麦[11]、棉花[12]、水稻[13]、玉米[14]、大豆[15]等主要作物中已应用。利用主基因与多基因的遗传分析方法在高粱锤度[16,17]、光合作用[18,19]、株型[20]、穗型[21,22]、叶角[23]等数量性状遗传方面已有研究。【本研究切入点】与大作物相比,中国高粱遗传研究相对滞后,遗传改良程度相对较低。早熟矮秆耐密高粱雄性不育系P03A,是在广泛引进、收集各类资源基础上,应用高粱保持系群体改良技术,经多年选育而成的早熟矮秆高粱不育系。以其为母本所选育高粱新品种辽杂37、辽夏粱1号和辽杂54已在生产上推广应用。这些杂交种具有生育期短、植株矮、株型清秀、耐密植和适应性强等特性。但利用主基因与多基因的遗传分析方法对早熟矮秆高粱的生育期与株高的研究仍鲜见报道。【拟解决的关键问题】本研究通过配合力分析,筛选一般配合力差异大的亲本,构建组合及分离群体,对早熟矮秆P03A生育期和株高的遗传效应和遗传力进行分析。明确早熟矮秆不育系P03A生育期和株高遗传效应问题及遗传规律,为不育系P03A在高粱早熟矮秆育种中的利用及早熟矮秆性状遗传改良提供理论依据。1 材料与方法
1.1 试验材料
试验材料为辽宁省农业科学院高粱研究所自主选育的农艺性状稳定高粱试材,包括5份早熟矮秆雄性不育系:P03A、L025A、L080A、L081和P02A;6份中晚熟中高秆恢复系:L242、L2381、LNK1、L280、L237和L298。2016年在辽宁省农业科学院试验田(沈阳)以P03A、L025A、L080A、L081和P02A为母本,分别与恢复系L242、L2381、LNK1、L280、L237和L298采用不完全双列杂交(North Carolina II–incomplete diallel cross,NCII)方法进行杂交组配,获得F1杂交种子,并于2016年冬天在海南加代种植,套袋自交获得F2种子。1.2 试验设计
2017年,在辽宁省农业科学院试验田(沈阳)种植试验亲本及其F1,将组配成的30个杂交组合按照随机区组设计种植,3次重复。经过2017年筛选分析,于2018年种植P03A和L237亲本及其杂交组合后代F1和F2群体。亲本和F1每小区种植6行,F2种植20行,行长5 m,行距0.6 m。密度为13.5万株/hm2。试验于辽宁省农业科学院试验田(沈阳)进行,田间管理同大田生产。该地区气候类型为温带半湿润大陆性气候,雨热同季,光照充足,春季风大多干旱。常年平均气温为7.2℃,全年无霜期145—160 d。试验土壤类型为壤土,前茬为大豆。0—20 cm耕层土壤有机质含量为18.63 g·kg-1、全氮0.07 g·kg-1、速效钾0.12 g·kg-1、有效磷0.03 g·kg-1,pH6.2。1.3 性状测定与统计分析
统计出苗期、成熟期,并于成熟期测量株高,统计标准参照中国高粱区域试验:出苗期指幼苗出土“露锥”(即子叶展开前)达75%的日期;成熟期指75%以上植株的穗背阴面下部第一枝梗籽粒达蜡状硬度的日期;生育期指从出苗期到成熟期的日数。每个亲本各测量10株,F1测量10株,F2测量385株。采用EXCEL和DPS及植物数量性状混合遗传模型主基因+多基因多世代联合分析软件进行模型分析和遗传参数估计[8]。利用ZHANG等[9]联合世代主基因多基因混合遗传模型,对P1、P2、F1、F2高粱4个世代的生育期和株高进行联合世代遗传模型分析,通过比较0、1和2对主基因的C(无主基因)、A(1对主基因)、D(1对主基因+多基因)、B(2对主基因)、E(2对主基因+多基因)共24个遗传模型的AIC(Akaike’s Information-Criterion)值以选最优模型,并且进行遗传模型的适合性检验(均匀性检验、Smirnov检验和Kolmogorov检验),共有5个统计量:U21、U22、U23(均匀性检验)、nW2(Smirnov检验)和Dn(Kolmogorov检验)。在选择遗传模型时,综合考虑极大对数似然函数值、AIC值和适合性检验,并根据模型估计主基因和多基因的效应值及其方差等遗传参数。计算公式为:表型方差=家系平均数的方差;主基因方差=表型方差–分布方差(σ2mg=σ2p–σ2);多基因方差=表型方差–主基因方差–平均数的误差方差(σ2pg=σ2p–σ2mg–σ2e)=分布方差–平均数的误差方差(σ2pg=σ2–σ2e);主基因遗传率=主基因方差/表型方差(h2mg=σ2mg/σ2p);多基因遗传率=多基因方差/表型方差(h2pg=σ2pg/σ2p)。遗传参数包括一阶参数和二阶参数两类。根据入选模型的全部一阶、二阶分布参数极大似然估计值,估计出一阶遗传参数,即主基因的加性效应值,显性效应值和上位性效应值。通过对群体表型方差的部分估计二阶遗传参数,即性状主基因遗传力及多基因遗传力[8,9]。
2 结果
2.1 生育期和株高性状的配合力方差分析
由表1可见,生育期和株高2个性状组合间差异均达极显著水平,说明各组合间存在真实的遗传差异。母本中生育期和株高性状的配合力方差均达到显著水平,父本中生育期和株高2个性状的配合力方差均达极显著水平,母本×父本的2个性状特殊配合力方差也达极显著水平,说明母本间配合力差异显著,母本间在配合力上差异小,父本间配合力极显著,父本间在配合力上差异大。据此可进一步分析其一般配合力和特殊配合力大小。Table 1
表1
表1各性状的方差和配合力方差分析
Table 1
| 变异来源 Source of variation | 自由度 Degree of freedom | 株高 PH | 生育期 GP |
|---|---|---|---|
| 区组Block | 2 | 0.98 | 0.66 |
| 组合Combination | 29 | 29.55** | 49.34** |
| 母本Female | 4 | 17.42* | 4.99* |
| 父本Male | 5 | 42.16** | 7.01** |
| 母本×父本 Female×male | 20 | 5.99** | 6.72** |
| 误差Error | 58 | 7.30 | 0.39 |
新窗口打开|下载CSV
2.2 各亲本生育期和株高特性的一般配合力比较
通过比较各亲本生育期和株高的一般配合力(表2),5个早熟矮秆不育系,株高和生育期一般配合力效应值趋向负向,P03A的株高与生育期一般配合力分别为-5.82和-2.61,小于其他4个不育系,P03A在株高和生育期的一般配合力效应值均为负向最大,说明其具有较好地降低株高和缩短生育期的作用。以其为母本的杂交组合,可降低F1的株高并缩短其生育期。6个父本的株高和生育期一般配合力效应值趋向正向,其中,L237株高和生育期的一般配合力效应值均为正向最大,与P03A的加性效应恰恰相反,以L237组配的F1生育期会延长,株高升高。Table 2
表2
表2各亲本的一般配合力的效应值
Table 2
| 亲本Parent | 株高PH | 生育期GP |
|---|---|---|
| P03A | -5.82 | -2.61 |
| L025A | 1.09 | 0.33 |
| L080A | -0.07 | -0.75 |
| L081A | 2.39 | -0.71 |
| P02A | -2.29 | -1.70 |
| L242 | 5.92 | 3.40 |
| L2381 | -1.09 | 0.33 |
| LNK1 | -3.03 | -0.75 |
| L280 | 0.47 | 0.71 |
| L237 | 6.14 | 5.70 |
| L298 | 2.66 | 2.42 |
新窗口打开|下载CSV
2.3 组合的生育期和株高特性特殊配合力分析
通过30个组合的特殊配合力分析得出P03A/L237在生育期和株高性状上均表现出最小的特殊配合力(表3)。由此可知,P03A/L237通过相互作用表现出了较短的生育期和较矮的株高,与一般配合力较强的L237杂交组配,P03A表现出了缩短生育期和降低株高的能力。Table 3
表3
表3特殊配合力极值及其组合名称
Table 3
| 性状Traits | 极大值Maximum value | 组合Combination | 极小值Minimum value | 组合Combination |
|---|---|---|---|---|
| 株高PH | 7.87 | L025A/2381 | 0.06 | P03A/L237 |
| 生育期GP | 5.49 | L081A/NK1 | -1.12 | P03A/L237 |
新窗口打开|下载CSV
2.4 P03A为母本组配的F1组合生育期及株高杂种优势分析
由表4可知,与其他4个不育系相比,P03A与6个恢复系组配不同F1组合生育期和株高的超高亲值均是最小,即,另4个不育系与6个恢复系组配的F1生育期更长,株高更高,进一步验证了P03A具有缩短生育期和降低株高的遗传力。通过对以P03A为母本的6个杂交组合进行杂种优势分析(表5),各组合F1的生育期均比中亲值(midparent,MP)早,最少早0.5 d,最多早4 d。结果表明,由P03A组配的杂种一代生育期的表现倾向于早熟亲本,不育系P03A的生育期早熟表现为部分显性,而且其早熟显性程度受到不同遗传背景的恢复系的影响。Table 4
表4
表4不同不育系与恢复系组配F1生育期和株高性状超高亲优势值
Table 4
| 不育系Sterile | 恢复系Restorer | 生育期GP | 株高PH |
|---|---|---|---|
| P03A | L242 | -5.31 | 21.19 |
| L2381 | -7.02 | 11.51 | |
| LNK1 | -6.09 | 20.16 | |
| L280 | -8.62 | 14.08 | |
| L237 | -10.17 | 1.88 | |
| L298 | -10.00 | 5.52 | |
| L025A | L242 | 1.26 | 35.65 |
| L2381 | -2.23 | 33.45 | |
| LNK1 | -3.54 | 24.36 | |
| L280 | -1.32 | 29.53 | |
| L237 | -2.20 | 15.33 | |
| L298 | -4.56 | 20.95 | |
| L080A | L242 | 0.84 | 29.81 |
| L2381 | -1.22 | 39.21 | |
| LNK1 | -2.46 | 29.43 | |
| L280 | -1.56 | 19.66 | |
| L237 | -3.69 | 18.75 | |
| L298 | -3.25 | 24.65 | |
| L081A | L242 | -3.15 | 28.05 |
| L2381 | -2.02 | 15.64 | |
| LNK1 | 2.09 | 20.66 | |
| L280 | -2.62 | 24.08 | |
| L237 | -3.17 | 31.80 | |
| L298 | -2.00 | 25.99 | |
| P02A | L242 | -0.78 | 26.78 |
| L2381 | -1.22 | 30.25 | |
| LNK1 | -1.54 | 14.36 | |
| L280 | -0.32 | 19.57 | |
| L237 | -2.20 | 25.33 | |
| L298 | -3.56 | 10.82 |
新窗口打开|下载CSV
Table 5
表5
表5P03A、不同类型(中晚熟、中高秆)恢复系及其杂交种F1的生育期和株高统计
Table 5
| F1组合 Combination of F1 | 生育期GP (d) | 株高PH (cm) | ||||||||
|---|---|---|---|---|---|---|---|---|---|---|
| 不育系 MSL | 恢复系 RS | F1 | 中亲值 MP | 超中亲 OMP (%) | 不育系 MSL | 恢复系 RS | F1 | 中亲值 MP | 超中亲OMP (%) | |
| P03A/L242 | 102 | 113 | 107 | 107.5 | -0.47 | 95 | 118 | 143 | 106.5 | 34.27 |
| P03A/L2381 | 102 | 114 | 106 | 108.0 | -1.85 | 95 | 139 | 155 | 117.0 | 32.48 |
| P03A/LNK1 | 102 | 115 | 108 | 108.5 | -0.46 | 95 | 124 | 149 | 109.5 | 36.07 |
| P03A/L280 | 102 | 116 | 106 | 109.0 | -2.75 | 95 | 142 | 162 | 118.5 | 36.71 |
| P03A/L237 | 102 | 118 | 106 | 110.0 | -3.64 | 95 | 160 | 163 | 127.5 | 27.84 |
| P03A/L298 | 102 | 120 | 108 | 111.0 | -2.70 | 95 | 163 | 172 | 129.0 | 33.33 |
新窗口打开|下载CSV
2.5 株高和生育期性状遗传分析
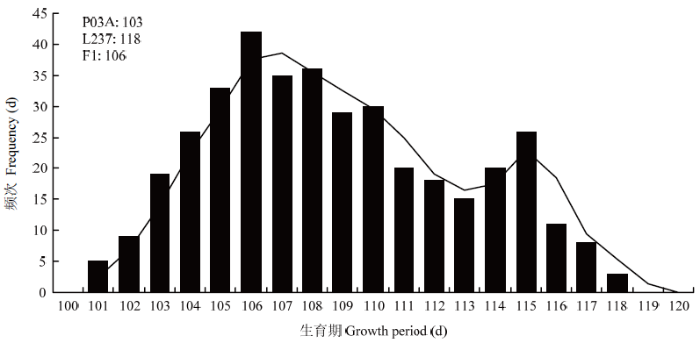
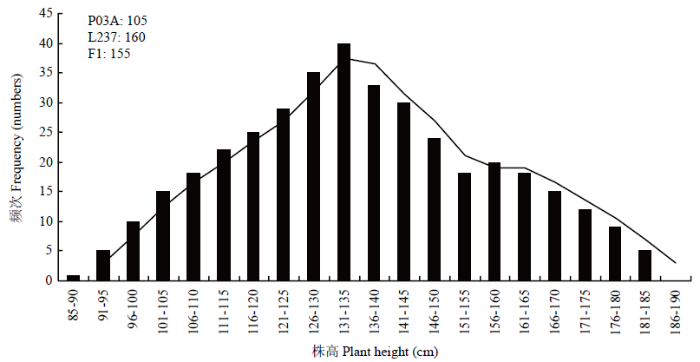
选取在株高和生育期上一般配合力负效应强的P03A与一般配合力正效应强的L237进行杂交,再利用4个世代遗传体系(P1、P2、F1和F2)应用主基因+多基因混合遗传模型对生育期和株高性状进行遗传分析。2.5.1 P1、P2、F1和F2 4个世代生育期和株高频率分布 由分离世代性状统计分析与正态性检验结果(表6)可知,F2中生育期和株高性状偏度值>0,峰度值<0,偏度和峰度绝对值均<1.0,F2中生育期正态性检验P<0.05,为偏正态分布,株高性状正态性检验P≈0.05,为近似正态分布;生育期和株高性状表现连续的双峰和单峰分布(图1和图2),具有植物数量性状遗传的分布特征。推测可能有主基因或主基因+多基因混合遗传方式控制其生育期和株高性状。
Table 6
表6
表6F2植株生育期和株高性状统计分布和正态性检验
Table 6
| 性状Traits | 标准差Standard deviation | 偏度Kurtosis | 峰度Skewness | 正态性检验Normality test | 概率P |
|---|---|---|---|---|---|
| 生育期GP | 4.08 | 0.32 | -0.81 | 0.84 | 0.001 |
| 株高PH | 21.75 | 0.21 | -0.65 | 0.97 | 0.046 |
新窗口打开|下载CSV
图1
 新窗口打开|下载原图ZIP|生成PPT
图1P03A/L237的F2生育期株数频次分布图
Fig. 1Frequency distribution map of plant number of the P03A/L237 in growth period
图2
 新窗口打开|下载原图ZIP|生成PPT
图2P03A/L237的F2株高株数频次分布图
Fig. 2Frequency distribution map of plant number of the P03A/L237 in plant height
由表7可见,P03A平均生育期天数为102 d,L237的平均生育期天数为118 d,F1平均生育期天数为106 d,F2平均生育期天数为106 d。亲本中亲值为110 d,因此,F1和F2均偏向于生育期早熟不育系。F2生育期出现5株超低亲遗传,没有超高亲遗传现象。P03A平均株高为95 cm,L237的平均株高为160 cm,F1平均株高为163 cm,F2平均株高为142 cm。亲本中亲值为128 cm,因此,F1和F2均偏向于高株恢复系。F2株高出现了60株超高亲遗传,6株超低亲遗传现象。
Table 7
表7
表7P03A/L237组合P1、P2、F1和F2群体生育期与株高频次分布
Table 7
| 4个世代群体 Four generations | P1 | P2 | F1 | F2 | 4个世代群体 Four generations | P1 | P2 | F1 | F2 | ||
|---|---|---|---|---|---|---|---|---|---|---|---|
| 生育期性状的频次分布FDGT (d) | 100 | 株高性状的频次分布FGHT(cm) | 85—90 | 1 | 1 | ||||||
| 101 | 2 | 5 | 91—95 | 8 | 5 | ||||||
| 102 | 7 | 9 | 96—100 | 1 | 10 | ||||||
| 103 | 1 | 19 | 101—105 | 15 | |||||||
| 104 | 26 | 106—110 | 18 | ||||||||
| 105 | 1 | 33 | 111—115 | 22 | |||||||
| 106 | 4 | 42 | 116—120 | 25 | |||||||
| 107 | 5 | 35 | 121—125 | 29 | |||||||
| 108 | 36 | 126—130 | 35 | ||||||||
| 109 | 29 | 131—135 | 40 | ||||||||
| 110 | 30 | 136—140 | 33 | ||||||||
| 111 | 20 | 141—145 | 30 | ||||||||
| 112 | 18 | 146—150 | 24 | ||||||||
| 113 | 15 | 151—155 | 18 | ||||||||
| 114 | 20 | 156—160 | 2 | 3 | 20 | ||||||
| 115 | 26 | 161—165 | 6 | 5 | 18 | ||||||
| 116 | 11 | 166—170 | 2 | 2 | 15 | ||||||
| 117 | 2 | 8 | 171—175 | 12 | |||||||
| 118 | 6 | 3 | 176—180 | 9 | |||||||
| 119 | 2 | 181—185 | 5 | ||||||||
| 120 | 186—190 | 1 | |||||||||
| 总株数Total number of plants | 10 | 10 | 10 | 385 | 总株数Total number of plants | 10 | 10 | 10 | 385 | ||
| 均值Average (d) | 102 | 118 | 106 | 106 | 均值Average (cm) | 95 | 160 | 163 | 142 | ||
新窗口打开|下载CSV
2.5.2 最适遗传模型的确定 利用4个世代联合分析方法对组合P03A/L237生育期和株高进行分析,获得5类24种遗传模型的极大似然函数值和AIC值(表8)。E-1模型的AIC值最低,为2 156.72,其次是E-2和E-0。根据盖钧镒世代模型分析方法,生育期性状选取AIC值较小的E0、E1和E2作为备选模型;同理,株高性状选取AIC值较小的E1、E3和E0作为备选模型。根据主基因+多基因遗传模型分析法可知,E0、E1、E2和E3属于2对主基因+多基因调控时,最适模型不一定是最小AIC值,应根据其适合性检验结果来综合考虑利用,利用U21、U22、U23(均匀性检验)、nW2(Smirnov检验)和Dn(Kolmogorov检验)对以上较小值模型的F2世代进行适合性检验(表9),最终选择统计量达到显著水平个数最少的模型作为最优模型。由表9得知,显著水平最少的均为E-1(MX2-ADI-AD)模型(显著水平个数均为0个),即2对加性-显性-上位性主基因+加性-显性多基因混合遗传模型。该遗传模型可解释为性状表现受2对主基因和多基因混合遗传控制,主基因的基因作用方式表现为加性、显性、上位性作用,多基因表现为加性、显性作用。
Table 8
表8
表8P03A/L237 4个世代联合分析在不同遗传模型下的极大似然函数AIC值
Table 8
| 模型 Model | 生育期性状GP | 株高性状PH | |||
|---|---|---|---|---|---|
| 极大似然函数值MFV | AIC值 | 极大似然函数值MFV | AIC值 | ||
| A-1 | 1MG-AD | -1099.25 | 2210.50 | -1790.95 | 3593.89 |
| A-2 | 1MG-A | -1114.60 | 2239.20 | -1791.54 | 3593.08 |
| A-3 | 1MG-EAD | -1107.17 | 2224.34 | -1802.79 | 3615.59 |
| A-4 | 1MG-AEND | -1137.21 | 2284.42 | -1801.53 | 3613.05 |
| B-1 | 2MG-ADI | -1081.63 | 2185.27 | -1774.02 | 3570.04 |
| B-2 | 2MG-AD | -1080.28 | 2174.57 | -1781.03 | 3576.05 |
| B-3 | 2MG-A | -1098.30 | 2206.59 | -1790.01 | 3590.03 |
| B-4 | 2MG-EA | -1104.67 | 2217.35 | -1793.00 | 3594.01 |
| B-5 | 2MG-AED | -1109.25 | 2228.51 | -1823.65 | 3657.29 |
| B-6 | 2MG-EEAD | -1110.47 | 2228.94 | -1804.00 | 3616.00 |
| C-0 | PG-ADI | -1097.70 | 2207.39 | -1751.40 | 3514.79 |
| C-1 | PG-AD | -1104.20 | 2218.39 | -1787.05 | 3584.10 |
| D-0 | MX1-AD-ADI | -1073.09 | 2163.98 | -1739.87 | 3495.73 |
| D-1 | MX1-AD-AD | -1148.73 | 2311.46 | -2093.86 | 4201.72 |
| D-2 | MX1-A-AD | -1097.06 | 2206.12 | -1754.13 | 3520.26 |
| D-3 | MX1-EAD-AD | -1104.19 | 2220.38 | -1795.61 | 3603.23 |
| D-4 | MX1-AEND-AD | -1104.19 | 2220.38 | -1795.61 | 3603.23 |
| E-0 | MX2-ADI-ADI | -1069.35 | 2162.69 | -1735.48 | 3494.97 |
| E-1 | MX2-ADI-AD | -1069.36 | 2156.72 | -1734.89 | 3487.78 |
| E-2 | MX2-AD-AD | -1073.99 | 2157.98 | -1743.75 | 3497.50 |
| E-3 | MX2-A-AD | -1081.68 | 2169.35 | -1742.01 | 3490.02 |
| E-4 | MX2-EAED-AD | -1089.15 | 2182.30 | -1746.91 | 3497.81 |
| E-5 | MX2-AED-AD | -1078.74 | 2163.47 | -1759.96 | 3525.92 |
| E-6 | MX2-EEAD-AD | -1088.83 | 2181.65 | -1754.88 | 3513.75 |
新窗口打开|下载CSV
Table 9
表9
表9生育期和株高性状遗传模型的适合性检验
Table 9
| 性状Traits | 模型 Model | 世代 Generation | U21 | U22 | U23 | nW2 | Dn |
|---|---|---|---|---|---|---|---|
| 生育期 GP | MX2-ADI-ADI | P1 | 0.0003(0.9872) | 0.1456(0.7028) | 2.5227(0.0322)* | 0.0846(0.6775) | 0.2568(0.8234) |
| F1 | 0.0014(0.6200) | 0.0407(0.8402) | 0.9067(0.3410) | 0.0576(0.8305) | 0.1739(0.9905) | ||
| P2 | 0.0185(0.8918) | 0.3031(0.5820) | 2.8068(0.0339)* | 0.1164(0.5172) | 0.1480(0.9985) | ||
| F2 | 0.0001(0.9925) | 0.0000(0.9914) | 0.0000(0.9949) | 0.1832(0.3036) | 0.0028(1.0000) | ||
| MX2-ADI-AD | P1 | 0.0006(0.9804) | 0.1392(0.7091) | 2.521(0.1123) | 0.0846(0.6773) | 0.2558(0.8268) | |
| F1 | 0.0028(0.9575) | 0.0346(0.8525) | 0.9028(0.3420) | 0.0579(0.8292) | 0.1723(0.9913) | ||
| P2 | 0.0198(0.8882) | 0.3077(0.5791) | 2.8028(0.0941) | 0.1163(0.5176) | 0.1491(0.9984) | ||
| F2 | 0.0002(0.9901) | 0.0002(0.9892) | 0.0003(0.9953) | 0.1832(0.3035) | 0.0028(1.0000) | ||
| MX2-AD-AD | P1 | 1.1440(0.2848) | 1.8932(0.1688) | 1.8532(0.1734) | 0.2231(0.2305) | 0.4346(0.2242) | |
| F1 | 3.6457(0.0362) | 3.3947(0.0454)* | 0.0006(0.9799) | 0.4232(0.0650) | 0.4916(0.1227) | ||
| P2 | 0.2916(0.5892) | 0.0518(0.8199) | 1.3947(0.2376) | 0.1235(0.4867) | 0.1617(0.9957) | ||
| F2 | 0.0560(0.8129) | 0.0850(0.7707) | 0.0622(0.8031) | 0.1987(0.2718) | 0.0046(1.0000) | ||
| 株高 PH | MX2-ADI-ADI | P1 | 0.0039(0.9504) | 0.0001(0.9946) | 0.0720(0.7884) | 0.0572(0.8329) | 0.1901(0.9777) |
| F1 | 0.0139(0.9061) | 6.1245(0.0242)* | 3.4916(0.0417)* | 0.1253(0.4794) | 0.1403(0.9994) | ||
| P2 | 0.0039(0.9504) | 0.0001(0.9946) | 0.0720(0.7884) | 0.0572(0.8329) | 0.1901(0.9777) | ||
| F2 | 0.0003(0.9863) | 0.0001(0.9937) | 0.0012(0.972) | 0.1012(0.5899) | 0.0029(1.0000) | ||
| MX2-ADI-AD | P1 | 0.0018(0.9660) | 0.0007(0.9787) | 0.0739(0.7857) | 0.0570(0.8342) | 0.1925(0.9752) | |
| F1 | 0.0205(0.8860) | 0.1100(0.7402) | 0.5402(0.8399) | 0.1269(0.4728) | 0.1383(0.9995) | ||
| P2 | 0.0018(0.9660) | 0.0007(0.9787) | 0.0739(0.7857) | 0.0570(0.8342) | 0.1925(0.9752) | ||
| F2 | 0.0002(0.9901) | 0.0002(0.9894) | 0.0000(0.9957) | 0.0980(0.6060) | 0.0029(1.0000) | ||
| MX2-A-AD | P1 | 1.0327(0.3095) | 0.7879(0.3747) | 0.1484(0.7001) | 0.1566(0.3714) | 0.1306(0.9998) | |
| F1 | 3.0112(0.0361)* | 2.3971(0.0316)* | 0.4907(0.4836) | 0.2178(0.2387) | 0.1814(0.9855) | ||
| P2 | 1.0327(0.3095) | 0.7879(0.3747) | 0.1484(0.7001) | 0.1566(0.3714) | 0.1306(0.9998) | ||
| F2 | 0.3888(0.5329) | 0.4205(0.5167) | 0.0320(0.8581) | 0.1520(0.3852) | 0.0099(1.0000) |
新窗口打开|下载CSV
2.5.3 遗传参数的估计 生育期性状:在控制生育期的2对主效基因中,第1对主基因的加性效应(da)、显性效应(ha)和显性度(ha/da)分别为4.5649、-0.76和-0.1682,第2对主基因的加性效应(db)、显性效应(hb)和显性度(hb/db)分别为-0.0286、0.6971和24.3741(表10)。其中|da|>|db|,说明第1对主基因的加性作用大于第2对主基因的加性作用;|ha|>|hb|,说明第1对主基因的显性作用大于第2对主基因的显性作用;二者的显性度分别小于1和大于1,第1对主基因的显性度为不完全显性,第2对主基因的显性度为超显性,说明控制生育期性状的2对主基因既有加性效应又有显性效应。从主基因间的互作分析结果来看,2对主基因加性×加性和显性×显性的互作效应绝对值均大于主基因显性效应,加性×加性的互作效应大于显性×显性的互作效应,说明加性互作效应对生育期性状的影响比较大。多基因加性效应值[d]为-12.1463,多基因显性效应值[h]为-4.0979。从生育期性状的二阶参数分析结果可知,主基因遗传率为81.13%,多基因遗传率为10.36%。环境方差占表型方差的比例为8.51%。
Table 1
表10
表10生育期和株高性状E-1模型遗传参数的估计
Table 1
| 一阶遗传参数 | 生育期GP | 株高PH | 二阶遗传参数 | 生育期GP | 株高PH | |
|---|---|---|---|---|---|---|
| da | 4.5649 | 13.8071 | σ2mg | 14.6803 | 439.7595 | |
| db | -0.0286 | -1.2563 | σ2pg | 1.7241 | 32.6096 | |
| ha | -0.7681 | -14.6771 | h2mg(%) | 0.8113 | 0.8480 | |
| hb | 0.6971 | -13.1362 | h2pg(%) | 0.1036 | 0.0689 | |
| i | -1.4036 | 17.9810 | σ2p | 426.6282 | 1039.4318 | |
| jab | 0.7422 | 16.3419 | σ2e | 36.3151 | 86.4122 | |
| jba | 2.3529 | 13.0074 | σ2e/σ2p(%) | 8.5100 | 8.3100 | |
| l | -0.7863 | 11.2103 | ||||
| [d] | -12.1463 | -46.5507 | ||||
| [h] | -4.0979 | 68.7717 |
新窗口打开|下载CSV
株高性状:在控制株高的2对主效基因中,第1对主基因的加性效应(da)、显性效应(ha)和显性度(ha/da)分别为13.8071、-14.6771和-1.0630,第2对主基因的加性效应(db)、显性效应(hb)和显性度(hb/db)分别为-1.2563、-13.136和10.4562(表10)。其中|da|>|db|,说明第1对主基因的加性作用大于第2对主基因的加性作用;|ha|>|hb|,说明第1对主基因的显性作用大于第2对主基因的显性作用;二者的显性度均大于1,说明控制株高性状的2对主基因以显性效应为主。从主基因间的互作分析结果来看,2对主基因加性×加性及显性×显性的互作效应绝对值均大于主基因加性效应和显性效应;加性×加性的互作效应大于显性×显性的互作效应,说明加性互作效应对株高性状的影响比较大。多基因加性效应值[d]为-46.5507,多基因显性效应值[h]为68.7717。从株高性状的二阶参数分析结果可知,主基因遗传率为84.80%,多基因遗传率为6.89%。主基因遗传率远大于多基因遗传率。环境方差占表型方差的比例为8.31%。
3 讨论
本研究发现各组合F1株高均表现出较强的超中亲优势,结果表明,P03A组配的高粱杂交组合株高的遗传存在着杂种优势现象,在杂种一代中高秆对矮秆表现为显性或部分显性作用,因遗传背景不同而略有差异。利用最佳杂交亲本是杂交种组配成功的关键和基础[24],相比较而言,在生育期和株高方面,P03A/L237杂交组合表现出最小的超中亲优势,该组合是本试验需选择的最佳组合。本研究利用P03A和L237构建P1、P2、F1和F2 4个世代群体,应用植物数量性状主基因+多基因混合遗传模型,对P03A生育期和株高进行了遗传分析研究,明确了基于早熟矮秆高粱P03A/L237杂交F2生育期和株高的最适遗传模型均为E-1模型,即2对加性-显性-上位性主基因+加性-显性多基因遗传模型。本试验在配合力分析的基础上选取了配合力差异大的P03A和L237,并连续世代分析遗传效应,克服了纯粹单个分离世代分析的局限性,分解出多基因的变异,并将单个分离世代及亲本、F1和F2纳入了统一的似然函数,从而综合地估计出遗传参数,减小了环境对试验结果的误差影响。
3.1 生育期性状的遗传效应
本研究表明,杂交F2生育期多数单株倾向早熟亲本,控制生育期的2对主效基因中,第1对主基因的加性作用大于第2对主基因的加性作用,第1对主基因的显性作用大于第2对主基因的显性作用。加性×加性的互作效应大于显性×显性的互作效应,说明加性互作效应对生育期性状的影响较大,通过上位性效应及多基因效应数值分析,上位性效应和多基因效应真实存在。主基因遗传率远大于多基因遗传率,主基因+多基因决定了生育期表型变异的91.49%,环境因素决定了生育期表型变异8.51%,生育期性状遗传表现主要受遗传因素的影响,受环境影响较小。这与杨伟光[25,26]和李振武[27]结果相近,虽然此研究较早,分析的世代亦有所不同(有F1、F2和F3),但研究结果表明高粱生育期遗传均存在加性效应、显性效应和上位性效应。F2生育期存在超低亲遗传现象,育种者可利用高粱早熟基因遗传力高的特点,可在杂交后代中进行早期选择偏早熟的后代。3.2 植株性状的遗传效应
本研究表明,在控制株高的2对主效基因中,第1对主基因的加性作用大于第2对主基因的加性作用,第1对主基因的显性作用大于第2对主基因的显性作用,控制株高性状的2对主基因以显性效应为主,加性互作效应对株高性状的影响较大,通过上位性效应分析,上位性效应也真实存在。主基因遗传率远大于多基因遗传率,说明株高性状主要受2对主基因的作用。环境方差占表型方差的比例为8.31%,株高性状遗传表现主要受遗传因素的影响,受环境影响较小。这与杨伟光等[28,29]结果一致,与管延安等[17](株高F2遗传符合全显性主基因+加性-显性多基因混合遗传模型)和白晓倩等[30](株高F2遗传符合加性-显性-上位性的混合遗传模型)相近,但不一致,或许与试验材料的选取有关。分析研究早熟矮秆高粱的遗传对于高粱亲本选育和品种改良具有重要意义。在原有优质高产的品种基础上,提早生育期可满足不同生态条件和生产季节的需要,有助于解决早熟与丰产难以兼顾的矛盾;目前在中国高粱生产中应用的A2型雄性不育系多是印度高粱或偏印度高粱。印度高粱与中国高粱杂交优势较强,株高优势也强,这不利于抗倒和机械收割。所以,在培育不育系时还要注意株高优势弱的材料选拔[31]。矮秆材料普遍存在抗倒伏能力强,适宜机械化栽培管理的优势,所以要重视矮秆性状的遗传研究。
4 结论
明确了P03A生育期和株高的遗传力较高、受环境因素影响较小、在后代中遗传比较稳定的特性。在今后的亲本创造和新品种选育过程中,可充分利用P03A遗传效应和特点挖掘早熟矮秆基因,创制适宜机械化新材料和新品种,适应未来机械化轻简栽培要求。参考文献 原文顺序
文献年度倒序
文中引用次数倒序
被引期刊影响因子
[本文引用: 1]
[本文引用: 1]
[本文引用: 1]
[本文引用: 1]
[本文引用: 1]
[本文引用: 1]
[本文引用: 1]
[本文引用: 1]
[本文引用: 1]
[本文引用: 1]
[本文引用: 1]
[本文引用: 1]
[本文引用: 3]
[本文引用: 3]
URLPMID:12872917 [本文引用: 3]
DOI:10.1007/s001220100628URL [本文引用: 1]

Understanding the genetic architecture of quantitative traits can greatly assist the design of strategies for their manipulation in plant-breeding programs. For a number of traits, genetic variation can be the result of segregation of a few major genes and many polygenes (minor genes). The joint segregation analysis (JSA) is a maximum-likelihood approach for fitting segregation models through the simultaneous use of phenotypic information from multiple generations. Our objective in this paper was to use computer simulation to quantify the power of the JSA method for testing the mixed-inheritance model for quantitative traits when it was applied to the six basic generations: both parents (P1 and P2), F1, F2, and both backcross generations (B1 and B2) derived from crossing the F1 to each parent. A total of 1968 genetic model-experiment scenarios were considered in the simulation study to quantify the power of the method. Factors that interacted to influence the power of the JSA method to correctly detect genetic models were: (1) whether there were one or two major genes in combination with polygenes, (2) the heritability of the major genes and polygenes, (3) the level of dispersion of the major genes and polygenes between the two parents, and (4) the number of individuals examined in each generation (population size). The greatest levels of power were observed for the genetic models defined with simple inheritance; e.g., the power was greater than 90% for the one major gene model, regardless of the population size and major-gene heritability. Lower levels of power were observed for the genetic models with complex inheritance (major genes and polygenes), low heritability, small population sizes and a large dispersion of favourable genes among the two parents; e.g., the power was less than 5% for the two major-gene model with a heritability value of 0.3 and population sizes of 100 individuals. The JSA methodology was then applied to a previously studied sorghum data-set to investigate the genetic control of the putative drought resistance-trait osmotic adjustment in three crosses. The previous study concluded that there were two major genes segregating for osmotic adjustment in the three crosses. Application of the JSA method resulted in a change in the proposed genetic model. The presence of the two major genes was confirmed with the addition of an unspecified number of polygenes.
[本文引用: 1]
[本文引用: 1]
DOI:10.11963/issn.1002-7807.201702001URL [本文引用: 1]
[Objective] This study aimed to research patterns of inheritance of earliness-related traits in continuous generations of upland cotton. [Method] The inheritance of six earliness traits was analyzed by joint segregation analysis under a mixed genetic model comprising a major gene plus polygenes in five generations (P1, P2, F1, F2 and F2:3) derived from a Zhong 751213×Lumianyan 28 cross. [Result] Plant height and the node of the first fruiting branch were fitted by a model involving a pair of additive-dominant major genes plus additive-dominant-epistatic polygenes (D). Time from sowing to flowering was fitted by a model corresponding to a pair of completely dominant main genes plus additive-dominant polygenes (D-3). The entire growing period was fitted by a model representing a pair of additive-dominant-epistatic major genes plus additive-dominant-epistatic polygenes (E). The flowering and boll-setting period and the height of the node of the first fruiting branch were fitted by a model consisting of a pair of negatively completely dominant main genes plus additive-dominant polygenes. [Conclusion] The results of this genetic analysis of earliness traits using a major gene plus polygene mixed inheritance model should aid the elucidation of genetic mechanisms underlying earliness characteristics of upland cotton.
[本文引用: 1]
[本文引用: 1]
[本文引用: 1]
[本文引用: 1]
[本文引用: 1]
[本文引用: 1]
[本文引用: 1]
[本文引用: 1]
URL [本文引用: 2]
对普通高粱与甜高粱杂交组合(石红137×L-甜)的株高与糖度进行主基因多基因遗传模型分析,以期研究株高、糖度的遗传效应。获得了2个性状的最适遗传模型,株高的最适遗传模型为2对完全显性主基因+加性-显性多基因混合遗传模型,主基因遗传率为74.4%,多基因遗传率为22.1%;糖锤度的最适遗传模型为1对加性-显性主基因+加性-显性-上位性多基因混合遗传模型,主基因遗传率为65.72%,多基因遗传率为20.43%。主基因个数和基因效应的预测与分子检测的主效QTL个数和基因效应基本相符。
URL [本文引用: 2]
对普通高粱与甜高粱杂交组合(石红137×L-甜)的株高与糖度进行主基因多基因遗传模型分析,以期研究株高、糖度的遗传效应。获得了2个性状的最适遗传模型,株高的最适遗传模型为2对完全显性主基因+加性-显性多基因混合遗传模型,主基因遗传率为74.4%,多基因遗传率为22.1%;糖锤度的最适遗传模型为1对加性-显性主基因+加性-显性-上位性多基因混合遗传模型,主基因遗传率为65.72%,多基因遗传率为20.43%。主基因个数和基因效应的预测与分子检测的主效QTL个数和基因效应基本相符。
[本文引用: 1]
[本文引用: 1]
[本文引用: 1]
[本文引用: 1]
[本文引用: 1]
[本文引用: 1]
[本文引用: 1]
[本文引用: 1]
[本文引用: 1]
URL [本文引用: 1]
URL [本文引用: 1]
[本文引用: 1]
[本文引用: 1]
URL [本文引用: 1]
采用世代平均数分析的多元回归法对中国高粱生育期进行了遗传分析,同时研讨了杂种F#-1代生育期的表现及其原因。结果表明,中国高粱相互杂交,杂种F#-1代生育期略倾向早熟亲本,但基本上没有超亲现象。双亲生育期的表现制约着F#-1代的表现。中国高粱生育期加性效应占绝对优势,是杂种后代决定于双亲的主要因素。同时生育期减效基因略占优势,具有负的显性效应,使杂种F#-1代表现为早熟。这是长期驯化选择保留了早熟性基因的结果。显性效应及上位性效应在某些组合显著存在,不可忽略;上位性效应显得更加重要些。
URL [本文引用: 1]
采用世代平均数分析的多元回归法对中国高粱生育期进行了遗传分析,同时研讨了杂种F#-1代生育期的表现及其原因。结果表明,中国高粱相互杂交,杂种F#-1代生育期略倾向早熟亲本,但基本上没有超亲现象。双亲生育期的表现制约着F#-1代的表现。中国高粱生育期加性效应占绝对优势,是杂种后代决定于双亲的主要因素。同时生育期减效基因略占优势,具有负的显性效应,使杂种F#-1代表现为早熟。这是长期驯化选择保留了早熟性基因的结果。显性效应及上位性效应在某些组合显著存在,不可忽略;上位性效应显得更加重要些。
[本文引用: 1]
[本文引用: 1]
[本文引用: 1]
[本文引用: 1]
URL [本文引用: 1]
采用世代均值的多元回归法对中国高粱主要农艺性状基因效应进行了研究。结果表明,株高、地上节数及穗柄长主要以加性效应为主;这3个性状上位性效应亦重要。穗粒数、穗粒重及茎粗的显性效应占优势。它们的上位性效应似乎比加性效应更加重要。500粒重的加性效应、显性效应并重,但其上位性效应在某些组合仍起一定作用。株高的加性效应值为负值,说明中国高粱株高隐性基因较多,有利于中矮秆杂交种的培育。单株产量的显性效应值为正值,便于提高杂交种单产。
URL [本文引用: 1]
采用世代均值的多元回归法对中国高粱主要农艺性状基因效应进行了研究。结果表明,株高、地上节数及穗柄长主要以加性效应为主;这3个性状上位性效应亦重要。穗粒数、穗粒重及茎粗的显性效应占优势。它们的上位性效应似乎比加性效应更加重要。500粒重的加性效应、显性效应并重,但其上位性效应在某些组合仍起一定作用。株高的加性效应值为负值,说明中国高粱株高隐性基因较多,有利于中矮秆杂交种的培育。单株产量的显性效应值为正值,便于提高杂交种单产。
[本文引用: 1]
[本文引用: 1]
[本文引用: 1]
[本文引用: 1]
[本文引用: 1]
[本文引用: 1]
