 ,1,2, 李玉环1,2, 闫宏3, 张晓鑫11
 2
3
LAI Estimation Based on Multi-Spectral Remote Sensing of UAV and Its Application in Saline Soil Improvement
SHI FengZhi1,2, WANG RuiYan,1,2, LI YuHuan1,2, YAN Hong3, ZHANG XiaoXin1通讯作者:
责任编辑: 杨鑫浩
收稿日期:2019-08-23接受日期:2020-03-7网络出版日期:2020-05-16
| 基金资助: |
Received:2019-08-23Accepted:2020-03-7Online:2020-05-16
作者简介 About authors
史丰智,E-mail:1204944751@qq.com。

摘要
关键词:
Abstract
Keywords:
PDF (2247KB)元数据多维度评价相关文章导出EndNote|Ris|Bibtex收藏本文
本文引用格式
史丰智, 王瑞燕, 李玉环, 闫宏, 张晓鑫. LAI无人机多光谱遥感估测及其在盐渍土改良中的应用[J]. 中国农业科学, 2020, 53(9): 1795-1805 doi:10.3864/j.issn.0578-1752.2020.09.008
SHI FengZhi, WANG RuiYan, LI YuHuan, YAN Hong, ZHANG XiaoXin.
0 引言
【研究意义】我国是一个人口大国,随着社会发展、人口的不断增加以及人民生活质量的提高,粮食需求量持续增加。在此严峻形势下,保障粮食安全是我国国民经济与社会发展的首要目标[1]。面向当前粮食安全重大需求,国家提出建设“渤海粮仓”的重大战略决策[2]。在该战略中,我国东部环渤海滨海盐土区是主战场。尽管科学家们曾进行了大量的盐碱地改良机理研究和应用尝试,研发了许多改良技术和方法,但滨海盐渍土地区具有沿海沿河、地势低、地下水矿化度高、土壤盐碱程度高等水文、地质特点,存在“盐”“碱”“瘦”“板”等障碍性因子,难改良、易反复,当前盐碱土改良技术方法在该地区的实际应用的效果尚不清楚。因此,客观准确地评价盐渍土改良效果对指导当地优选盐渍土改良技术和产品具有重要价值,对盐渍土改良技术的大面积推广和“渤海粮仓”建设具有重大意义。【前人研究进展】目前对盐渍土改良效果的评价一般采用“产量法”和“土样指标法”,这两类方法都是通过调查单位面积的作物产量或点位采集并化验土壤样品的化学指标来进行改良效果评价。如刘东兴等[3]通过化验土壤分析有机质、速效氮、pH、电导率等土壤理化性质来评价生物有机肥改良黑龙江大庆市盐渍土地区改良效果。刘杰等[4]通过调查单位面积棉花的株数与每株铃数,评价不同盐碱土改良剂在棉花上的应用效果。尽管这两种方法可以在点位上获得较高的评价精度,但在进行面尺度外推时存在代表性差、成本高、时效性差等缺点,因此在水盐空间变异强烈的濒海盐渍土地区并不适用[5]。近年来,新兴起的无人机遥感技术具有数据时空分辨率高、测量机动灵活、观测范围大等优势,在农田时空变化信息采集中的应用逐渐增多[6,7,8,9,10]。在目前的应用研究中,所使用的传感器主要是数码相机和高光谱载荷通道设置[11,12,13,14]。数码相机只能体现可见光波段的光谱信息,反映的光谱信息不充分,机载高光谱具有波段间隔窄、光谱分辨率高、连续性强等优点,但成本较高,主要应用于科学研究,大范围推广具有局限性[15,16,17,18]。无人机多光谱数据具有空间、光谱和价格的相对优势,有更大的田间应用潜力。冬小麦在我国是仅次于水稻的第二大粮食作物,是滨海盐渍土地区主要粮食作物[19,20,21]。LAI控制着植物冠层的多种生理和生态过程,是观测植物长势不可或缺的植被参数,研究结果表明,拔节期冬小麦LAI是评价盐渍土改良效果的最佳指标[22]。【本研究切入点】虽然国内外对农作物LAI遥感研究取得了丰硕的成果,但利用无人机多光谱遥感数据进行盐渍土地区的冬小麦LAI估测研究却较缺乏,专门用于盐渍土改良效果的评价研究鲜有报道。【拟解决的关键问题】本文基于实测数据和无人机多光谱遥感数据,研究滨海盐渍土地区冬小麦拔节期LAI的遥感估测方法,探究适合盐渍土改良效果评价的新途径。预期结果将为盐渍土地区冬小麦的长势监测和盐渍土改良提供技术和数据支持。1 材料与方法
1.1 研究区概况
研究区在滨州市“渤海粮仓”无棣县核心试验区(37°54′N—37°57′N,117°54′E—117°57′E)。无棣县隶属于山东省滨州市,位于山东省最北部,濒临渤海湾,土地资源丰富,总面积2×10⁵hm2。“渤海粮仓”试验区处于无棣县东部,面积约为6.6 hm2,海拔高度在2 m左右,东北部受海水影响较大[23]。土壤类型为滨海盐碱潮土,地势低洼,pH在7.2—8.2,含盐量较高,土壤板结严重,试验区改良前属于重度盐渍土,经土地整理后沟渠和道路配套齐全,试验地块布置整齐,作物为冬小麦和夏玉米。1.2 数据获取
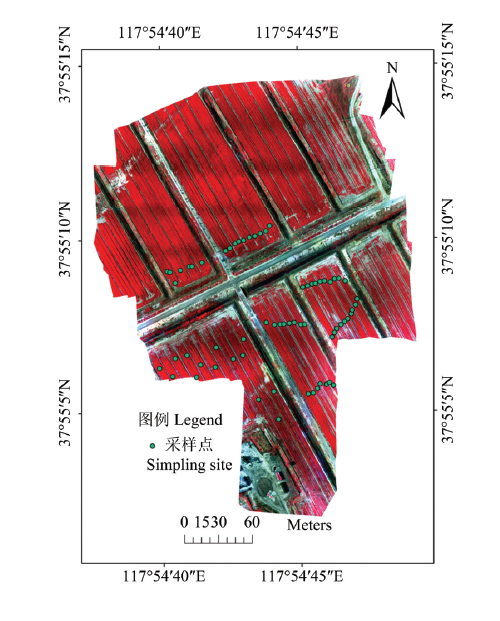
1.2.1 土壤采样和LAI实测 根据冬小麦长势差异布设采样点,每个采样点能够明显代表周围小麦的长势情况,共布设采样点66个。利用差分GPS准确记录采样点位置。利用LAI-2200C采集冬小麦叶面积指数,利用盐分计实地测定采样点处盐分含量。室内烘干法测定土样水分含量,重铬酸钾氧化法测定土壤有机质含量,凯氏定氮仪测定土壤全氮含量。1.2.2 无人机多光谱数据获取与处理 图像的获取采用搭载Sequoia多相机型多光谱相机的多旋翼无人机,Sequoia多相机型多光谱相机具有绿光(GRE)、红光(RED)、红边(REG)和近红外(NIR)4个波段。飞机起飞前规划好飞行路线与白板校正。为了减少太阳高度角与光线强弱造成的图像偏差,无人机飞行在中午12点到下午2点之间进行,飞行高度为50 m,图像拍摄时阳光较充足,风力较小。无人机对试验区进行无人机拍摄后再对试验区进行实地采样。利用Pix 4D mapper软件进行图像的拼接,辐射校正。同时利用差分GPS确定明显地物点的位置,对无人机影像进行几何校正,得到研究区的假彩色合成图(图1)。提取采样点的光谱反射率,与实测的叶面积指数进行对应,用于LAI建模。
图1
 新窗口打开|下载原图ZIP|生成PPT
图1试验区范围与采样点
Fig. 1The experimental region and sample sites
研究构建LAI无人机遥感反演模型的方法,获取冬小麦LAI的空间分布;采用传统的土样指标法,通过因子分析法对抽样地块的盐渍土改良效果进行评价,进而分析评价结果与无人机反演冬小麦拔节期LAI的关联性;应用每个试验地块的LAI均值对研究区全部地块的盐渍土改良效果进行评价,筛选改良效果最优地块。
1.3 研究方法
1.3.1 叶面积指数实测值与无人机影像的光谱匹配方法 为了将冠层分析仪的测量值与无人机影像上像元值进行对应,采用1×1、2×2、3×3、4×4、5×5、6×6和7×7多个梯度的窗口,对原始图像进行滤波处理,通过比较不同梯度的滤波提取的光谱值与叶面积指数的相关性,选择最优窗口的光谱影像与叶面积指数匹配。1.3.2 敏感波段选择和光谱指数构建 将“渤海粮仓”的采样点的实测LAI与滤波处理后的无人机遥感影像单个波段反射率进行相关性分析。根据相关系数选择特征波段,并使用这些特征波段的反射率构建植被指数,特征波段和植被指数共同构成反演特征集合。将特征集合与LAI相关性高的特征波段或指数作为LAI的敏感波段。
为了增强LAI的光谱差异,利用敏感波段构建多种常见植被指数,分析与LAI之间的相关性,提高无人机遥感反演冬小麦LAI的精度。
1.3.3 建模和验证 从采集的样本中,剔除3个异常值,将剩余63个样本随机分为2组,44个样本用于建模,19个样本用于验证。分别利用线性回归分析、偏最小二乘(PLS)、随机森林(RF)和支持向量机(SVM)等多种机器学习的方法建立叶面积指数反演模型。本研究经过试验确定所用机器学习算法的主要参数设置,其中SVM回归模型的建立是在Matlab2016a中基于Libsvm工具箱实现;支持向量回归(SVR)选用径向基核函数(RBF),类型采用e-SVR,损失函数为0.01,采用训练集交叉验证(cross-validation)和网格搜索法(grid-search)进行参数寻优,依据均方差最小原则确定惩罚参数C和核参量g的值;偏最小二乘模型是利用SPSS软件进行分析;随机森林进行300次迭代和基础学习。
采用决定系数(R2)和均方根误差(RMSE)以及相对分析误差(RPD)作为模型精度的评价指标[24],对建模精度和验证精度进行评价,从而选定叶面积指数反演的最佳模型,获得研究区的叶面积指数空间分布反演结果。
1.3.4 基于土样指标法的盐渍土改良效果评价 根据滨海盐渍土的特点,从养分指标、盐分指标和水分3个方面,选取土壤含水量、含盐量、有机质含量和全氮含量4个指标作为盐渍土改良效果评价指标。对研究区各地块进行编号,随机抽取试验田中东西主路南侧80%的地块作为评价对象,将同一地块内采样点的指标平均值作为该地块的评价指标值,公因子特征根的方差贡献率作为评价指标权重,利用线性加权法构建改良效果评价函数。计算采样地块的盐渍土改良效果得分,并据此对研究区各地块的改良效果进行分析。
1.3.5 评价结果与冬小麦LAI的模型构建 构建各地块的盐渍土改良效果得分与对应地块LAI平均值的相关性模型,根据两者的决定系数确定盐渍土改良效果评价与LAI之间的关联程度,分析拔节期冬小麦LAI反演结果在盐渍土改良效果评价中的应用状况。
2 结果
2.1 LAI的无人机遥感反演结果
2.1.1 敏感波段与光谱指数分析 采样点7种滤波窗口处理后的反演特征集合的光谱数据,及其与LAI相关性分析结果如表1所示。表中数据显示,除红边外,各波段光谱数据与叶面积指数的相关性在所有滤波窗口均达到极显著相关。各波段综合比较而言,红光波段的相关性最高,其次为绿光和近红外波段,红边的最低。除近红外波段外,其他波段与叶面积指数为负相关。红边波段与叶面积指数的相关性与窗口大小关系密切,小于3×3窗口时,两者没有相关性。根据各波段与叶面积指数的相关分析,选择相关系数大于0.5的绿光(GRE)、红光(RED)和近红外(NIR)波段作为叶面积指数的敏感波段。Table 1
表1
表1不同滤波窗口处理后的特征波段与LAI相关性
Table 1
| 不同窗口 Different window | 波段名称Band name | ||||||
|---|---|---|---|---|---|---|---|
| 1×1 | 2×2 | 3×3 | 4×4 | 5×5 | 6×6 | 7×7 | |
| 绿光GRE | -0.53** | -0.54** | -0.54** | -0.58** | -0.57** | -0.58** | -0.58** |
| 红光RED | -0.58** | -0.60** | -0.59** | -0.60** | -0.61** | -0.59** | -0.61** |
| 红边REG | -0.18 | -0.19 | -0.25* | -0.32** | -0.34** | -0.43** | -0.38** |
| 近红NIR | 0.55** | 0.55** | 0.53** | 0.47** | 0.49** | 0.38** | 0.45** |
新窗口打开|下载CSV
选取敏感波段绿光(GRE)、红光(RED)和近红(NIR)波段构建的植被指数如表2所示。7个滤波窗口的植被指数与LAI的相关性分析结果见表3。结果显示,各植被指数与叶面积指数都达到极显著相关,且植被指数对LAI的敏感度远高于单波段。在同一滤波窗口处理下,RVI与叶面积指数的相关性各植被指数中最高的。不同滤波窗口中,5×5的窗口中各植被指数与叶面积指数的相关性也是最高的。因此,5×5滤波处理后的植被指数作为LAI反演的敏感光谱指数,进行叶面积指数反演模型的构建,各模型的决定系数(R2)、均方根误差(RMSE)和相对分析误差(RPD)比较结果见表4。
Table 2
表2
表2植被指数计算公式
Table 2
| 植被指数 Vegetation index | 计算公式 Calculation formula |
|---|---|
| 归一化植被指数 NDVI[25] | NDVI=(ρnir-ρred)/(ρnir+ρred) |
| 比值植被指数 RVI[26] | RVI=ρnir/ρred |
| 绿度归一化植被指数 GNDVI[27] | GNDVI=(ρnir-ρgre)/(ρnir+ρgre) |
| 绿色比值植被指数 GRVI[28] | GRVI=ρnir/ρgre |
新窗口打开|下载CSV
Table 3
表3
表3不同滤波处理后光谱指数与叶面积指数相关性
Table 3
| 不同窗口 Different window | 植被指数 Vegetation index | ||||||
|---|---|---|---|---|---|---|---|
| 1×1 | 2×2 | 3×3 | 4×4 | 5×5 | 6×6 | 7×7 | |
| NDVI | 0.62** | 0.66** | 0.64** | 0.66** | 0.67** | 0.62** | 0.67** |
| RVI | 0.78** | 0.80** | 0.81** | 0.81** | 0.82** | 0.79** | 0.79** |
| GNDVI | 0.59** | 0.63** | 0.62** | 0.67** | 0.66** | 0.63** | 0.67** |
| GRVI | 0.75** | 0.79** | 0.77** | 0.79** | 0.79** | 0.77** | 0.79** |
| (G+R)/NIR | 0.55** | 0.58** | 0.57** | 0.60** | 0.60** | 0.56** | 0.61** |
新窗口打开|下载CSV
Table 4
表4
表4植被指数与LAI建模与验证
Table 4
| 建模集Modeling set (n=44) | 验证集Validation set (n=19) | |||||||
|---|---|---|---|---|---|---|---|---|
| 多元线性回归 Multiple linear regression | 偏最小二乘 PLS | 支持向量机 SVM | 随机森林 RF | 多元线性回归 Multiple linear regression | 偏最小二乘 PLS | 支持向量机 SVM | 随机森林 RF | |
| R2 | 0.84 | 0.75 | 0.85 | 0.94 | 0.69 | 0.66 | 0.62 | 0.56 |
| RMSE | 0.51 | 0.63 | 0.48 | 0.32 | 0.66 | 0.67 | 0.74 | 0.79 |
| RPD | 2.30 | 1.70 | 2.40 | 3.50 | 1.40 | 1.50 | 1.30 | 1.20 |
新窗口打开|下载CSV
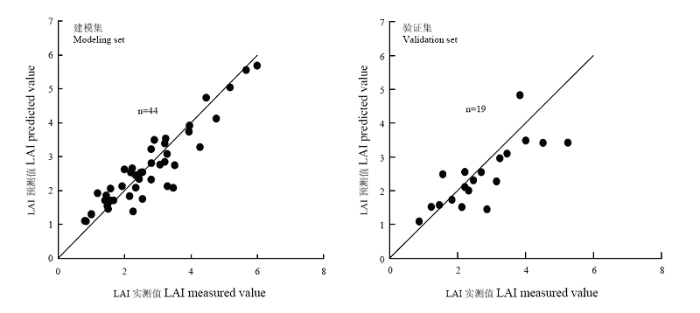
表4数据显示,支持向量机建模方法的精度最高,其次为线性回归方法和PLS方法,随机森林的误差最大。将支持向量机方法的LAI预测值与实测值结果进行比较,结果如图2所示,其建模集R2为0.85,RMSE为0.48,RPD为2.4。验证集R2为0.66,RMSE为0.67,RPD为1.3。因此采用支持向量机构建冬小麦叶面积指数遥感反演模型。利用该模型对整个研究区进行反演结果如图3所示。
图2
 新窗口打开|下载原图ZIP|生成PPT
图2冬小麦LAI实测值与预测值比较
Fig. 2Comparison of measured and predicted values of winter wheat LAI
图3
 新窗口打开|下载原图ZIP|生成PPT
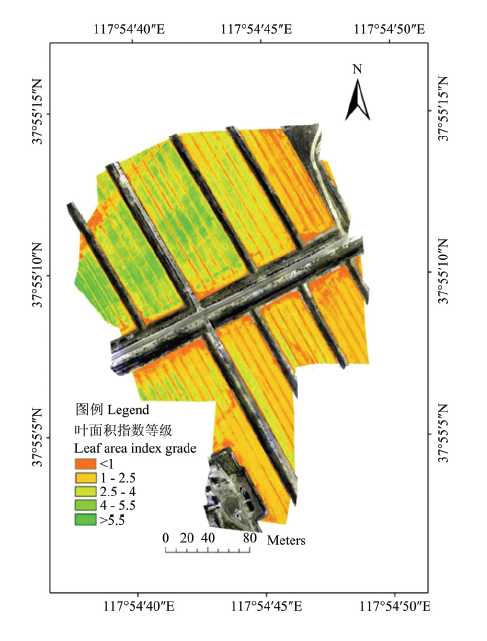
图3叶面积指数等级分布图
Fig. 3Leaf area index grade distribution map
图3表明,研究区的拔节期冬小麦LAI介于0—6,其中0—1对应裸土,冬小麦LAI主要集中在1—2.5,与实际采集拔节期冬小麦LAI接近,总体来看,叶面积指数空间变化强烈。研究区北部和南部冬小麦LAI长势差别明显,说明改良措施多且具有较大差异。另外,从LAI等级分布图中还可以看出,同一地块中的冬小麦LAI差异明显,这意味着少数几个采样点的数据并不能代表该地块的整体水平,但利用无人机却能够更加准确直观地展示试验田中同一地块内和不同地块间冬小麦LAI的差异。
2.2 基于土样指标法的盐渍土改良效果评价
对评价指标值进行KMO和巴特利特球形球性检验,KMO=0.68,Sig=0.002<0.05。结果显示,各指标之间的相关性和独立性满足因子分析条件。应用因子分析确定主成分因子的特征值和贡献率见表5和表6。Table 5
表5
表5总方差分析
Table 5
| 成分Ingredient | 初始特征值Initial eigenvalue | 提取载荷平方和Extract load sum of squares | 旋转载荷平方和Sum of rotation load squares | ||||||
|---|---|---|---|---|---|---|---|---|---|
| 总计 Total | 方差百分比 Variance percentage | 累积 Accumulation (%) | 总计 Total | 方差百分比 Variance percentage (%) | 累积Accumulation (%) | 总计 Total | 方差百分比 Variance percentage | 累积 Accumulation (%) | |
| 1 | 2.330 | 58.248 | 58.248 | 2.330 | 58.248 | 58.248 | 2.114 | 52.852 | 52.852 |
| 2 | 0.959 | 23.987 | 82.235 | 0.959 | 23.987 | 82.235 | 1.175 | 29.383 | 82.235 |
| 3 | 0.458 | 11.445 | 93.680 | ||||||
| 4 | 0.253 | 6.320 | 100.000 | ||||||
新窗口打开|下载CSV
Table 6
表6
表6成分得分矩阵
Table 6
| 成分1 Ingredient 1 | 成分2 Ingredient 2 | |
|---|---|---|
| 有机质Organic matter | 0.411 | -0.023 |
| 盐分Salinity | -0.275 | -0.260 |
| 含氮量Nitrogen content | 0.502 | -0.263 |
| 水分Moisture | -0.171 | 0.899 |
新窗口打开|下载CSV
表5数据表明,前2个主因子总方差的贡献率达到了82.23%,将其作为公因子代表选取的指标。为了使公共因子能更好地体现土壤中各项理化指标,采用方差最大法对因子进行最大化正交旋转处理,建立因子载荷矩阵(表6)。由旋转后的成分矩阵以及成分得分矩阵中可以得出,第一公因子有机质、含氮量在冬小麦LAI等指标上具有较大的载荷,将其定义为养分因子,反应的是各地块的土壤中总体养分情况。第二公因子在盐分和水分指标上具有较大的载荷,将其定义为盐分因子,反应了各地块的土壤中盐分水平。依据改良效果因子得分矩阵,利用各个公共因子特征根的方差贡献率进行加权,建立改良效果综合评价函数:
式中,X1为有机质的方差贡献率,X2为盐分的方差贡献率,X3为含氮量的方差贡献率,X4为水分的方差贡献率。
2.3 LAI与改良效果的关联分析
根据公式1,计算各地块改良效果得分(表7)。依据改良效果得分对试验小区进行排序,并与该地块冬小麦平均LAI进行对应,对所选地块LAI进行排序。Table 7
表7
表7各地块得分情况排名
Table 7
| 地块编号 Parcel number | 得分 Score | LAI | 排名 Ranking | 地块编号 Parcel number | 得分 Score | LAI | 排名 Ranking | 地块编号 Parcel number | 得分 Score | LAI | 排名 Ranking | ||
|---|---|---|---|---|---|---|---|---|---|---|---|---|---|
| 6 | 0.67 | 4.76 | 1 | 9 | 0.42 | 2.35 | 7 | 12 | 0.33 | 1.55 | 12 | ||
| 1 | 0.59 | 3.84 | 2 | 15 | 0.42 | 2.40 | 6 | 13 | 0.32 | 1.88 | 11 | ||
| 8 | 0.49 | 2.81 | 4 | 10 | 0.39 | 2.51 | 8 | 16 | 0.22 | 1.70 | 13 | ||
| 5 | 0.48 | 3.24 | 3 | 18 | 0.34 | 2.19 | 9 | 17 | 0.02 | 1.39 | 14 | ||
| 11 | 0.46 | 2.66 | 5 | 14 | 0.33 | 1.76 | 10 |
新窗口打开|下载CSV
表7结果显示,盐渍土改良效果得分与LAI变化趋势和排名都基本保持一致,盐渍土改良效果得分越高,对应的地块LAI平均值也越高。以采样地块改良效果评价得分为因变量,LAI地块平均值为自变量,构建改良效果的LAI评价模型:
式中,y为各地块的改良效果评价得分,x为各地块LAI含量平均值。
该模型的决定系数R2为0.86,RMSE为0.06,RPD为2.52,表明改良效果的LAI评价模型的精度较高。因此,拔节期冬小麦LAI作为一个植被长势指标,能够很好地评价出“渤海粮仓”盐渍土地区各地块改良效果。
2.4 基于LAI反演结果的盐渍土改良效果评价
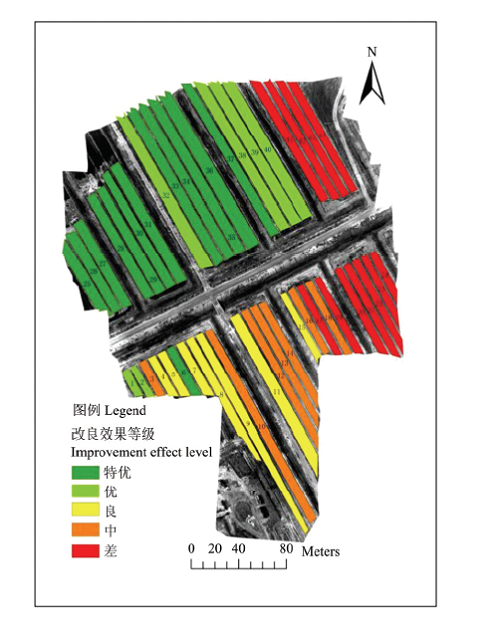
以地块为单位,依据无人机LAI反演结果统计每一地块的LAI均值,结合改良效果的LAI评价模型得到试验区各地块的盐渍土改良效果评分,采用自然断点法将盐渍土改良效果评分划分为5个等级(特优,优,良,中和差),试验区盐渍土改良效果评价结果见图4。图4
 新窗口打开|下载原图ZIP|生成PPT
图4试验田改良效果等级划分图
Fig. 4Experimental field improvement level classification map
从改良效果等级图可以看出,地块间的改良效果差异明显,研究区西北部地块改良效果总体较好,评分最低的为东部2个地块片区,这些是试验区中的对照地块,未经过任何改良措施,土壤有机质平均含量为1.5 g·kg-1,含盐量为1.8 g·kg-1,含水量为0.07%,含氮量为0.07%,评价等级为差;其他地块的改良效果评价等级呈交错分布。改良效果为良以上的地块编号为1、2、4—9、11、15、25—40,最差的为20—24和41—44,其余为中等改良效果。南半部地块间盐渍土改良效果中,1—10号相邻地块改良效果均不同。其中改良效果特优和优的地块占全部地块的50%,良和中的地块占全部地块的32%。评价效果为中等的地块的改良措施是通过增施氮肥培肥地力,其中有机质含量为1.8 g·kg-1,含盐量为1.2 g·kg-1,含水量为0.07%,含氮量为0.12%;评价效果为良的地块是通过施加有机肥的增碳降盐改良试验,有机质含量平均值为2.1 g·kg-1,盐分含量平均值为0.8 g·kg-1,含水量平均值为0.07%,含氮量平均值为0.1%;而改良效果为优和特优的地块是经过引黄淤灌和增施有机肥的综合改良措施,有机质含量平均值为2.1 g·kg-1,含盐量平均值为0.02 g·kg-1,含水量为平均值0.1%,含氮量平均值为0.12%。比较多种改良方法可以得出,引黄淤灌和增施有机肥的综合改良方式对盐渍土改良效果最佳,能同时达到降盐增碳培肥地力的效果,其次是增施有机肥,效果最差的是只施加氮肥。
3 讨论
3.1 无人机遥感影像平滑窗口对LAI反演精度的影响
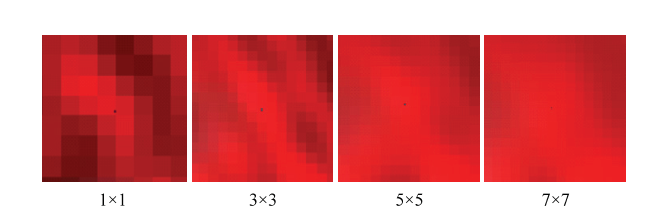
通过对采样点LAI实测值与无人机多光谱数据的相关分析表明,拔节期冬小麦叶面积估测所使用的无人机遥感数据,并不是分辨率越高越好,而是5×5均值平滑后的光谱数据最佳。这可能是由无人机遥感影像上采样点所在的像元大小与叶面积指数实测所代表的空间范围不匹配造成的。图5中的1×1窗口为某一LAI实测采样点在滤波处理前的图像上所在的位置,为一垄小麦的中心,在50 m航高拍摄的无人机影像上,无人机影像的分辨率是0.05 m,在这样的范围内,冠层分析仪测量的则是一垄小麦的叶面积指数,拔节期一垄小麦的宽度是0.2—0.3 m,两者的空间大小差异较大。5×5窗口尺寸为0.25 m,与一垄小麦的宽度相当,当将无人机遥感影像进行5×5窗口大小的平滑滤波处理后,该采样点所在的光谱为窗口范围内像元的光谱反射率的均值,与采样点LAI实测值较好地匹配起来。图5
 新窗口打开|下载原图ZIP|生成PPT
图54种窗口滤波处理后的假彩色合成无人机影像(黑点为采样点)
Fig. 5Four kinds of window filter processing false color synthesis UAV image (black spot is sampling point)
3.2 红边单波段与叶面积指数的相关性
红边参数是高光谱数据在植被监测中的特有指标,广泛应用于作物生态物理参数反演与提取中。但是,在这款传感器的4个波段中,红边的反射率与拔节期冬小麦叶面积指数的相关性最低。这与目前的高光谱红边参数研究有所不同,但也并不矛盾。在目前高光谱研究中,主要使用的是与红边位置有关的红边特征,如“红移”、红边振幅和红边面积等,而不是某一红边波段的反射率。这也就意味着,无人机所携带的传感器至少具有2个红边波段才有可能利用红边参数这项指标进行叶面积指数的反演,仅有一个红边波段发挥作用有限,不如传统的红光和近红外波段对叶面积指数的变化敏感。无独有偶,夏天等[29]利用无人机高光谱研究不同冬小麦叶面积指数反演方法的模拟精度及适应性,得到在720 nm附近与叶面积指数的相关性接近于0。这与我们在红边波段光谱值与叶面积指数的相关性分析的结果相似。3.3 RVI对LAI的变化的敏感性分析
尽管NDVI在LAI反演研究中应用最为广泛,但本研究结果却表明,比值植被指数RVI与叶面积指数之间的相关性相对较高。分析其原因,可能与拔节期冬小麦的长势和阴影对可见光的强吸收有关,在强吸收的情况下,冬小麦冠层的红光波段反射率接近0。因此,拔节期的无人机图像上,不同LAI对应的NDVI差异不大,都接近1;而比值植被指数是近红外波段和红光波段的反射率比值,因近红外波段的反射率随LAI增大而升高,红光波段与之相反,因此,比值植被指数会对LAI的变化更为敏感,这与目前研究结果一致,如郑踊谦[30]的研究结果表明,RVI与其他植被指数相比,RVI具有较好地抗饱和性,在几个植被指数中总体表现结果最好。3.4 冠层分析仪在测量盐渍土麦田LAI差异中的适用性
手工实测是获取LAI数据的最准确的方法,然而,实测LAI需要收割冬小麦植株获取实际LAI,属于破坏取样,由于本试验是设置在“渤海粮仓”试验区,试验区各地块为不同课题组的盐渍土改良试验田,为了避免影响试验,不宜采用LAI实测法。因此,本研究采用LAI-2200C植物冠层分析仪对冬小麦LAI进行测定,测量原理是基于叶面积的垂直投影,其在高植被密度条件下与手工测定值有较大偏差,但是,在滨海盐渍土地区,由于盐害胁迫,即使旺盛生长期的冬小麦长势也普遍比内陆小麦差,LAI相对偏低,不同改良田块之间LAI差异较大,因此,即使用LAI-2200C植物冠层分析仪也能够体现LAI之间的相对差异,当然,由于该测量方法的局限,这种差异刻画地不够精密。但是,对于反映盐渍土改良效果的相对差异来说,尤其是以分级的形式表达盐渍土改良效果的差异时,这个精度已经能够满足实用的要求。3.5 LAI与盐渍土改良效果的关系
尽管基于主成分分析的改良效果评价模型是各评价指标的线性加权模型,但是,基于冬小麦LAI的改良效果评价模型结果表明,拔节期冬小麦LAI与综合评价得分为非线性关系,这说明LAI与单项评价指标并不是线性相关。这与目前土壤水肥效应的研究结论一致,如刘思汝等[31]从LAI等方面综述了水肥一体化技术对果树生长发育的影响,得出LAI能够反映土壤中水分和养分对作物的综合影响情况。因此利用LAI更多地体现了盐渍化改良过程中土壤中多项理化指标的综合变化情况。4 结论
在冬小麦拔节期,无人机可见光波段(绿光、红光)和近红外波段对叶面积指数的敏感性高于红边。利用红光与近红外波段构建的RVI植被指数与拔节期冬小麦的LAI的相关性最好。无人机遥感数据的空间分辨率高,会造成采样点所在的像元与LAI实测值所代表的空间范围不一致问题,针对这一问题,可以通过对无人机图像进行降尺度处理的方法进行解决。本研究中发现,在无人机飞行高度50 m情况下,5×5的滤波处理后像元的光谱值与拔节期冬小麦LAI的相关性最高。
叶面积指数与植被指数通过其他机器学习模型能够进一步提高模型的精度,其中支持向量机模型效果最好,其模型R2达到了0.90,RMSE为0.55,RPD为2.2。验证集的R2为0.67,RMSE为0.71,RPD为1.5。盐渍土改良效果得分与拔节期冬小麦LAI的评价模型为非线性,其决定系数为0.86,拔节期冬小麦LAI能够对盐渍土改良效果进行综合评价。
从无人机LAI遥感反演结果与改良效果可以看出,无人机多光谱遥感反演结果对冬小麦LAI的空间分布刻画地更为精细,符合盐渍土地区冬小麦长势空间变异强烈的特点,适用于盐渍土改良效果监测和评估,在盐渍土的改良利用中具有重要的推广应用价值。
参考文献 原文顺序
文献年度倒序
文中引用次数倒序
被引期刊影响因子
[本文引用: 1]
[本文引用: 1]
[本文引用: 1]
[本文引用: 1]
[本文引用: 1]
[本文引用: 1]
[本文引用: 1]
[本文引用: 1]
[本文引用: 1]
[本文引用: 1]
[本文引用: 1]
[本文引用: 1]
URLPMID:19662996 [本文引用: 1]

To investigate the effect of tetramethylpyrazine (TMP) with a certain concentration added to vitrification solution on peripheral nerve allografts regeneration.
URLPMID:19662996 [本文引用: 1]
To investigate the effect of tetramethylpyrazine (TMP) with a certain concentration added to vitrification solution on peripheral nerve allografts regeneration.
DOI:10.1186/s13007-019-0507-8URLPMID:31695729 [本文引用: 1]
The accurate estimation of rice LAI is particularly important to monitor rice growth status. Remote sensing, as a non-destructive measurement technology, has been proved to be useful for estimating vegetation growth parameters, especially at large scale. With the development of unmanned aerial vehicles (UAVs), this novel remote sensing platform has been widely used to provide remote sensing images which have much higher spatial resolution. Previous reports have shown that the spectral feature of remote sensing images could be an effective indicator to estimate vegetation growth parameters. However, the texture feature of high-resolution remote sensing images is rarely employed for this purpose. Besides, the physical mechanism between the texture feature and vegetation growth parameters is still unclear.
[本文引用: 1]
[本文引用: 1]
[本文引用: 1]
[本文引用: 1]
[本文引用: 1]
[本文引用: 1]
[本文引用: 1]
[本文引用: 1]
[本文引用: 1]
[本文引用: 1]
[本文引用: 1]
[本文引用: 1]
[本文引用: 1]
[本文引用: 1]
DOI:10.2134/jeq2005.0204URLPMID:16738391 [本文引用: 1]
In arid irrigated regions, the proportion of crop production under deficit irrigation with poorer quality water is increasing as demand for fresh water soars and efforts to prevent saline water table development occur. Remote sensing technology to quantify salinity and water stress effects on forage yield can be an important tool to address yield loss potential when deficit irrigating with poor water quality. Two important forages, alfalfa (Medicago sativa L.) and tall wheatgrass (Agropyron elongatum L.), were grown in a volumetric lysimeter facility where rootzone salinity and water content were varied and monitored. Ground-based hyperspectral canopy reflectance in the visible and near infrared (NIR) were related to forage yields from a broad range of salinity and water stress conditions. Canopy reflectance spectra were obtained in the 350- to 1000-nm region from two viewing angles (nadir view, 45 degrees from nadir). Nadir view vegetation indices (VI) were not as strongly correlated with leaf area index changes attributed to water and salinity stress treatments for both alfalfa and wheatgrass. From a list of 71 VIs, two were selected for a multiple linear-regression model that estimated yield under varying salinity and water stress conditions. With data obtained during the second harvest of a three-harvest 100-d growing period, regression coefficients for each crop were developed and then used with the model to estimate fresh weights for preceding and succeeding harvests during the same 100-d interval. The model accounted for 72% of the variation in yields in wheatgrass and 94% in yields of alfalfa within the same salinity and water stress treatment period. The model successfully predicted yield in three out of four cases when applied to the first and third harvest yields. Correlations between indices and yield increased as canopy development progressed. Growth reductions attributed to simultaneous salinity and water stress were well characterized, but the corrections for effects of varying tissue nitrogen (N) and very low leaf area index (LAI) are necessary.
DOI:10.1016/j.jag.2017.10.012URL [本文引用: 1]
[本文引用: 1]
[本文引用: 1]
URL [本文引用: 1]
As arable lands are highly limited and intensively exploited in China, it has become important to increase crop yield in low-to-medium yield farmlands in order to improve grain output. Forecasting crop yield few months before harvest using remote sensing technique has often been used in most crop yield estimation. In view of the above research condition, the potential productivities of main crops were estimated in low-to-medium yield farmlands in the Lowland Plains of Hebei, where is the area of scientific and technological demonstration of the Bohai Granary project. Using MODIS/NDVI remote sensing data (with 250 m resolution) and crop statistical data from 2000 to 2013 of different regions of the area, the spatiotemporal characteristics of the production areas of winter wheat and summer maize were estimated. A crop yield model was fitted using the least squares theory based on yield statistical data, accumulative annual NDVI and accumulative maxium NDVI for the period of 14 years. The crop yield estimation model used to estimate the potential yields of wheat and maize was a quadratic function. The results showed that: 1) the productivity of winter wheat was higher in Handan and Hengshui regions and lower in other regions of the study area. Even under improved production practices, productivity in the latter regions was always less than in the former regions. The productivity of maize was high in most of the study area even where potential productivity was difficult to attain. 2) The highest yield potential for both winter wheat and maize was in Handan region. The yield gap (the difference between potential yield and actual yield) for winter wheat was generally less than 10%, with an average of 356 kghm-2 (5.87%). Then the yield gap for maize was generally more than 10%, with an average of 798 kghm-2 (12.33%). Yield gaps were different for different regions in the study area. The ranked order for winter wheat in terms of yield gap by region was Langfang > Baoding > Cangzhou > Handan > Xingtai > Hengshui. Then that for maize was Xingtai > Handan > Baoding > Cangzhou > Hengshui > Langfang. 3) Based on the 14-year maximum accumulative NDVI, the maximum production gap (the difference of potential productivity and actual productivity) for both wheat and maize occurred in Cangzhou. In the low-to-medium yield farmlands in the Lowland Plains of Hebei, yield-increasing potential was 3.90 × 10⁸ kg for winter wheat and 9.62 × 10⁸ kg for maize. The total yield-increasing potential of both wheat and maize (13.52 × 10⁸ kg) was approximately 1/5 of the theoretical production gap of the two crops. In general, yield gap and production gap were both lower for winter wheat than for summer maize. Thus maize was the most important crop in terms of increasing future grain production in the study area. The method used in this study was applicable to various other crops at different scales, whose results were useful for decision-making and management policies.
DOI:10.1016/j.isprsjprs.2011.08.005URL [本文引用: 1]
A commercially available digital camera can be used in a low-cost automatic observation system for monitoring crop growth change in open-air fields. We developed a prototype Crop Phenology Recording System (CPRS) for monitoring rice growth, but the ready-made waterproof cases that we used produced shadows on the images. After modifying the waterproof cases, we repeated the fixed-point camera observations to clarify questions regarding digital camera-derived vegetation indices (VIs), namely, the visible atmospherically resistant index (VARI) based on daytime normal color images (RGB image) and the nighttime relative brightness index (NRBI(NIR)) based on nighttime near infrared (NIR) images. We also took frequent measurements of agronomic data such as plant length, leaf area index (LAI), and aboveground dry matter weight to gain a detailed understanding of the temporal relationship between the Vls and the biophysical parameters of rice. In addition, we conducted another nighttime outdoor experiment to establish the link between NRBI(NIR) and camera-to-object distance. The study produced the following findings. (1) The customized waterproof cases succeeded in preventing large shadows from being cast, especially on nighttime images, and it was confirmed that the brightness of the nighttime NIR images had spatial heterogeneity when a point light source (flashlight) was used, in contrast to the daytime RGB images. (2) The additional experiment using a forklift showed that both the ISO sensitivity and the calibrated digital number of the NIR (cDN(NIR)) had significant effects on the sensitivity of NRBI(NIR) to the camera-to-object distance. (3) Detailed measurements of a reproductive stem were collected to investigate the connection between the morphological feature change caused by the panicle sagging process and the downtrend in NRBINIR during the reproductive stages. However, these agronomic data were not completely in accord with NRBINIR in terms of the temporal pattern. (4) The time-series data for the LAI, plant length, and aboveground dry matter weight could be well approximated by a sigmoid curve based on NRBI(NIR) and VARI. The results confirmed that NRBI(NIR) was more sensitive to all of the agronomic data for overall season, including the early reproductive stages. VARI had an especially high correlation with LAI, unless yellow panicles appeared in the field of view. (C) 2011 International Society for Photogrammetry and Remote Sensing, Inc. (ISPRS) Published by Elsevier B.V.
[本文引用: 1]
[本文引用: 1]
[本文引用: 1]
[本文引用: 1]
[本文引用: 1]
URLPMID:20387431 [本文引用: 1]
In this study, near infrared reflectance spectroscopy (NIRS) was used to determine the organic carbon (OC), total nitrogen (TN), and C/N ratio in black soil of Northeast China. Based on the 3699-12000 cm(-1) NIRS of 136 black soil samples collected in 2004-2005, and by using partial least square (PLS), the related quantitative models were established. Leave-one-out cross validation showed that the OC and TN were well predicted, with the values of coefficient of determination (R2) being 0.92 and 0.91, RPD (the ratio of standard deviation of validation set to root mean square error of cross validation) being 3.45 and 3.36, and correlation coefficient (r) being 0.94 and 0.93 respectively, suggesting that NIRS had the potential to predict the OC and TN in black soil of Northeastern China. However, the C/N ratio was poorly predicted, with R2 = 0.61, RPD = 1.61, and r = 0.74, indicating that NIRS could not give reasonable prediction for the C/N ratio in black soil.
[本文引用: 1]
[本文引用: 1]
[本文引用: 1]
[本文引用: 1]
URL [本文引用: 1]
冬小麦叶面积指数(LAI, leaf area index)是评价其长势和预测产量的重要农学参数,高光谱遥感能够实现快速无损地监测叶面积指数。该文旨在将田间监测与高光谱遥感相结合,探索研究不同冬小麦叶面积指数高光谱反演方法的模拟精度及适应性。针对国际上普遍应用的2种高光谱遥感反演LAI模型方法,即回归分析法和BP神经网络法,在介绍2种LAI反演模型的基础上,选择位于黄淮海平原的山东省济南市长清区为研究区域,通过ASD地物光谱仪和SunScan冠层分析系统对冬小麦的冠层光谱及LAI变化进行田间观测,然后利用回归分析法和BP神经网络法构建冬小麦LAI反演模型,将模型估算LAI值和田间观测LAI值进行比对,分析评价2种方法的反演精度。结果表明,BP神经网络法较回归分析法估算冬小麦LAI的精度有较大提高,检验方程的决定系数(R2)为0.990、均方根误差(RMSE)为0.105。利用BP神经网络法构建反演模型能较好的对冬小麦LAI进行反演。研究结果可为不同冬小麦长势遥感监测提供理论和技术上的支持,并为大尺度传感器监测冬小麦长势和估产提供参考。
[本文引用: 1]
[本文引用: 1]
[本文引用: 1]
[本文引用: 1]
