 ,1, 蒋光毅2, 宋鸽1, 司承静3, 叶青11
 2
3
Effects of Soil Erosion on Physical and Mechanical Properties of Cultivated Layer of Purple Soil Slope Farmland
JIANG Na1, SHI DongMei,1, JIANG GuangYi2, SONG Ge1, SI ChengJing3, YE Qing1通讯作者:
责任编辑: 李云霞
收稿日期:2019-07-1接受日期:2019-10-21网络出版日期:2020-05-16
| 基金资助: |
Received:2019-07-1Accepted:2019-10-21Online:2020-05-16
作者简介 About authors
江娜,E-mail:m18725617837@163.com。

摘要
关键词:
Abstract
Keywords:
PDF (868KB)元数据多维度评价相关文章导出EndNote|Ris|Bibtex收藏本文
本文引用格式
江娜, 史东梅, 蒋光毅, 宋鸽, 司承静, 叶青. 土壤侵蚀对紫色土坡耕地耕层物理及力学特性的影响[J]. 中国农业科学, 2020, 53(9): 1845-1859 doi:10.3864/j.issn.0578-1752.2020.09.012
JIANG Na, SHI DongMei, JIANG GuangYi, SONG Ge, SI ChengJing, YE Qing.
0 引言
【研究意义】紫色土坡耕地主要分布在重庆市和四川省,是长江流域重要侵蚀带[1]。紫色土坡耕地土壤物理性质退化严重且力学性质高而出现板结现象,导致坡耕地耕层土壤发生退化[2]。耕层是指机械扰动土壤的深度层,通过耕作建立能协调水、肥、气和热,满足作物生长发育需要的土层[3,4,5,6,7,8],坡耕地耕层土壤是农业生产的根本,也是土壤侵蚀的对象[4]。因此,对紫色土坡耕地耕层物理及力学退化进行研究,可为紫色土坡耕地耕层土壤耕层质量退化过程与恢复调控提供技术参数。【前人研究进展】土壤侵蚀导致的坡耕地退化直接表现为坡耕地耕层变薄、土壤物理、化学性质恶化和土壤生产力下降等特征,对坡耕地生态安全具有很大的潜在危险性[5,6]。土壤物理退化主要表现在土层变薄、土壤结构恶化等方面[6],紫色土退化类型分为土壤物理性退化、土壤构造性退化和土壤营养性退化[7],紫色土坡耕地合理耕层建立以实现土壤侵蚀有效控制和土壤生产力稳定保持为目标,有效土层厚度、耕层厚度、土壤容重、土壤抗剪强度、土壤有机质、土壤入渗性可作为紫色土坡耕地耕层评价最小数据集[8]。因此国内外****从土壤侵蚀对土壤属性影响角度开展了广泛研究,如LARNEY和OYEDELE等[9,10]采取铲土0、5、10、15、20 cm和覆盖表土等措施的侵蚀模拟研究了坡耕地土壤侵蚀对土壤质量、土壤生产力的影响。国内****刘慧等[11]通过剥离黑土表层 0、5、10、15、 20、25 和 30 cm 土壤以模拟侵蚀厚度不同对耕层土壤生产力的变化,分析土壤侵蚀厚度对土壤理化性质影响。张瑞等[12]为探讨东北黑土区土壤侵蚀对土壤持水性能的影响,采用表土剥蚀方法,发现了土壤侵蚀与土壤入渗性能间的关系,随着侵蚀程度的增加,土壤初始入渗率、土壤渗透速率显著降低。陈奇伯等[13]对云南干热河谷坡耕地研究发现,表土未扰动小区的稳渗速率、初始渗速率均明显高于铲区不同侵蚀厚度表土层的小区,说明表土未扰动小区的土壤入渗性能均好于有不同程度土壤侵蚀的小区。成婧等[14]对渭北旱塬不同程度土壤侵蚀及生产力恢复试验研究发现,与未扰动土相比较,剥离表土10 cm和20 cm 的土壤容重均增加,孔隙度则减小,土壤侵蚀能够使土壤的物理性质恶化。【本研究切入点】不同土壤侵蚀程度可能会导致坡耕地耕层土壤物理、力学特性发生差异性变化,从而使土壤退化程度迥异,但土壤侵蚀与土壤退化两者间的定量关系不明确。因此本文采用铲土侵蚀模拟试验方法,设置不同侵蚀程度坡耕地地块,从土壤侵蚀-土壤物理力学性能变化-耕层侵蚀退化相互作用角度,对紫色土坡耕地耕层物理特性、力学特性退化过程及侵蚀所导致的坡耕地质量退化等级进行分析,并讨论了耕层退化条件下土壤可蚀性、潜在水土流失等级变化。【拟解决的关键问题】辨识在不同土壤侵蚀条件下,坡耕地耕层土壤物理、力学性能退化特征及土壤侵蚀影响耕层质量退化的程度、途径,分析坡耕地退化耕层的潜在水土流失危险性等级,为紫色土坡耕地侵蚀性耕层质量恢复调控提供技术参数。1 材料与方法
1.1 铲土侵蚀模拟试验小区设计
试验小区位于重庆市万州区,属亚热带季风气候,年平均气温17.7℃,年平均年日照时数1 484.4 h,年平均降水1 243 mm;土壤类型以紫色砂泥页岩母质上发育的中性紫色土为主,农作物种植制度为油菜/玉米。本试验采用人为铲土法[15,16,17],即人为铲去不同厚度的土层,然后对比铲土小区与未铲土小区土壤物理性质差异,如公式所示。式中,hi为原始i土层的厚度;d为多年平均侵蚀厚度,本文根据紫色丘陵区坡耕地径流小区观测结果,d取0.25 cm;m为耕层厚度,取20 cm;n为侵蚀年限,模拟侵蚀程度为 0、5、10、15和 20 cm,因此将原始土层在耕层(20 cm)以下以5 cm 为间隔分层。根据公式(1)计算出,侵蚀n年的不同侵蚀深度耕层土壤的构成(表1)。
Table 1
表1
表1不同侵蚀程度下坡耕地原位模拟小区的原始土层剩余厚度
Table 1
| 原始不同土层(hi) Original different soil layers (cm) | 模拟侵蚀深度/模拟侵蚀年限Simulated erosion depth (cm)/Simulated erosion age (a) | ||||
|---|---|---|---|---|---|
| 0/0 | 5/20 | 10/40 | 15/60 | 20/80 | |
| S-0 | S-5 | S-10 | S-15 | S-20 | |
| 0-20 | 20 | 15.55 | 12.09 | 9.40 | 5.50 |
| 20-25 | - | 4.45 | 3.46 | 2.69 | 3.90 |
| 25-30 | - | - | 4.45 | 3.46 | 2.69 |
| 30-35 | - | - | - | 4.45 | 3.46 |
| 35-40 | - | - | - | - | 4.45 |
新窗口打开|下载CSV
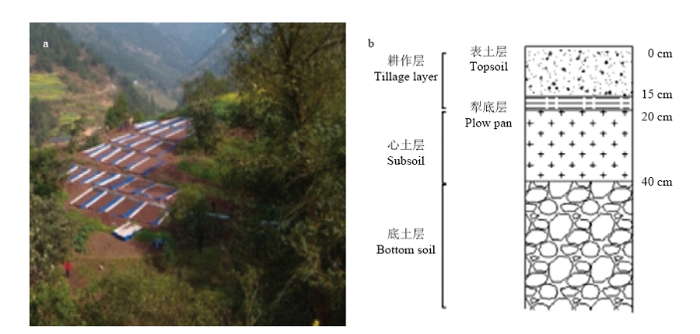
本试验小区共设5个侵蚀程度的处理,分别为:未侵蚀为对照组(CK)、侵蚀5 cm(S-5)、侵蚀10 cm(S-10)、侵蚀15 cm(S-15)、侵蚀20 cm(S-20),试验小区布设如图1-a所示,每个试验小区面积12 m2,田面坡度均为15°。
图1
 新窗口打开|下载原图ZIP|生成PPT
图1不同侵蚀程度的试验小区布设a.试验小区布设;b.耕作层特征[3,8] a. Layout of experimental plots; b. Characteristics of tillage layer
Fig. 1Layout of experimental plots with different erosion degrees
紫色土坡耕地的土体构型(图1-b)分为耕作层(0—20 cm)、心土层(20—40 cm)、底土层(>40 cm)。耕作层又分为表土层(0—15 cm)和犁底层(15—20 cm),耕作层和心土层可为作物提供生长需求。
1.2 样品采集与分析
铲土侵蚀模拟试验小区建于2018年2月,在4月采集土样,采样时间为雨后放晴3 d以上。在铲土侵蚀模拟试验小区内采集土样,以0—10、10—20、20—30、30—40 cm分层采样,样品用塑料薄膜密封,各土层分别用环刀(100 cm3)法[18]测定土壤容重、总孔隙度、土壤毛管孔隙度、土壤初始入渗速率、土壤稳定入渗速率、土壤平均入渗速率;土壤砂粒、粉粒、黏粒测定采用吸管法[18];土壤抗剪强度采用便携式三头抗剪仪(14.10 Pocket Vane Tester 型,荷兰)进行测定;土壤紧实度采用土壤紧实度测定仪(TJSD- 750-II)进行测定[18]。1.3 数据分析方法
(1)土壤退化特征分析土壤退化指数(SDI)可以定量地反映土壤退化和改善程度,根据ADEJUWON等[19]提出的土壤退化指数的计算公式,计算公式如下:
式中,SDI为土壤退化指数,xij是第i个侵蚀程度第j个土壤物理指标值,xcj是第j个物理指标的参照值,n为纳入计算的指标值。本研究中以CK的土壤理化指标值作为S-5、S-10、S-15、S-20的参照值,试验实际选取土壤紧实度、土壤抗剪强度、土壤饱和导水率、土壤初始入渗率、平均入渗率、稳定入渗率总计6个指标,由此计算出SDI,SDI是6个土壤指标的综合计算结果,可反映土壤侵蚀程度对紫色土坡耕地土壤退化状况,SDI>0,正值表明土壤质量有所改善,SDI<0,代表土壤退化程度高于参照点,其值越小,退化越重。
(2)土壤可蚀性分析
本文采用SHIRAZI等[20]公式法计算土壤可蚀性K值,计算公式如下:
式中,fi为原土壤中第i个粒径级质量分数(%);mi为第i个粒径级两端数值的算术平均值(mm);K值为美国制,计算后将K值乘以0.1317,转为国际制单位:t·hm2·h·MJ-1·mm-1·hm-2。
(3)数据处理
主成分分析是通过降维将多个指标转化为少数指标,消除多重指标间的相关性,使彼此之间具有独立性[21]。运用SPSS 24对评价指标进行主成分分析,计算评价指标的Norm值。Norm值为该指标在由成分组成的多维空间中矢量常模的长度,长度越长,表明该指标在所有主成分的综合载荷越大,其解释综合信息的能力就越强。Norm值计算公式如下:
式中,Nik是第i个指标在特征值≥1的前k个主成分上的综合载荷;uik是第i个指标在第k个主成分上的载荷;λk是第k个主成分的特征值。分别计算各组指标Norm值,选取每组中Norm值最大的指标进入土壤退化指数的计算。
采用SPSS 24、EXCEL 2019统计软件对总孔隙度、毛管孔隙度、抗剪强度等指标进行分析,利用Canoco 4.5进行不同土壤侵蚀程度下土壤物理性质分析。
2 结果
2.1 坡耕地耕层土壤入渗性能变化特征
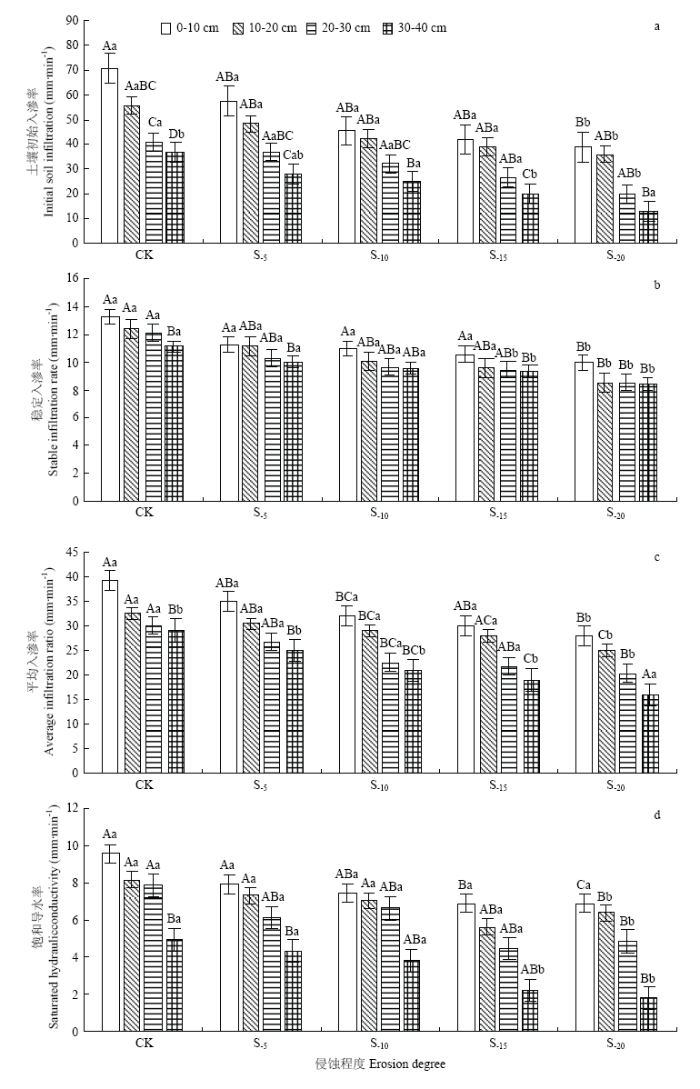
不同侵蚀程度下紫色土坡耕地土壤渗透性变化规律相似,均表现为:土壤初始入渗率>平均入渗率>稳定入渗率。不同侵蚀程度下初始入渗率差异显著(P<0.05),由图2-a可知,不同侵蚀程度条件下,S-5、S-10、S-15、S-20处理比对照组初始入渗率分别下降了16.36%、28.93%、37.41%、47.11%。随着侵蚀程度增加,土壤初始入渗率逐渐减小。在0—20 cm耕层中,CK土壤初始入渗率最大(63.24 mm·min-1),S-20土壤初始入渗率最小(37.50 mm·min-1);在20—40 cm心土层中,CK土壤初始入渗率最大(38.86 mm·min-1),S-20土壤初始入渗率最小(16.50 mm·min-1);CK与S-20土壤初始入渗率差异显著(P<0.05)。在S-20条件下,0—10 cm土层初始入渗率与30—40 cm土层相比下降了66.66%,0—10 cm土层与30—40 cm土层初始入渗率差异显著(P<0.05),表明随着土层深度增加,土壤入渗性能降低。图2
 新窗口打开|下载原图ZIP|生成PPT
图2不同侵蚀程度下土壤入渗性能的变化特征
不同大写字母表示同一垂直层次不同侵蚀程度差异显著(P<0.05),不同小写字母表示同一侵蚀程度不同垂直层次差异显著(P<0.05)。
Fig. 2Change characteristics of soil infiltration under different erosion degrees
Different uppercase letters indicate significant differences in erosion degree of the same vertical layer (P<0.05), different small letters indicate significant differences in the same erosion degree of different vertical layers (P<0.05). The same as
不同侵蚀程度下稳定入渗率差异显著,由图2-b可知,S-5、S-10、S-15、S-20比对照组稳定入渗率分别减少了12.75%、17.74%、20.42%、27.42%,土壤稳定入渗率随着侵蚀程度增加呈减小趋势。在0—20 cm耕层中,CK土壤稳定入渗率最大(12.84 mm·min-1),S-20土壤稳定入渗率最小(9.27 mm·min-1);在20—40 cm心土层中,CK土壤稳定入渗率最大(11.60 mm·min-1),S-20土壤稳定入渗率最小(8.47 mm·min-1)。在0—10、10—20、20—30cm土层中,CK与S-20土壤稳定入渗率差异显著(P<0.05);在30—40 cm土层中,各侵蚀程度的土壤稳定入渗率差异不显著。不同侵蚀程度下,土壤稳定入渗率随着土层深度的增加呈减小的趋势。
不同侵蚀程度下平均入渗率差异显著,由图2-c可知,S-5、S-10、S-15、S-20比对照组平均入渗率分别减小了10.46%、20.06%、24.49%、31.71%,CK与S-20土壤平均入渗率差异显著(P<0.05)。在0—20 cm耕层中,CK土壤平均入渗率最大(35.84 mm·min-1),S-20平均入渗最小(26.50 mm·min-1);在20—40 cm心土层中,CK土壤平均入渗最大(29.60 mm·min-1),S-20土壤平均入渗最小(18.19 mm·min-1)。对于同一侵蚀程度条件下,在S-15条件下,30—40 cm土层土壤平均入渗率与0—10、10—20、20—30 cm土层土壤平均入渗率相比分别减少了36.67%、47.37%、14.84%。在S-20处理下,30—40 cm土层土壤平均入渗率与0—10、10—20、20—30 cm土层土壤平均入渗率相比分别减少了42.86%、56.35%、27.33%,0—10 cm与30—40 cm土层土壤平均入渗率差异显著(P<0.05),因此对于不同侵蚀程度下,土壤平均入渗率随着土层深度的增加呈减小的趋势。
不同侵蚀程度处理下饱和导水率差异显著,由图2-d可知,与对照相比,S-5、S-10、S-15、S-20土壤饱和导水率减小了16.00%、18.43%、37.27%、34.88%,CK与S-15、S-20土壤饱和导水率差异显著(P<0.05)。在0—20 cm耕层中,CK土壤饱和导水率最大(8.87 mm·min-1),S-15土壤饱和导水率最小(6.25 mm·min-1);在20—40 cm心土层中,CK土壤饱和导水率最大(6.41 mm·min-1),S-20土壤饱和导水率最小(3.31 mm·min-1)。对于不同蚀程度下,土壤饱和导水率大小依次为:0—10 cm>10—20 cm>20—30 cm>30—40 cm,0—10 cm土层与30—40 cm的土壤饱和导水率差异显著(P<0.05),土壤导水率随土层深度增加呈减小趋势。
以饱和导水率(X1)、初始入渗率(X2)、稳定入渗率(X3)、平均入渗率(X4)为评定指标进行主成分分析,综合比较不同侵蚀程度下不同土层土壤入渗性能。从表2可知,第一个主成分的方差累积贡献率达71.06%,即涵盖了大部分信息,根据因子得分系数矩阵,F1、F2为两个主成分,其主成分方程为f=0.730F1+0.270F2,通过方程计算了不同侵蚀程度的上下层土壤渗透性得分,并进行排序(表2,表3),并根据得分进行土壤退化分级,土壤退化程度分为4个等级,未退化(>1),轻度退化(0—1),中度退化(-1—0),重度退化(-2—-1)。由表可知不同处理土壤入渗性能存在差异,在0—10 cm土层中S-15表现最差。在10—20 cm土层中S-10、S-15表现最差,在20—30 cm、30—40 cm土层中S-15、S-20表现最差。在0—40 cm土层中CK表现最优。从平均得分来看,土壤渗透性能随着侵蚀程度增加呈减小趋势。
Table 2
表2
表2不同侵蚀程度下耕层土壤渗透性能主成分分析
Table 2
| 主成分 Principal component | Norm值 Norm value | ||
|---|---|---|---|
| F1 | F2 | ||
| X1饱和导水率Saturated hydraulic conductivity | 0.021 | 0.997 | 1.02 |
| X2初始入渗率Initial soil infiltration | 0.978 | 0.125 | 1.64 |
| X3稳定入渗率Stable infiltration rate | 0.939 | -0.161 | 1.58 |
| X4平均入渗率Average infiltration ratio | 0.982 | 0.008 | 1.64 |
| 主成分特征值Principal component eigenvalue | 2.802 | 1.036 | - |
| 主要方差贡献率Contribution rate of major variance | 70.06 | 25.91 | - |
| 主要成分累积贡献率Cumulative contribution rate of major components | 70.06 | 95.97 | - |
新窗口打开|下载CSV
Table 3
表3
表3不同侵蚀程度下耕层土壤渗透性能排序
Table 3
| 处理 Manage | 0-10 cm | 10-20 cm | 20-30 cm | 30-40 cm | 平均得分 The average score | 排序 The sorting | 退化程度 Degradation | ||||
|---|---|---|---|---|---|---|---|---|---|---|---|
| 得分 Score | 排序 The sorting | 得分 Score | 排序 The sorting | 得分 Score | 排序 The sorting | 得分 Score | 排序 The sorting | ||||
| CK | 3.06 | 1.00 | 1.23 | 1.00 | 0.50 | 2.00 | 0.25 | 2.00 | 1.26 | 1 | 未退化 Non degradation |
| S-5 | 1.53 | 1.00 | 0.90 | 2.00 | -0.07 | 3.00 | -0.78 | 3.00 | 0.40 | 2 | 轻度退化 Mild degradation |
| S-10 | 0.72 | 2.00 | 0.38 | 2.00 | 0.05 | 2.00 | -0.74 | 3.00 | 0.10 | 2 | 轻度退化 Mild degradation |
| S-15 | 0.19 | 2.00 | -0.13 | 3.00 | -1.25 | 4.00 | -1.64 | 4.00 | -0.71 | 3 | 中度退化 Moderate degradation |
| S-20 | 0.06 | 2.00 | -0.41 | 3.00 | -1.59 | 4.00 | -2.08 | 4.00 | -1.01 | 4 | 重度退化 Severe degradation |
新窗口打开|下载CSV
2.2 坡耕地耕层土壤力学特性变化特征
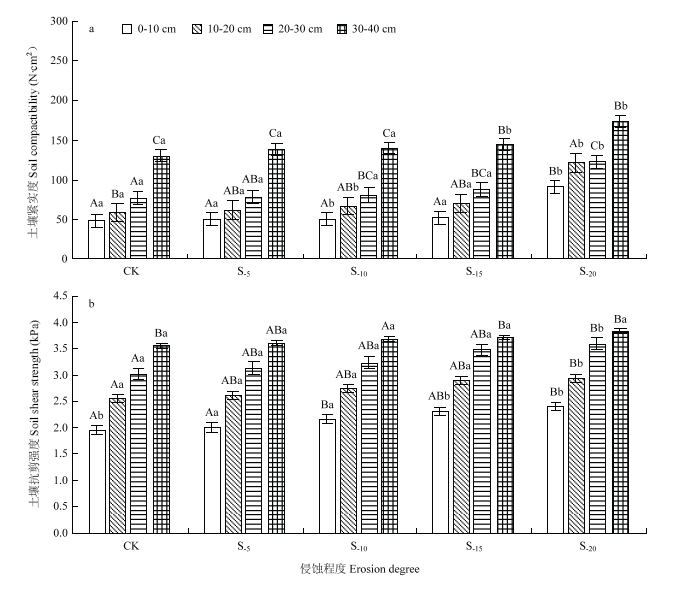
图3表明,不同侵蚀程度土壤抗剪强度差异显著,S-5、S-10、S-15、S-20土壤抗剪强度与对照相比分别增加2.33%、6.75%、11.81%、15.24%,土壤抗剪强度随着侵蚀程度的增加呈增加的趋势。在耕层0—20 cm中,CK抗剪强度最小值为2.77 kPa,S-20抗剪强度在0—20 cm耕层的最大值为3.10 kPa;在20—40 cm心土层中,CK抗剪强度最小值为3.28 kPa,S-20抗剪强度在耕层最大值为3.72 kPa,CK与S-10/S-20土壤抗剪强度差异显著(P<0.05),20—40 cm土层的土壤抗剪强度高于0—20 cm土层的抗剪强度;S-10与S-20土壤抗剪强度差异显著(P<0.05)。CK、S-5、S-10、S-15、S-20条件下0—10 cm与30—40 cm土层的抗剪强度差异显著(P<0.05)。图3
 新窗口打开|下载原图ZIP|生成PPT
图3不同侵蚀程度下耕层土壤力学特性变化特征
Fig. 3Change characteristics of soil mechanical properties in tillage layer under different erosion degrees
不同侵蚀程度下土壤紧实度差异显著,S-5、S-10、S-15、S-20土壤抗剪强度与对照相比分别增加4.92%、8.01%、13.32%、63.11%,CK与S-15、S-20差异显著(P<0.05)。在0—20 cm土层中,CK的土壤紧实度最小值为53 N·cm2,S-20的土壤紧实度最大值为106.17 N·cm2;在20—40 cm土层中,CK的土壤紧实度最小值为103 N·cm2,S-20的土壤紧实度最大值为148.29 N·cm2,20—40 cm土壤紧实度高于0—20 cm的紧实度,不同侵蚀程度下,0—10 cm与30—40 cm土层的土壤紧实度差异显著(P<0.05)。
2.3 坡耕地耕层土壤物理性质相关性变化特征
由表4可知,紫色土坡耕地土壤渗透性4个指标与土壤总孔隙度、毛管孔隙度、粉粒含量显著正相关(P<0.01),与土壤容重、砂粒含量、黏粒含量显著负相关(P<0.01)。以紫色土坡耕地物理指标土壤容重(Z1)、土壤总孔隙度(Z2)、毛管孔隙度(Z3)、砂粒(Z4)、粉粒(Z5)、黏粒(Z6)为自变量,饱和导水率(X1)、初始入渗率(X2)、平均入渗率(X3)、稳定入渗率(X4)为因变量,进行逐步回归分析,得到土壤入渗性能4个指标指导因子方程:X1=-3.570+ 0.141Z5-0.1042Z4,X2=213.895-123.493Z1,X3=100.607- 51.588Z1,X4=-2.975+0.240Z5。表明了不同侵蚀程度处理下使土壤物理性质发生改变,使得土壤渗透性发生变化。Table 4
表4
表4坡耕地土壤物理性质相关性分析
Table 4
| 土壤容重 Soil bulk density | 土壤总 孔隙度 Soil total porosity | 毛管孔 隙度 Soil capillary porosity | 砂粒Sand | 粉粒 Silt | 黏粒 Clay | 饱和导 水率 Saturated hydraulic conductivity | 初始入 渗率 Initial soil infiltration | 平均 入渗率 Average infiltration rate | 稳定入 渗率 Stable infiltration rate | 抗剪强度 Soil shear strength | 土壤紧 实度 Soil compactibility | |
|---|---|---|---|---|---|---|---|---|---|---|---|---|
| Z1 | 1 | |||||||||||
| Z2 | -1.000** | 1 | ||||||||||
| Z3 | -0.696** | 0.698** | 1 | |||||||||
| Z4 | 0.655** | -0.655** | -0.517* | 1 | ||||||||
| Z5 | -0.770** | 0.770** | 0.549* | -0.978** | 1 | |||||||
| Z6 | 0.880** | -0.881** | -0.741** | 0.429 | -0.561* | 1 | ||||||
| X1 | -0.859** | 0.858** | 0.697** | -0.774** | 0.841** | -0.824** | 1 | |||||
| X2 | -0.924** | 0.923** | 0.763** | -0.709** | 0.789** | -0.873** | 0.947** | 1 | ||||
| X3 | -0.750** | 0.749** | 0.595** | -0.814** | 0.843** | -0.614** | 0.853** | 0.857** | 1 | |||
| X4 | -0.935** | 0.934** | 0.788** | -0.684** | 0.766** | -0.865** | 0.909** | 0.973** | 0.872** | 1 | ||
| Y5 | 0.889** | -0.890** | -0.696** | 0.435 | -0.572** | 0.991** | -0.840** | -0.889** | -0.644** | -0.876** | 1 | |
| Y6 | 0.769** | -0.770** | -0.968** | 0.547* | -0.606** | 0.840** | -0.758** | -0.825** | -0.668** | -0.841** | 0.807** | 1 |
新窗口打开|下载CSV
由表4可知,土壤力学性质2个指标与土壤容重、土壤黏粒显著正相关(P<0.01),与土壤总孔隙度、土壤毛管孔隙度、粉粒含量与土壤紧实度显著负相关(P<0.01),以紫色土坡耕地物理指标土壤容重(Z1)、总孔隙度(Z2)、毛管孔隙度(Z3)、砂粒(Z4)、粉粒(Z5)、黏粒(Z6)为自变量,土壤紧实度(Y5)、抗剪强度(Y6)为因变量,进行逐步回归分析,得到土壤力学特性2个指标的指导因子方程:Y5=-57.046+ 6.687Z6,Y6=0.584+0.104Z6。
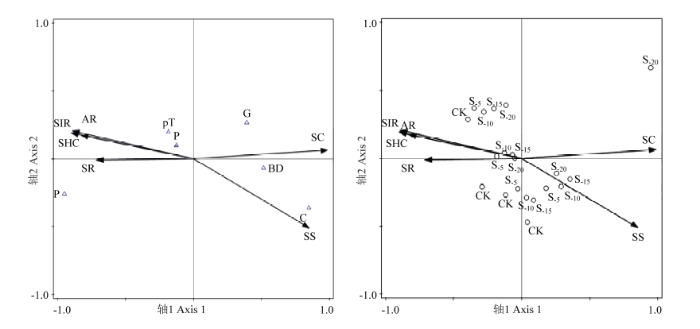
土壤侵蚀程度与土壤物理性质CCA排序统计结果表明,第一、第二排序轴特征值分别为0.0023、0.0004,第一轴第二轴特征值大,信息包含的土壤物理性质多,所有排序轴的特征值和为0.000309,解释变量占94.85%,调整解释变量92.50%,前四轴土壤侵蚀程度与土壤物理性质相关系数均在70.00%以上,通过蒙特卡罗置换检验,第一排序轴和所有排序轴的显著性P值均为0.002,达到非常显著性水平,说明样本间差异由抽样误差所致的概率较小,与其土壤物理性质因子间的关系较为密切。表明土壤物理及力学性质排序结果能解释土壤侵蚀程度与土壤物理性质及力学特性的关系。
从排序结果可知,排序图中各物理及力学性质的空间聚集性反映了土壤侵蚀程度对土壤退化作用的影响。在物理性质及力学性质排序图分布上可知,沿逆时针方向来看,未退化主要分布在第二象限,轻度退化点主要分布在第三象限,中度退化点、重度退化点主要分布在第四象限。
根据图4可知,从箭头长度而言,土壤抗剪强度与土壤紧实度呈正相关,土壤抗剪强度与稳定入渗率呈负相关。土壤抗剪强度、土壤紧实度、初始入渗率对第一轴的贡献率很大,土壤抗剪强度与第一轴呈负相关关系。这可能是土壤侵蚀导致土壤抗剪强度增加,土壤紧实度增加,土壤出现板结现象。因此,土壤抗剪强度是不同侵蚀程度耕层物理性质及力学特性变化的主要因素,土壤紧实度、初始入渗率是不同侵蚀程度耕层物理性质及力学特性变化的次要因素。从箭头与土壤物理性质第一排序轴的夹角分析,不同侵蚀程度对入渗、力学性质的影响相关性排序为:稳定入渗率>土壤紧实度>饱和导水率>平均入渗率>初始入渗率>抗剪强度,土壤力学指标与土壤入渗性指标显著负相关。
图4
 新窗口打开|下载原图ZIP|生成PPT
图4不同侵蚀程度下耕层土壤物理性质排序图
SHC:饱和导水率Saturated hydraulic conductivity;SS:抗剪强度Soil shear strength;SC:土壤紧实度 Soil compactibility;SIR:初始入渗率Initial soil infiltration;SR:稳定入渗率Stable infiltration rate;AR:平均入渗率Average infiltration rate;G:砂粒Sand;P:粉粒 Silt;C:黏粒Clay;BD:土壤容重Soil bulk density;pT:土壤总孔隙度Soil total porosity;P:土壤毛管孔隙度Soil capillary porosity
Fig. 4Soil physical properties of tillage under different erosion degrees
2.4 坡耕地耕层土壤退化特征
紫色土坡耕地耕层土壤退化采用土壤物理及力学指标反映,由表5的坡耕地耕层土壤退化指标描述性统计分析可知,变异系数(CV)主要反映土壤退化特征的空间变异性及敏感性,变异系数越大,说明评价土壤退化特征差异性越敏感[21]。由表6可知,饱和导水率、土壤紧实度为中度敏感指标(40%—100%),是土壤退化发生的主要目标。初始入渗率、稳定入渗率、平均入渗率、砂粒、抗剪强度、毛管孔隙度、黏粒属于低敏感指标(10%—40%),是土壤退化作用中的稳定因素,其中土壤容重、土壤总孔隙度、粉粒变异系数相对比较低,接近不敏感(CV<10%)。K-S检验结果表明,土壤退化各项指标均服从正态分布(P>0.05)。在坡耕地土壤质量评价中,可定量评价土壤质量时选择中度敏感指标[22,23]。由于砂粒(2.66)、毛管孔隙度(2.53)Norm值较低,而黏粒的相关性低于稳定入渗率,因此选取饱和导水率、土壤紧实度、初始入渗率、稳定入渗率、平均入渗率、抗剪强度进行土壤退化指数的计算。Table 5
表5
表5不同侵蚀程度下紫色土坡耕地耕层土壤物理性质排序统计结果
Table 5
| Axis 1 | Axis 2 | Axis 3 | Axis 4 | |
|---|---|---|---|---|
| 特征值Eigenvalue | 0.0023 | 0.0004 | 0.0003 | 0 |
| 解释变异(累计)Explained variation (cumulative) | 73.50 | 86.03 | 94.57 | 94.85 |
| Pseudo-canonical相关性Pseudo-canonical correlation | 0.9950 | 0.9847 | 0.8347 | 0.7174 |
| 解释拟合变异(累积)Explained fitted variation (cumulative) | 77.48 | 90.70 | 99.70 | 100.00 |
新窗口打开|下载CSV
Table 6
表6
表6紫色土坡耕地耕层土壤退化指标统计分析特征
Table 6
| 评价指标 Evaluation index | 初始 入渗率 Initial soil infiltration (mm·min-1) | 稳定入渗率 Stable infiltration rate (mm·min-1) | 平均入渗率 Average infiltration rate (mm·min-1) | 饱和导水率 Saturated hydraulic conductivity (mm·min-1) | 抗剪强度 Soil shear strength (kPa) | 土壤紧实度 Soil compactibility (N·cm2) | 土壤 容重 Soil bulk density (g·cm-3) | 土壤总 孔隙度 Soil total porosity (%) | 毛管孔隙度 Soil capillary porosity (%) | 粉粒 Silt (%) | 砂粒 Sand (%) | 黏粒 Clay (%) |
|---|---|---|---|---|---|---|---|---|---|---|---|---|
| 最大值 Maximum value | 70.75 | 13.29 | 39.29 | 4.00 | 3.84 | 251.50 | 1.58 | 52.33 | 36.29 | 66.67 | 36.77 | 32.33 |
| 最小值 Minimum value | 13.00 | 8.42 | 16.00 | 0.25 | 1.96 | 49.98 | 1.26 | 40.38 | 7.95 | 49.00 | 16.67 | 14.33 |
| 平均值 Average value | 37.79 | 10.30 | 27.04 | 1.86 | 2.97 | 96.06 | 1.43 | 46.19 | 30.58 | 55.39 | 29.62 | 22.9 |
| 标准差 Standard deviation | 13.92 | 1.31 | 5.75 | 1.17 | 0.61 | 46.25 | 0.10 | 3.91 | 6.29 | 4.61 | 5.03 | 5.81 |
| 变异系数 Coefficient of variation (%) | 36.84 | 12.71 | 21.27 | 63.03 | 20.56 | 48.15 | 7.31 | 8.47 | 20.56 | 8.31 | 17.00 | 25.37 |
| 峰度Kurtosis | 0.46 | 0.02 | -0.12 | -0.83 | -1.27 | 6.09 | -1.38 | -1.39 | 8.87 | 0.41 | 0.89 | -1.26 |
| 偏度Skewness | 0.43 | 0.60 | 0.03 | 0.15 | -0.2 | 2.09 | 0.13 | -0.13 | -2.74 | 0.69 | -0.74 | 0.06 |
| K-S检验 K-S test | 0.20 | 0.20 | 0.20 | 0.11 | 0.20 | 0.08 | 0.15 | 0.14 | 0.22 | 0.20 | 0.20 | 0.20 |
| Norm值 Norm value | 3.04 | 2.70 | 3.03 | 2.94 | 2.81 | 2.73 | 2.94 | 2.94 | 2.53 | 2.44 | 2.66 | 2.80 |
新窗口打开|下载CSV
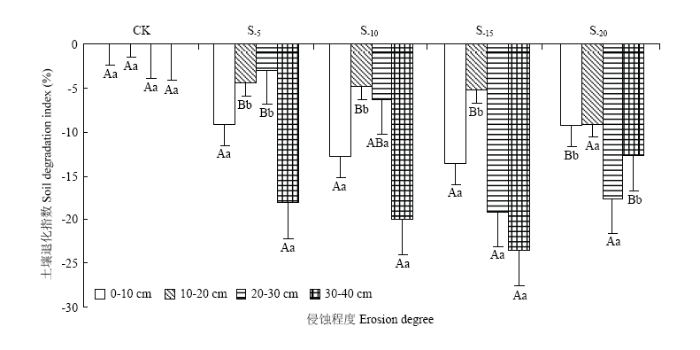
不同侵蚀程度下土壤退化指数变化特征为(图5):S-5处理为-8.71%,S-10为-10.95%,S-20为-12.17%,S-15为-15.37%,S-5与S-20差异显著(P<0.05)。随着侵蚀程度的增加土壤退化指数呈先减小后增加的趋势。在0—20 cm耕层,S-15土壤退化指数最小(-9.42%),S-5土壤退化指数最大(-6.81%);在20—40 cm心土层,S-5土壤退化指数最大(-10.60%),S-15土壤退化指数最小(-21.33%)。S-15条件下耕层土壤退化指数高于心土层的土壤退化指数,而S-5、S-10、S-20耕层(0—20 cm)土壤退化指数高于心土层(20—40 cm)土壤退化指数。根据土壤退化指数将土壤退化等级等距划分为未退化(0)、轻度退化(-7—0)、中度退化(-14— -7)、重度退化(>-14)。
图5
 新窗口打开|下载原图ZIP|生成PPT
图5不同侵蚀程度下耕层土壤退化指数变化特征
Fig. 5Change characteristics of soil degradation index in tillage layer under different erosion degrees
对于不同侵蚀程度下,土壤退化指数随着土层深度增加呈先增加后减小的趋势。在S-5处理下,土壤退化指数表现为:20—30 cm>10—20 cm>0—10 cm>30—40 cm;在S-10处理下,土壤退化指数表现为:10—20 cm>20—30 cm>0—10 cm>30—40 cm;S-15条件下,土壤退化指数表现为:10—20 cm>0—10 cm土层>20—30 cm>30—40 cm,表明了侵蚀S-5、S-10对0—30 cm土层影响较大。S-15对0—20 cm土层土壤影响较大,在S-20条件下,土壤退化指数表现为:10—20 cm>0—10 cm>30—40 cm>20—30 cm,表明了S-20对0—40 cm土层影响最大,S-5、S-10、S-15、S-20 条件下,0—10 cm土层与10—20 cm土层土壤退化指数差异显著(P<0.05)。
3 讨论
3.1 耕层土壤可蚀性K值变化特征分析
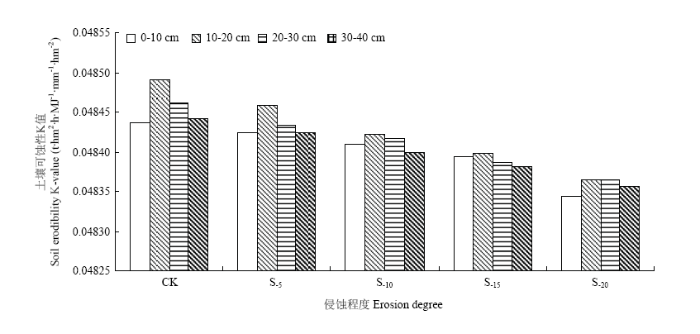
土壤可蚀性K值可表征土壤被侵蚀的难易程度,反映土壤潜在水土流失等级,是土壤侵蚀预测的敏感指标之一[24]。本研究表明土壤侵蚀程度直接或间接影响土壤颗粒组成、土壤孔隙特征分布及大小,导致土壤容重变大,土壤紧实化,并导致土壤渗透性下降,最终导致水土流失的发生。本研究发现可蚀性K值与砂粒呈负相关,与粉粒正相关,而与黏粒含量不相关,与前人研究不同[25],其原因为:土壤侵蚀程度增加,土壤中的细颗粒优先迁移,粗颗粒相对集中,土壤质地发生粗化,土壤侵蚀程度越大,黏粒含量减小,且对可蚀性K值影响较小。随着侵蚀程度增加,土壤可蚀性K值减小,土壤容重增加,土壤紧实化,土壤入渗性降低的原因可能为:一是由于剥蚀掉疏松表层土壤,下层紧实土壤露出;二是坡面径流带走耕层土壤细小颗粒,土壤大颗粒遗留在表层,引起土壤粗化;三是侵蚀程度越大,导致土壤容重增加和土壤孔隙特征变差。土壤退化指数呈现S-15低于S-20,可能原因为:一是紫色土土层浅薄,容易被侵蚀,深层土壤出现高度紧实化;二是由于侵蚀程度的不同,导致S-15比S-20退化严重。由图6可知,土壤可蚀性K值在0.04726— 0.04769 t·hm2·h·MJ-1·mm-1·hm-2之间变化。土壤可蚀性K值的变异性随土壤侵蚀程度加剧呈现出线性递减趋势(R2=0.9934),随着土壤侵蚀程度的增加,土壤可蚀性K值呈减小趋势,与周宁[26]研究结果相同。对于同一侵蚀程度,在30—40 cm、20—30 cm土壤可蚀性K值与0—10 cm、10—20 cm土层土壤可蚀性K值降幅为0.001%—0.064%,土壤可蚀性K值随土层深度增加呈先增加后减小的趋势,该结果与ZHANG等[27]的研究结果一致。图6
 新窗口打开|下载原图ZIP|生成PPT
图6不同侵蚀程度下耕层土壤可蚀性K值变化特征
Fig. 6Change characteristics of soil erodibility K value in tillage layer under different erosion degrees
3.2 耕层潜在水土流失特征分析
潜在水土流失等级是预防土壤退化的重要依据[28]。国内外土壤侵蚀与土壤理化特性相互关系研究表明,通过土壤物理性质可以评价土壤潜在水土流失等级强弱[29]。土壤渗透性能的好坏直接关系到地表产流量的大小,对土壤潜在水土流失等级影响很大[30]。许多****把土壤渗透性作为反映土壤潜在水土流失等级的重要因素进行研究,甚至直接利用土壤渗透性来表征土壤潜在水土流失等级。土壤渗透性能越好,地表径流就会减少,土壤的流失量也会相应减少[31]。土壤紧实是由于孔隙空间的降低使土壤颗粒排列紧密,使适于作物生长的土壤三相比结构改变,进而导致土壤体积质量增加的过程,是耕地质量恶化的综合表征。稳定入渗率、土壤紧实度是表征黄土丘陵区潜在水土流失等级的关键指标[32],但目前土壤渗透性与潜在水土流失等级的关系研究往往都是定性的描述,定量分析较少。因此选用土壤稳定入渗率作为土壤渗透性指标表征土壤潜在水土流失等级。根据图3可知,稳定入渗率>土壤紧实度>饱和导水率>平均入渗率>初始入渗率>抗剪强度,土壤稳定入渗率、土壤紧实度相关性最大,因此选定土壤稳定入渗率、土壤紧实度确定土壤潜在水土流失等级。本文以0—10 cm、10—20 cm土层的土壤稳定入渗率、土壤紧实度进行确定坡耕地耕层土壤潜在水土流失等级(表7),土壤入渗性等级增加,土壤潜在水土流失等级减小,土壤紧实度等级增加,土壤潜在水土流失等级增加。Table 7
表7
表7基于土壤稳定入渗率与土壤紧实度确定坡耕地耕层土壤潜在水土流失等级
Table 7
| 土壤稳定入渗率 Soil stable infiltration rate | 土壤紧实度Soil compactibility | ||||
|---|---|---|---|---|---|
| 1 | 2 | 3 | 4 | 5 | |
| 1 | 1 | M1 | M2 | M4 | M5 |
| 2 | F3 | 2 | M2 | M3 | M4 |
| 3 | F3 | F3 | 1 | M2 | M1 |
| 4 | F2 | F2 | F2 | 2 | M1 |
| 5 | F1 | F1 | F1 | M1 | 1 |
新窗口打开|下载CSV
结合表7、表8可知不同侵蚀程度处理下坡耕地土壤退化指标存在明显差异,由稳定入渗率、土壤紧实度确定土壤潜在水土等级可知,在0—10 cm土层中,S-20土壤水土流失等级为中度,在0—10 cm和10—20 cm土层中,CK土壤潜在水土流失等级为极弱。
Table 8
表8
表8不同侵蚀程度下坡耕地耕层潜在水土流失等级
Table 8
| 处理 Manage | 土层 Soil horizon (cm) | 稳定入渗率 Soil stable infiltration rate | 土壤紧实度 Soil compactibility | 土壤潜在水土流失等级 Soil degradation grade |
|---|---|---|---|---|
| CK | 0-10 | 5 | 1 | F1 |
| 10-20 | 5 | 1 | F1 | |
| S-5 | 0-10 | 3 | 1 | F3 |
| 10-20 | 3 | 1 | F3 | |
| S-10 | 0-10 | 3 | 1 | F3 |
| 10-20 | 2 | 1 | 1 | |
| S-15 | 0-10 | 3 | 1 | F3 |
| 10-20 | 2 | 1 | 1 | |
| S-20 | 0-10 | 2 | 1 | F3 |
| 10-20 | 1 | 1 | 1 |
新窗口打开|下载CSV
4 结论
4.1 紫色土坡耕地不同侵蚀程度的土壤入渗性能差异显著,随着侵蚀程度加剧土壤渗透性降低,即CK>S-5>S-10>S-15>S-20。与CK处理相比,S-20的土壤渗透性能降幅在27.42%—47.11%之间,S-20土壤渗透性能最差。不同侵蚀程度下0—20 cm土层土壤入渗性能高于20—40 cm土层,且土壤初始入渗率>稳定入渗率>平均入渗率>饱和导水率。4.2 紫色土坡耕地不同侵蚀程度的土壤力学性能差异显著,随着侵蚀程度加剧土壤紧实度、土壤抗剪强度呈增加趋势,即CK<S-5<S-10<S-15<S-20,S-20土壤抗剪强度、土壤紧实度最大。土壤力学特性增加是导致紫色土坡耕地耕层土壤物理退化的主要原因。不同侵蚀程度下坡耕地20—40 cm土层的土壤力学性能高于0—20 cm土层。
4.3 紫色土坡耕地土壤物理性质及力学特性与第一排序轴相关性排序为稳定入渗率>土壤紧实度>饱和导水率>平均入渗率>初始入渗率>抗剪强度。土壤力学指标与土壤入渗性指标显著负相关(P<0.05)。土壤物理性质与土壤入渗性能、土壤力学性能显著相关。土壤抗剪强度是影响不同侵蚀程度下土壤物理性质及力学性质变化的主要因素。
4.4 紫色土坡耕地耕层土壤退化指数:S-5为-8.71%,S-10为-10.95%,S-15为-15.37%,S-20为-12.17%。土壤退化指数随侵蚀程度增加呈先减小后增加,并在S-15土壤退化指数最小,土壤退化程度为重度退化。不同侵蚀程度下,0—10、20—30、30—40 cm土层退化严重。
参考文献 原文顺序
文献年度倒序
文中引用次数倒序
被引期刊影响因子
[本文引用: 1]
[本文引用: 1]
DOI:10.5814/j.issn.1674-764x.2018.05.002URL [本文引用: 1]

Soil erosion has become a serious environmental problem worldwide, and slope land is the main source of soil erosion. As a primary cover of slope land, crops have an important influence on the occurrence and development of runoff and soil erosion on slope land. This paper reviews the current understanding of runoff and soil erosion on slope cropland. Crops mainly impact splash detachment, slope runoff, and sediment yield. In this review paper, the effects of crop growth and rainfall on the splash detachment rate and the spatial distribution of splash detachment are summarized. Crop growth has a significant impact on runoff and sediment yield. Rainfall intensity and slope gradient can influence the level of erosive energy that causes soil erosion. Furthermore, other factors such as antecedent soil water content, soil properties, soil surface physical crust, and soil surface roughness can affect soil anti-erodibility. The varying effects of different crops and with different influence mechanisms on runoff and soil erosion, as well as changes in their ability to influence erosion under different external conditions should all remain focal points of future research. The effect of crop vegetation on runoff and soil erosion on slope land is a very important factor in understanding large-scale soil erosion systems, and in-depth study of this topic is highly significant for both theory and practice.
[本文引用: 2]
[本文引用: 2]
[本文引用: 2]
[本文引用: 2]
[本文引用: 2]
[本文引用: 2]
[本文引用: 3]
[本文引用: 3]
[本文引用: 2]
[本文引用: 2]
[本文引用: 3]
[本文引用: 3]
[本文引用: 1]
[本文引用: 1]
URL [本文引用: 1]
URL [本文引用: 1]
[本文引用: 1]
[本文引用: 1]
[本文引用: 1]
[本文引用: 1]
[本文引用: 1]
[本文引用: 1]
DOI:10.13227/j.hjkx.201703025URLPMID:29965201 [本文引用: 1]
The development of agriculture in the red soil sloping uplands has been increasingly restricted by low water availability, high temperatures, and low fertilizer use efficiency. Subsurface flow has a significant influence on runoff generation, nutrient loss, and soil erosion. The rainfall-runoff process makes it easy for nutrients on the sloping land to enter water bodies through subsurface flow mainly in the liquid phase, which may lead to environmental problems such as eutrophication and groundwater pollution. Phosphorus as one of the common nutrients causing eutrophication is immobile in the soil because it is easily absorbed and fixed by soil particles. Thus, the principal pathway of phosphorus release from the soil is the surface flow. In some regions, sufficient and concentrated rainfall results in the surface-subsurface flow that enhances phosphorus migration. Recently, researchers have studied the migration patterns of red soil phosphorus through surface flow and the impact factors arising from these migrations, as well as the generation of subsurface flow and its influence on phosphorus outputs. However, there are relatively few investigations that have comprehensively considered the influence of both surface flow and subsurface flow on the migration of red soil phosphorus. In order to investigate the characteristics of phosphorus loss through runoff under natural rainfall, a large-scale field lysimeter experiment was conducted with three treatments i.e., grass cover (GC), litter mulch (LM), and bare land (BL) on a red soil slope land in southeast China. Phosphorus loss through surface flow, interflow at different soil layers (30 cm and 60 cm), and groundwater flow (at 105 cm depth) was observed under each natural precipitation event over a one-year period. The results showed that:① The concentrations of total P (TP) and dissoluble P (DP) in surface flow were slightly higher than those in interflow and groundwater flow; the concentrations of TP and DP showed a gradual downward trend with the increase in soil depth. The total amount of TP runoff loss was ordered as BL (1.61 kg·hm-2) > LM (1.33 kg·hm-2) > GC(0.82 kg·hm-2). ② Surface flow, interflow, and groundwater contributed to 57%, 6%, and 37%, respectively, of the phosphorus runoff loss on BL plot; surface runoff was the main pathway of phosphorus loss. Groundwater flow was the crucial route of phosphorus runoff loss once a vegetation cover was in place; groundwater flow contributed to more than 71% of the phosphorus runoff loss while the surface flow contributed less than 14%. ③ Particulate phosphorus was the primary pattern of phosphorus transport which accounted for 64%-97% of the total amount of phosphorus runoff loss. The effect of phosphorus loss through groundwater flow cannot be neglected on the red soil slope land. The loss load of phosphorus through runoff can be controlled by grass cover and litter mulch treatments, whereas the concentrations of phosphorus in runoff do not significantly reduce.
DOI:10.1002/(sici)1097-4598(199706)20:6&lt;740::aid-mus12&gt;3.0.co;2-yURLPMID:9149082 [本文引用: 1]
[本文引用: 1]
[本文引用: 1]
[本文引用: 3]
[本文引用: 3]
DOI:10.1016/0341-8162(88)90054-9URL [本文引用: 1]
DOI:10.2136/sssaj1988.03615995005200010032xURL [本文引用: 1]
URL [本文引用: 2]
为准确评价红壤坡耕地耕层土壤质量特征,该文采用聚类分析法(CA)和主成分分析法(PCA)分别建立了南方红壤丘陵区坡耕地耕层质量诊断最小数据集(minimum data set,MDS),并利用最小数据集土壤质量指数(soil quality index-CA, SQI-CA和soil quality index-PCA, SQI-PCA)和全量数据集土壤质量指数(soil quality index-total, SQI-T)对坡耕地耕层特征进行分析。结果表明:1)红壤坡耕地耕层土壤质量变化特征差异明显,其中耕层平均厚度(19.93±4.9) cm,接近作物生长适宜水平;土壤有机质、全氮平均含量分别为(17.43±8.71)和(0.97±0.42) g/kg,处于中度贫瘠化水平;土壤有效磷和速效钾含量丰富,平均含量分别为(26.1±22.22)和(155.46±88.35 )mg/kg;pH均值为(5.34±0.77),土壤呈弱酸性。2)红壤坡耕地耕层土壤质量评价最小数据集由耕层厚度、土壤容重、土壤贯入阻力、土壤有机质、pH值和有效磷组成。基于不同数据集的耕层土壤质量评价结果差异明显,土壤质量指数变化范围、均值表现为SQI-T>SQI-CA>SQI-PCA,变异系数表现为SQI-T
URLPMID:16425459 [本文引用: 1]
By the methods of sensitivity analysis,main component analysis and discriminant analysis,this paper screened the sensitive indicators from 32 soil attributes to assess the productivity and erosion-resistance ability of the soils in hilly Loess Plateau.The results showed that soil available phosphorus content,anti-scouring ability,infiltration coefficient,labile organic carbon content,organic matter content and urease activity were the most sensitive indicators for soil quality assessment and the main targets for soil quality management and improvement,while soil biological indicators were with high and medium sensitivity.Five soil quality factors were summed up from 29 soil chemical,physical and biological attributes,i.e.,organic matter,texture,phosphorus,porosity and microstructure.Except the factor porosity,the other four factors were significantly different between different land use types.Eight indicators including soil organic matter content,infiltration coefficient,anti-scouring ability,CEC,invertase activity,mean weight diameter (MWD) of aggregates,available phosphorus,and MWD of micro-aggregate were identified as the assessment indicators of the soil quality in hilly Loess Plateau,with the organic matter content,infiltration coefficient and anti-scouring ability as the key indicators.
[本文引用: 1]
DOI:10.1007/s40333-016-0122-8URL [本文引用: 1]
The infiltration of water into soil is one of the most important soil physical properties that affect soil erosion and the eco-environment, especially in the Pisha sandstone area on the Chinese Loess Plateau. We studied the one-dimensional vertical infiltration of water in three experimental soils, created by mixing Pisha sandstone with sandy soil, irrigation-silted soil, and loessial soil, at mass ratios of 1:1, 1:2, 1:3, 1:4, and 1:5. Our objective was to compare water infiltration in the experimental soils and to evaluate the effect of Pisha sandstone on water infiltration. We assessed the effect by measuring soil bulk density (BD), porosity, cumulative infiltration, infiltration rate and saturated hydraulic conductivity (Ks). The results showed that Pisha sandstone decreased the infiltration rate and saturated hydraulic conductivity in the three experimental soils. Cumulative infiltration over time was well described by the Philip equation. Sandy soil mixed with the Pisha sandstone at a ratio of 1:3 had the best water-holding capacity. The results provided experimental evidence for the movement of soil water and a technical support for the reconstruction and reclamation of mining soils in the Pisha sandstone area.
[本文引用: 1]
[本文引用: 1]
URL [本文引用: 1]
土壤可蚀性K值是评价土壤对侵蚀敏感程度和进行土壤侵蚀预报的重要参数,是支撑水土保持监测、预报和规划的重要基础。为了建立基于通用土壤流失方程的土壤侵蚀量估算数据库,需要掌握了解K值特征,该文采用对变量数字特征和离散程度的传统统计,以及克里格插值的地统计方法分析黑龙江省土壤普查相关数据和土壤可蚀性K值特征。结果表明:1)主要土类间土壤质地组分含量具有显著差异性,粗粉粒、细粉粒和黏粒含量服从正态分布且块金效应均大于75%,表现出很弱的空间相关性。2)主要土类K值期望,风砂土最大、白浆土最小,变异系数均小于10%,呈弱变异性。3)土壤质地K值期望,砂壤土最大、中黏土最小,总体上随物理性黏粒含量的增大而减小,随物理性砂粒含量减小而减小,除重黏土变异系数为19.99%,呈中等变异性外,其他土壤质地变异系数均小于10%,呈弱变异性。4)随表层厚度的增加,K值期望呈线性显著(R2=0.83)的平缓递减趋势。5)不同土壤侵蚀类型区域的K值及其分布特征差异较大,类型相同而强度不同的土壤侵蚀区域K值及其分布具有相似的分布规律。6)K值块金效应为73.30%,具有中等的空间相关性,自西向东呈平缓的线性递减分布趋势,由北至南呈上开广口抛物线状分布趋势,其极大值区与风砂土主要分布区,2个极小值区与白浆土、黑土主要分布区,具有空间一致性,此外,水土保持区划中分区的功能定位体现了K值的分布特征。该研究可为黑土资源的保护与修复提供科学依据,对黑土地能够继续、持续地保障粮食生产安全具有积极意义。
DOI:10.1007/s12665-015-4980-8URL [本文引用: 1]
URL [本文引用: 1]
构建生态、经济、社会和谐共赢关系是实现黄土高原区域可持续发展的必由之路。该文利用陕甘宁三省16个地级市2007-2014年的面板数据,基于耦合协调度模型分析了水土流失治理效益与生态农业发展水平的耦合协调态势,采用双变量空间自相关模型分析了两系统耦合协调度的空间集聚性。结果表明:研究区域水土流失治理效益和生态农业发展水平的耦合度较高,协调度偏低,耦合协调发展趋势滞缓,呈"低水平均衡"状态;空间集聚性整体逐步加强,但两级分化严重,"高-高"集聚区与"低-低"集聚区中间缺乏必要的"辐射枢纽",亟待培养新的集聚极点。因此,维持耦合发展势头,增强对外辐射;加强试点研究,突破协调发展瓶颈;培养新的集聚极点,缓解空间集聚两级分化是未来黄土高原区促进水土流失治理与生态农业协同发展的主要方向。
URL [本文引用: 1]
土壤入渗速率决定着地表径流,土壤抗剪力制红着土壤的可蚀性能,因此,两者对水土流失作用有着直接的影响,可以用来确定土壤侵蚀的等级。
URL [本文引用: 1]
土壤入渗速率决定着地表径流,土壤抗剪力制红着土壤的可蚀性能,因此,两者对水土流失作用有着直接的影响,可以用来确定土壤侵蚀的等级。
URL [本文引用: 1]
Effect of soil bulk density on soil infiltration capacity was explored through simulated experiments. The experimental soils were different in soil texture (sandy loam, medium loam, clay loam) and bulk density by artificially altering composition of soil particle fractions. Infiltration capacity of experimental soils decreased along with increasing soil bulk density. The stable infiltration rate had negative correlation of logarithmic function with soil bulk density. The 120 min-cumulative infiltration showing negative correlation of power function with soil bulk density for sandy loam, and negative linear correlation for medium loam and clay loam. The parameter of Kostiakov infiltration equation which meaned initial infiltration rate decreased along with increasing soil bulk density, and the other parameter which meaned infiltration decaying rate increased. The results showed that the capacity of initial infiltration rate went down and the infiltration decaying rate went up along with increasing soil bulk density. The results provided the theoretical basis for soil improvement and rainfall utilization.
[本文引用: 1]
[本文引用: 1]
[本文引用: 1]
