 ,2, ������3, ������1, �ν�11
 2
3
Mapping of Soil Organic Matter and Its Driving Factors Study Based on MGWRK
QIAO Lei1, ZHANG WuPing,2, HUANG MingJing3, WANG GuoFang1, REN Jian1ͨѶ����:
���α༭: ����ϼ
�ո�����:2019-11-14��������:2020-02-13�����������:2020-05-16
| ��������: |
Received:2019-11-14Accepted:2020-02-13Online:2020-05-16
����� About authors
����,E-mail��qiaolei1995@126.com��

ժҪ
�ؼ��ʣ�
Abstract
Keywords��
PDF (3337KB)Ԫ������ά�����������������EndNote|Ris|Bibtex�ղر���
�������ø�ʽ
����, ����ƽ, ������, ������, �ν�. ����MGWRK�������л�����ͼ�����������о�[J]. �й�ũҵ��ѧ, 2020, 53(9): 1830-1844 doi:10.3864/j.issn.0578-1752.2020.09.011
QIAO Lei, ZHANG WuPing, HUANG MingJing, WANG GuoFang, REN Jian.
0 ����
���о����塿�����л�������������Ҫ��ɲ���[1],�����л��ʶ�����������[2]����������[3]����������[4]�ȷ���������Ҫ������,�����л��ʵ���Ҫ��,�����л�����ͼ����Ϊ��Ҫ,�����л�����ͼ���ڽ�ʾ�����л��ʿռ�ֲ���ũҵ�����Լ���̬���������涼���ž���ƶ����á��������л��ʵĿռ�ֲ���Ԥ���ܹ�Ϊũҵ��������̬�����ṩ��������,̽�������л����뻷��Э����֮��Ŀռ��ƽ���������Ը�����ȷ��ͬӰ�����Ӷ������л��ʵ�Ӱ��̶ȼ��ռ�仯����ǰ���о���չ�����������õ�����Ȩ�ع鷽�����������л��ʵĿռ�ֲ����ռ��ƽ�����������б���[5,6,7,8,9,10,11],�ⴺ����[5]���ø̡߳�������¡�����������Լ���һ��ֲ��ָ��4��Э������ɵ�����Ȩ�ع齨ģ,������л��ʿռ�Ԥ�⾫��;���յ�[6]�Ա��˲�ͬ�ռ�ع鼼����Ԥ�⾫��,֤ʵ�˵�����Ȩ�ع�����GWRK����Ԥ�⾫��������ͨ�����OK�����ع�����SWRK��;ZENG[7]�ȶԱ��˻�ϵ�����Ȩ�ع鷽����GWR�ȶ��ֿռ�Ԥ�ⷽ����ģ��Ч��,չʾ�˻�ϵ�����Ȩ�ع������Ӧ��ǰ���������о�����㡿������Ȩ�ع��Ӧ�÷dz��㷺,�漰��ҵ[12,13]������[14,15,16]������[17]����ͨ[18]���ڶ�����,�������ö��س߶ȵ�����Ȩ�ع����������л��ʷֲ����ռ��ƽ��������ȴ���б������������Ĺؼ����⡿���о����ö��س߶ȵ�����Ȩ�ع�����multiscale geographically weighted regression kriging,MGWRK������ѡȡ�����¶ȡ������ˮ������ƽ���¶ȡ����Ρ�ֲ�����ܳ���������������ɢ��������ʪ��ָ����ƽ�����ʡ���������ָ��������ָ�������δֲ�ָ������ƽ��NDVI��13������Э�����������л��ʽ��н�ģ,̽����ͬЭ�����Ŀռ��ƽ���������ͳ߶�ЧӦ,������ͨ�����ordinary kriging,OK�����ع�����regression kriging,RK����������Ȩ�ع�����geographically weighted regression kriging,GWRK���Աȷ������Ե�Ԥ�⾫������ͼЧ����ּ�ڻ�ø��߾��ȵ��л��ʿռ�ֲ�����Լ���ͬӰ�����صĿռ��ƽ��������,Ϊ���������Ϳռ�����ṩ���ݺͲο���1 �����뷽��
1.1 �о����ſ�
���о�ѡȡ����ƽԭ��ƽң�ص�7��������Ϊ�о������о���λ��ƽң��������,��ɽ��ʡ������ظ���λ��,���ڶ�Ϊƽ�����о������´���½��ɺ���������,ƽ������12��,��ƽ�����ʪ��58%,�����ˮ��502 mm,��Ҫ�ֲ���7��9�·ݡ����������ﶬ��Ϊ������,�ļ���Ϊ���Ϸ�,��ƽ������2.1 m��s-1����ֲ����������Ϊ��,���������Գ���Ϊ��,���ֵ���Ϊ������������1.2 ����������������Դ
��Ʒ�ɼ���2010�괺��������ֲǰ,���ݡ����ص����������������ۼ�����̡���NY/T 1634��2008��,�ò��������ȹ���,��ÿ������в��á�S�����������,��GPS��λ����Ϊ����,�����ܷ�����������,ÿ���������ȡ15�����Ϸ�����,ÿ��������IJ�����λ����ȡ���������һ��,�������Ϊ0��20 cm,���ɼ�����2 616��,������ֲ���ͼ1�������л��ʣ�SOM�������ظ���ؼ��ȷ�[19]�ⶨ�����ָ߳����ݣ�digital elevation model,DEM�������й���ѧԺ�����������Ϣ���ĵ����ռ���������վ��www.gscloud.cn��,���������Ӿ���DEM���ݼ���ó��������������Թ���������Ϣ�����й�������������http://data.cma. cn/�����о�������ң�����ݾ�����NASA��վ��https://earthdata.nasa.gov/��,2009��ֲ�����ܳ�����������gross primary productivity,GPP����������MOD17���ݼ�,2009����ɢ��evapotranspiration,ET����������MOD16���ݼ�,2009��ƽ��NDVI��������MOD13���ݼ�������Э��������������1��ͼ1
 �´��ڴ�|����ԭͼZIP|����PPT
ͼ1�о����ſ�������ֲ�
Fig. 1Study area and soil sample sites
Table 1
��1
��1����Э���������б�
Table 1
| �������� Data type | ָ�� Index |
|---|---|
| ������������ Terrain data | ����Aspect |
| �¶� Slope | |
| ���� Height | |
| ����ʪ��ָ�� Topographic wetness index, TWI | |
| ƽ������ Plan curvature, PC | |
| ��������ָ�� Stream power index, SPI | |
| ����ָ�� Terrain position index, TPI | |
| ���δֲ�ָ�� Terrain ruggedness index, TRI | |
| �������� Meteorological data | ��ƽ����ˮAnnual mean precipitation, PRE |
| ��ƽ���¶� Annual mean temperature, TEM | |
| ң������ Remote sensing data | ��ֲ����������GPP (From MOD17A2) |
| ����ɢ�� ET (From MOD16A2) | |
| ��ƽ��NDVI (����MOD13A1,ʹ�����ϳɷ����) Annual mean NDVI (Data from MOD13A1, obtained by Maximum Value Composites method) |
�´��ڴ�|����CSV
1.3 �����
1.3.1 ��ͨ�����OK�� ��ͨ�����ordinary kriging,OK�� ���ڿռ�������ԺͶ���ƽ�ȼ���[20],���ݹ��������С�Ͱ뷽�������,����һ�����������㲻ͬȨ�غ�,��������ֵ��Ȩ�ͼ�Ϊ��ֵ��������а���캯����ʽΪ��ʽ��,��(h)Ϊ����캯��ֵ;N(h)Ϊ�������hʱ�ĵ������;Z(xi)Ϊ���������λ��xi����ʵ����ֵ;Z(xi+h)Ϊ��xi+h����ʵ����ֵ��
1.3.2 �ع�����RK�� �ع�����[21]�Ƕ�Ԫ���Իع飨multiple linear regression,MLR���������ֵ�����Ľ��,ͨ����Ԫ���Իع鷽����ȡԤ��ģ��,��Ԥ������IJв������ͨ��������,������ֵ��в�����ӵõ�����Ԥ���������о�ʹ�õĶ�Ԫ���Իع鷽��Ϊ��ͨ��С���˷���ordinary least square,OLS��,�������yi���Ա���xi�Ķ�Ԫ���Ժ�����
ʽ��,��0Ϊ�����б��,��iΪÿ���Ա����Ļع�ϵ��,��iΪ�������
�ع�����[22]�Ĺ�ʽ���£�
ʽ��,ZΪRKģ��Ԥ��ֵ,m(xi)ΪMLR���̵�����ֵ,e(xi)������OK�����Ƶ�MLR���̲в�,������GWRK��MGWRK�����ع�������������ơ�
1.3.3 ������Ȩ�ع�����GWRK�� GWRK[23]�ǵ�����Ȩ�ع飨geographically weighted regression,GWR��ģ���������ֵ�����Ľ��,Ҳ����Ϊ��RK�ĸĽ�,RK��ȫ�ֻع�ģ��[24],��RK�ж�Ԫ���Իع������������Ա����Ĺ�ϵ�ڿռ��ϲ����ſռ�λ�õı仯���仯,��GWRKΪ�ֲ��ع�ģ�͡�������Ȩ�ع�[25]���ڶ�ռ�ع鼼��Ӧ����Ϊ�㷺��һ��,����ģ�͵Ĺ����п��ǵ��˸�����Ŀռ�λ���Լ���ͬλ�����Ա������������ϵ�ı仯,��ʾ�ڿռ�߶����Ա�����������Ĺ�ϵ��
�ٶ���n���۲��,�۲��Ϊi��{1, 2, ..., n},ÿ���۲���λ��Ϊ��ui,vi��,���뽨ģ���Ա�����m����GWRģ��[26]�ı���ʽ���£�
ʽ��,xij��i�۲��ĵ�j���Ա���,��i(ui,vi)Ϊ��(ui,vi)λ���ϵ�j���Ա����Ļع�ϵ��,��iΪ��������,yiΪ�������
�˺�������Ч����[26]��GWR��ģ����������Ҫ������ָ�ꡣ�˺���������ȷ���ռ�Ȩ��,������˹������˫ƽ��������ָ������,�˺��������й����пɲ��ò�ͬ������,�����̶��˺���������Ӧ�˺���[13],���۲����ȷֲ�ʱ�ɲ��ù̶��˺���,����ѡ������Ӧ�˺���,���о�ʹ������Ӧ��˹�������пռ�Ȩ��ȷ��������GWR���ƶ����ڻع鷽����һ��,���������Ǻ˺�������Ҫ����֮һ,������˺���ԭ���������[26],��Ч������ȷ�������������������Ϣ����corrected akaike information criterion,AICc���������Ϣ����akaike information criterion,AIC������Ҷ˹��Ϣ��bayesian information criterion,BIC����,���о��������������Ϣ����AICc��ȷ��ģ�ʹ���,ԭ����AICc��С��,�Դ���Ϊȷ�������ı�,����AICc�ļ��㹫ʽ���£�
ʽ��,��Ϊ��������,nΪ��������,tr(S)Ϊ����S�ļ�,����S��ģ�͵�ñ�Ӿ���
��GWRģ����,ȷ�����������Ч�����������Ա������õ�,���ڽ�ģ�������Ա�������Ч��������һ����,�ռ�Ȩ�ؾ���Ҳ��һ�µġ���GWRģ����δ���Dz�ͬ����Э��������������ϵ��ͬ�ĵĿռ�߶�,����Ԥ�����л���Э�����Ŀռ��ƽ���������Ŀռ�߶�һ�¡�
1.3.4 ���س߶ȵ�����Ȩ�ع�����MGWRK�� MGWRK�Ƕ��س߶ȵ�����Ȩ�ع飨multiscale geographically weighted regression,MGWR�������������Ľ��,Ҳ�ɿ����Ƕ���GWRK�ĸĽ���MGWR[27]��FOTHERINGHAM�������һ�ֻ�����Ч�����Ż��Ӷ�ʹÿ���Ա��������в�ͬ�Ŀռ�����ĵ�����Ȩ�ع鷽������GWR��ͬ����,GWRȷ����ģ�ʹ����������Ա������õ�,��ʵ������в�ͬ���Ա����Ŀռ�߶�ЧӦ�Ͷ��������Ӱ��̶��Dz�һ����,����MGWR�������ǵ�����һ��,MGWR����ʹÿ���Ա������и��Ե���Ч����,��Ϊ���س߶ȡ�MGWRģ�����£�
ʽ��,��bwj�Ǿ�����j���Ա�����Ч����У����Ļع�ϵ����
�ڱ��о���,MGWR��GWRģ�͵ĺ˺����ͺ����;�����һ��,�˺��������ø�˹����,�˺�����������Ӧ�˺���������ģ�������������ȷ����Ч�����ķ���,��Ч�����ı��ʼ��ǿռ�߶�,Ҳ����ȷ�����������IJ�ͬ������MGWR���س߶ȵ����ԡ���Ч������ѡ�����ģ�ͼ�����Ӱ���,���ǿ��Խ���Ч��������һ������ƽ�����ʵIJ���,����Ч����̫���п�����������о�����IJ�������,�ڸ��о������ľֲ�����;����Ч����̫С�����ɹ���ľֲ�����,����ʶ���о��ռ����֮��Ĺ���[28]��ѡȡһ�����Ŵ��������������ּ������,�ṩ���õĿռ��ϵ����Ч�����Ե���Ϊ��Ҫ��
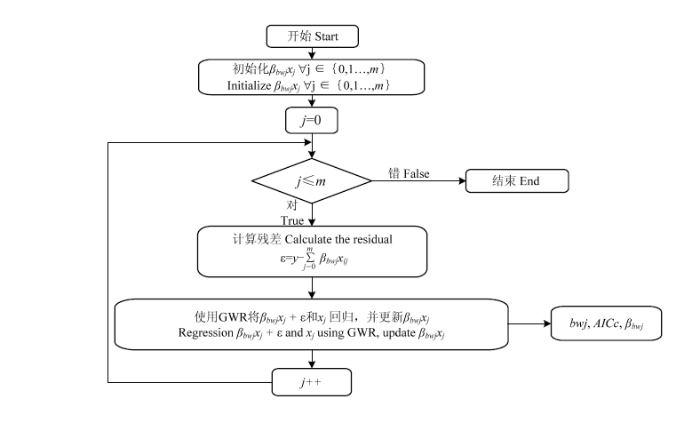
��MGWRģ����,�ڲ�ͬ���Ա��������Ų�ͬ�Ĵ���,��Ҳ��ζ���ڽ�ģ�в�ͬ�Ա�����ͬһλ�ý�������ȫ��ͬ�Ŀռ�Ȩ�ؾ���,��GWRģ����ʹ�õľ���ƽ�����õIJ�������Ч������������������MGWRģ�͡�MGWRģ���в��������ϣ�Back-fitting���㷨[27]����ģ��У��������ʹ��GWRģ�ͼ���ĸ�λ���Ա��������Լ�ģ������y����Ϊ��ʼ��,ʹ����Щ��ʼֵ����bwjxj���Լ���õIJв��=y-��m j=0��bwjxij��,�в�ӵ�ǰ����bwjxj ����bwjxj+����,����GWRģ�ͽ���ֵ��x0����һ���Ա��������лع�,��ʱ�õ��������x0֮��IJ�����bw0�ľֲ�����,���õ����������x0֮������Ŵ���bw0��������ʹ�ø��º����bwjxj����һ���Ա���x1����ͬ���Ĺ���,�õ�ֱ�����е��Ա�����x0,x1,��,��, xm������ɸù��̣�ͼ2����
ͼ2
 �´��ڴ�|����ԭͼZIP|����PPT
ͼ2MGWRģ�͵������ϣ�Back-fitting���㷨[27]
Fig. 2Back-fitting algorithm for multiscale geographically weighted regression model (MGWR)
1.4 ģ������
���о�ʹ��ƽ����ME����ƽ��������MAE������������RMSE������ģ�;���[29],������ָ���Ĺ�ʽ���£�ʽ��,n��������֤�Ĺ۲������,Z(xi)��ʵ��ֵ,Z*(xi)��ģ��Ԥ��ֵ��������MAE��RMSEԽ�ӽ���0ģ��Ԥ��Ч��Խ�á���һЩ�о���3��ָ�����ͬʱ�ﵽ���ˮƽ,���Գ�����ָ����,����YANG��[29]�����Radiusָ����ʽ 10��,�Ա��ڽ��3��ָ��ȷ������ģ�͡�
ʽ��,Radius��ΪRadiusָ��,MES��MAES��RMSES��ʹ��Z�÷ַ����б������ME��MAE��RMSE,��ָ��ԽС��˵��ģ��Ч��Խ�á�
2 ���
2.1 ����Э����ѡ��MLR��ģ
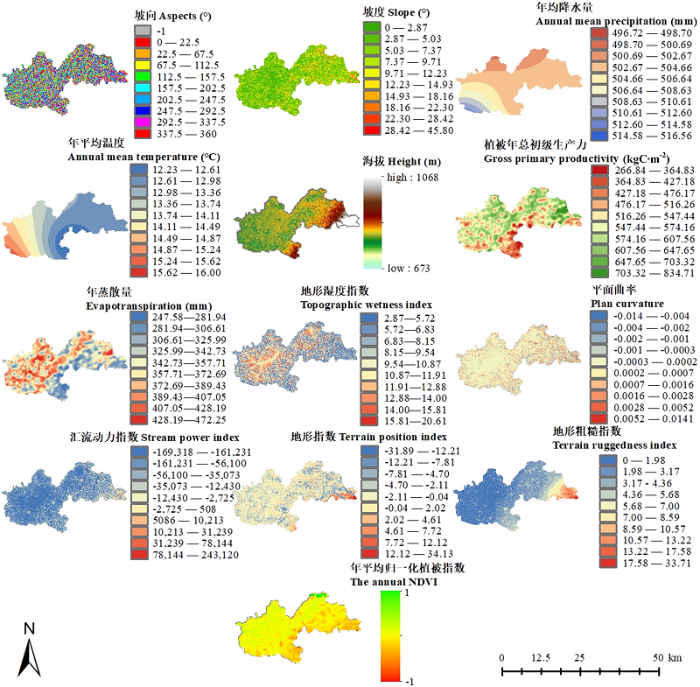
�����л��ʵ�Ӱ�������ڶ�,�ڶ�Ԫ���Իع齨ģѡȡ�����Ĺ��̵�����Ҫ������������[30,31]�� ��1��������Э���������л��ʵķֲ�������Ӱ��,Ӱ�켫�����IJ��迼��;��2��������Э�����ڿռ�ֲ��о���һ���Ŀռ�������;��3��������Э����֮�䲻���ڶ��ع�����,��Ҳ�Ƕ�Ԫ���Իع齨ģ�ı�Ҫ����֮һ�����о�ѡȡ�����¶ȡ������ˮ������ƽ���¶ȡ����Ρ�ֲ�����ܳ���������������ɢ��������ʪ��ָ����ƽ�����ʡ���������ָ��������ָ�������δֲ�ָ������ƽ��NDVI��13��ָ�꣨ͼ3����Ϊ��ģ�Ļ���Э����,���л�����Ϊ����������л���Э����֮��Ķ��ع�����������ݲ�ͷ����������ӣ�VIF����Ϊ����,�ݲ�ԽС,�������Ա�����Ϊ��������лع����ʱ�������������͵ij̶�Խ��,Խ���ܴ������صĹ�����,�ݲ�����ķ�Χ�ǣ�0.1,+�ޣ�;���������������ݲ�ĵ���,����ֵ��10,˵���Ա�������ܴ������صĹ���������[32],ģ�͵Ĺ�������Ͻ������2������VIF��δ����10,����Ϊ�ڸ�ģ���в��������صĶ��ع���������
ͼ3
 �´��ڴ�|����ԭͼZIP|����PPT
ͼ3����Э�����ռ�ֲ�����������Ϊ0��,˳ʱ�����,-1Ϊƽ�� Aspect direction is defined as zero degrees due north, clockwise count, -1 is flat
Fig. 3Spatial distribution of environmental covariates
Table 2
��2
��2ģ�Ͷ��ع����Լ���
Table 2
| ָ��Index | �ݲ� Tolerance | VIF |
|---|---|---|
| ����Aspects (��) | 0.993 | 1.007 |
| �¶�Slope (��) | 0.548 | 1.824 |
| �����ˮ��Annual mean precipitation (mm) | 0.514 | 1.944 |
| ��ƽ���¶�Annual mean temperature (��) | 0.417 | 2.400 |
| ����Height (m) | 0.670 | 1.493 |
| ֲ�����ܳ���������Gross primary productivity (kgC��m-2) | 0.216 | 4.636 |
| ����ɢ��Evapotranspiration (mm) | 0.194 | 5.168 |
| ����ʪ��ָ�� Topographic wetness index | 0.652 | 1.534 |
| ƽ������Plan curvature | 0.928 | 1.078 |
| ��������ָ�� Stream power index | 0.980 | 1.021 |
| ����ָ�� Terrain position index | 0.730 | 1.369 |
| ���δֲ�ָ�� Terrain ruggedness index | 0.548 | 1.824 |
| ��ƽ����һ��ֲ��ָ�� The annual NDVI | 0.893 | 1.120 |
�´��ڴ�|����CSV
�������л����Լ�������Э��������������ͳ�ƣ���3��,���Կ���,��ͬ����Э�����ı���ϵ���Dz�ͬ��,���е���ָ���ı���ϵ��������,�����ˮ���ı���ϵ������С�ġ�
Table 3
��3
��3�����л��ʼ�����Э����������ͳ��
Table 3
| ָ�� Index | ��Сֵ Minimum | ���ֵ Maximum | ƽ��ֵ Mean | ���� Standard deviation | ���� Variance | ����ϵ�� Coefficient of variation (%) |
|---|---|---|---|---|---|---|
| ���Soil organic matter (g��kg-1) | 2.10 | 33.00 | 13.91 | 5.01 | 25.09 | 36.00 |
| ����Aspects (��) | -1.00 | 359.12 | 180.32 | 106.64 | 11373.13 | 59.14 |
| �¶�Slope (��) | 0.00 | 33.37 | 6.84 | 4.60 | 21.20 | 67.36 |
| �����ˮ�� Annual mean precipitation (mm) | 499.01 | 511.01 | 503.72 | 2.00 | 3.98 | 0.40 |
| ��ƽ���¶� Annual mean temperature (��) | 12.25 | 15.20 | 13.37 | 0.73 | 0.53 | 5.45 |
| ����Height (m) | 690.00 | 927.00 | 744.04 | 22.77 | 518.46 | 3.06 |
| ֲ�����ܳ��������� Gross primary productivity (kgC��m-2) | 270.28 | 817.96 | 557.30 | 68.57 | 4702.51 | 12.30 |
| ����ɢ��Evapotranspiration (mm) | 248.43 | 461.20 | 358.95 | 37.47 | 1403.98 | 10.44 |
| ����ʪ��ָ�� Topographic wetness index | 0.00 | 19.39 | 9.61 | 3.14 | 9.86 | 32.67 |
| ƽ������ Plan curvature | -0.01 | 0.01 | 0.00 | 0.00 | 0.00 | 1281.06 |
| ��������ָ�� Stream power index | -167350.00 | 11730.90 | -3405.69 | 18999.56 | 360983218.24 | -557.88 |
| ����ָ�� Terrain position index | -21.49 | 21.78 | -0.47 | 4.88 | 23.78 | -1040.39 |
| ���δֲ�ָ�� Terrain ruggedness index | 0.00 | 18.72 | 3.81 | 2.25 | 5.05 | 58.96 |
| ��ƽ����һ��ֲ��ָ�� The annual NDVI | 0.00 | 2.80 | 0.71 | 0.19 | 0.04 | 26.44 |
�´��ڴ�|����CSV
��Ԫ���Իع飨MLR�����������ģ��Ϊ��
SOM=-131.09-0.0016��Aspects-0.01��Slope+0.46��Pre-3.74��Tem-0.04��Height-0.009��GPP+0.01��ET-0.08��TWI-92.15��PC+0.000007��SPI+0.06��TPI+0.03��TRI-1.51��NDVI
ʽ��,SOMΪ�����л���,AspectsΪ����,SlopeΪ�¶�,PreΪ�����ˮ��,TemΪ��ƽ���¶�,HeightΪ����,GPPΪֲ�����ܳ���������,ETΪ����ɢ��,TWIΪ����ʪ��ָ��,PCΪƽ������,SPIΪ��������ָ��,TPIΪ����ָ��,TRIΪ���δֲ�ָ��,NDVIΪ��ƽ����һ��ֲ��ָ������ģ�ͽ��з������,Fͳ����[33]Ϊ43.39,ģ�;���ͳ��ѧ��������,���ع鷽����Ч��
ͬ��,��GWRK��MGWRKģ����Ҳ����ͬ���Ļ���Э������Ϊģ���Ա�����
2.2 ��ģ��Ԥ�����ռ����
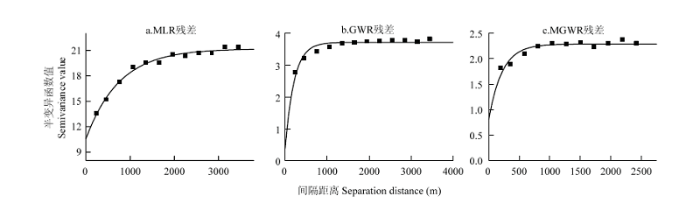
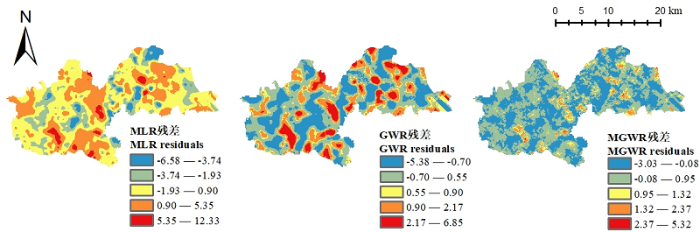
�Բ�ͬģ�͵IJв����ռ����캯����ϣ�ͼ4��,ģ�Ͳ���������ģ�ͼ���4��3��ģ�Ͳв�ֵ����캯�����������ģ�ʹ�ָ��ģ�͡���˹ģ�ͺ���״ģ��[34]��ѡȡ��GWR�в�İ���캯���������ģ��Ϊ��˹ģ��,�����������ģ�;�Ϊָ��ģ�͡��ӿ��ϵ��[35]���Կ���,��ģ�Ͳв�����ģ�͵Ŀ��ϵ����С��50%,����ζ��ģ��Ԥ����̵IJв���пռ�ṹ��,ʹ�ø��Եİ���캯�����пռ��ֵ,�����ͼ5��ͼ4
 �´��ڴ�|����ԭͼZIP|����PPT
ͼ4����캯��ͼ
Fig. 4Semivariogram
ͼ5
 �´��ڴ�|����ԭͼZIP|����PPT
ͼ5��ģ�Ͳв�ͼ
Fig. 5Map of different Model residuals (MLR residuals, GWR residuals, MGWR residuals)
Table 4
��4
��4��ģ�ͽ���ռ����
Table 4
| ���ģ�� Fitting model | ���ֵ Nugget | ��ֵ̨ Sill | ��� Range (m) | ���ϵ�� Nugget/Sill (%) | |
|---|---|---|---|---|---|
| MLR�в� MLR residuals | E | 10.59 | 21.20 | 2265 | 49.95 |
| GWR�в� GWR residuals | E | 0.38 | 3.72 | 636 | 10.22 |
| MGWR�в�MGWR residuals | E | 0.81 | 2.29 | 657 | 35.37 |
�´��ڴ�|����CSV
2.3 ��ģ������
��ģ������ָ�����5,��Radiusָ������,��ģ��ģ��Ч���ɺõ�������Ϊ��RK��OK��GWRK��MGWRK��MGWRKģ�͵Ŀռ�Ԥ�⾫�����������ģ��Ƿ��,��RKģ�͵Ŀռ�Ԥ�⾫����������š�Table 5
��5
��5��ģ������ָ��
Table 5
| ģ�� Model | RMSE | MAE | ME | R2 | Radius |
|---|---|---|---|---|---|
| OK | 2.8553 | 2.1009 | 0.0009 | 0.6984 | 107.4383 |
| RK | 2.7613 | 2.0396 | -0.0001 | 0.7207 | 98.1195 |
| MGWRK | 3.5430 | 2.6292 | 0.0036 | 0.5010 | 172.8181 |
| GWRK | 3.0622 | 2.2402 | 0.0978 | 0.6492 | 133.6925 |
�´��ڴ�|����CSV
2.4 ��ģ��������ͼ���
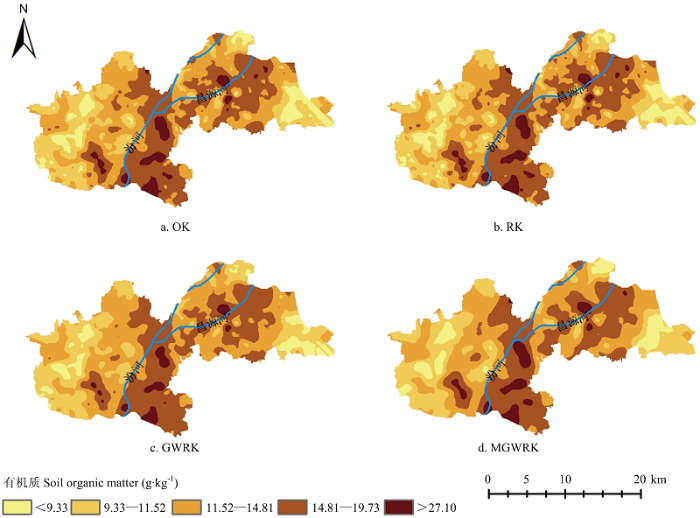
�������Ϸ�����ģ�Ͳ���,���ղ�ͬģ�ͻ��������л��ʷֲ�ͼ��ͼ6�������Կ���4�ֲ�ͬ��������ͼ����,�õ��ռ�������������Ƶġ�MGWRK��GWRK������Ч������������ַ�����Ϊƽ��,��������������ַ��������˸�����Э�����Ŀռ��ƽ�����������µ�,OK��RK���ַ����ߵ�ֵ��������,��ţ�ۡ���������,���л��ʿռ�ʵ�ʷֲ��������������ͼЧ������,GWRK������MGWRK������Ч���൱��ͼ6
 �´��ڴ�|����ԭͼZIP|����PPT
ͼ6��ģ��������ͼ���
��ͼ��ͼ�Ŀռ�ֱ���Ϊ30 m The mapping spatial resolution is 30 m
Fig. 6Soil mapping results of each model
�����л������о������ֶ�������ƫ��,�в�ƫ�ߵĿռ��֡����зں��Զ�����Դ���������������л����ձ�ƫ��,�غ�����������ˮ���ܵ�����Ӱ��,������ˮ��Ӱ���������л��ʵķֽ���ת������,��������Ļ������ˮ���������,����ˮ�ֹ���ʱ�������γ���������,�Ӷ��ı������л��ʵķֽ���������,����Ӱ�������л��ʺ���;����ˮ�ֹ���ʱ���п���Ӱ���������������״��,������������Ļ���[36]��
2.5 �л���Ӱ�����ӻع�ϵ���ռ�ֲ�
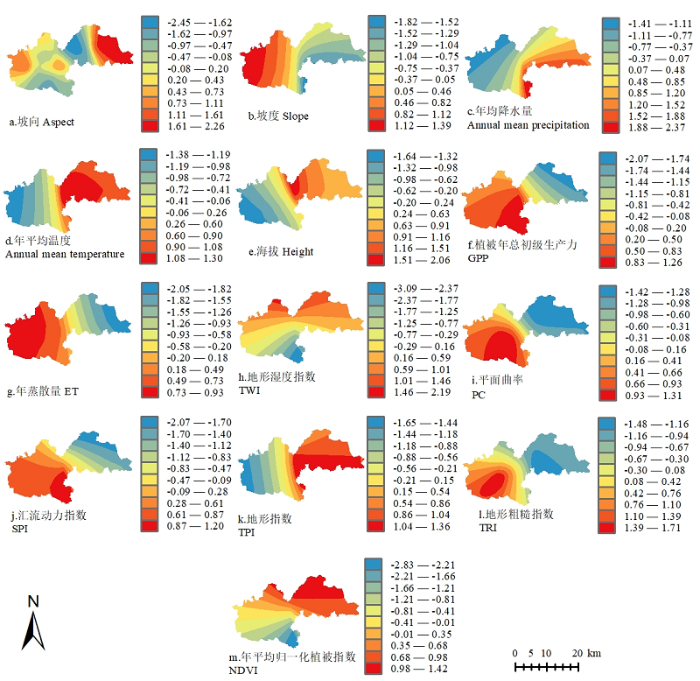
��������л��ʼ��ع������ͳ����������Ԫ���Իع鷽�̿�֪,��ȫ�ֳ߶��������л�����ȫ���������ˮ����������ع�ϵ,�����л���������ָ������ָ���ع�ϵ������ʵ����������ŵ���λ�õı仯��������Ա���֮��Ĺ�ϵҲ�DZ仯��,���ռ��ƽ����,MGWRģ����Բ�ͬ����Э����ʹ�ò�ͬ�Ŀռ�߶�,�ڽ��пռ�Ԥ���ͬʱҲ���Ա�����ÿ���ռ�λ�õĻع�����ֲ�����[37]��Ϊ�˱��⽨ģ���̵��в�ͬ�������������Իع�ϵ������Դ�С���Ӱ��,�ڶԱ�Ӱ����������λ�ñ仯Ӱ��̶ȵIJ�ͬʱʹ�þ���z��������������ľֲ��ع�ϵ�����пռ��ƽ������������,�������ع�ϵ����ͼ7-a��,����ı����ع�ϵ����Χ��-2.45��2.26֮��,������ֶ������͵Ŀռ���,������ֵ����ռ���֡����о�����������Ϊ�����Ӱ��,������Ƕ�Խ���л�����������Խ��,��������ع�ϵ���ﵽ����Сֵ,�ڴ˴����ָ����Ӱ��,������Ƕ�Խ���л��ʼ��ٷ���Խ��
ͼ7
 �´��ڴ�|����ԭͼZIP|����PPT
ͼ7�����л���Ӱ�����ӱ����ع�ϵ���ֲ�
Fig. 7Standardized regression coefficient distribution of soil organic matter influencing factors
ͼ7-b��,�¶ȵı����ع�ϵ����Χ��-1.82��1.39֮��,������ֶ������ߵĿռ���,����ֵ����ΰ�,����ֵԤȡ֮��ֽ�����,���±���Ϊ�ں��Զ�Ϊ�����Ӱ��,�ں�����Ϊ�����Ӱ�졣
ͼ7-c��,�����ˮ���ı����ع�ϵ����Χ��-1.41��2.37֮��,������ֶ������͵Ŀռ���,�ڶ�������ˮ��ƫ�٣�����500 mm��,�˴�����Ϊ�����Ӱ��,���ڸò��������ڽ�ˮ��Խ���л�����֮����;������������ˮ����Խϴ�,����Ϊ�����Ӱ��,���ڴ������ڽ�ˮ��Խ���л���ԽС��
ͼ7-d��,��ƽ���¶ȵı����ع�ϵ����Χ��-1.38��1.30֮��,������ֶ������͵Ŀռ���,����ƽ���¶�С��12����������Ϊ�����Ӱ��,������������Ӱ��ЧӦ�ﵽ����ǿ,��������ƽ���¶ȵ������л�����֮�����������������;��ƽ���¶ȴ���14����������Ӱ��ﵽ��ǿ,�������������¶ȵ������л��ʼ��ٷ��ȴﵽ���
ͼ7-e��,���εı����ع�ϵ����Χ��-1.64��2.06֮��,������ֶ������͵Ŀռ���,����ֵ����ΰ롣�����ϲ�����,�����������о�����͵�,���ζ����л��ʵĸ����Ӱ��ЧӦ�ﵽ���,�����ν����л�����֮���ٵķ��ȴﵽ���
ͼ7-f��,ֲ�����ܳ����������ı����ع�ϵ����Χ��-2.07��1.26֮��,������ֶ������ߵĿռ���,��ֵ����ռ�֡��ڶ�������GPPˮƽ�ﵽ�������,���˴��ع�ϵ����ﵽ���ˮƽ,������GPP�������л��ʼ��ٵķ��ȴﵽ���;���ϲ�GPPˮƽΪ�������,�ع�ϵ��ȴ�ﵽ���,���˴�GPPԽС�л�����������Խ��
ͼ7-g��,����ɢ���ı����ع�ϵ����Χ��-2.05��0.93֮��,������ֶ������ߵĿռ���,��ֵ����ռ�֡��о���������ɢ���ﵽ���,���ͬʱ����ɢ�����л��ʵ������Ӱ��ЧӦ�ﵽ���,������ɢ����С,���ϵ��Ҳ�ﵽ��С,�����Ӱ��̶ȴﵽ��ǿ��
ͼ7-h��,����ʪ��ָ���ı����ع�ϵ����Χ��-3.09��2.19֮��,������ֱ����ϵ͵Ŀռ���,����ֵ����ΰ롣TIW�������籱��Ӱ��̶���Ϊ��,��ʱTWI�ķ�Χ����Ϊ10.81��10.91,TWI��ӳ����ˮ�ֵĸ�ʪ״��[38],�Ӷ���ӵ�˵����һ������ˮ�ַ�Χ�ڶ��л��ʵ�Ӱ��̶ȴﵽ������
ͼ7-i��,ƽ�����ʵı����ع�ϵ����Χ��-1.42��1.31֮��,������ֶ������ߵĿռ���,����ֵ����ΰ롣���ͼ3,�о�����ƽ����������������ӽ�0,�����θ�Ϊƽ��[6],�˴��л���Ҳ��������������,����Ϊ�����Ӱ�졣�������α仯��Ϊ���ҵ����������Ϊ�����Ӱ�졣
ͼ7-j��,��������ָ���ı����ع�ϵ����Χ��-2.07��1.21֮��,������ֶ������ߵĿռ���,����ֵ����ΰ롣��SPI�Ŀռ�ֲ����ǡǡ�෴,SPIԽ����л��ʵĸ����Ӱ��Խǿ,��֮SPIԽС�������Ӱ��Խǿ��
ͼ7-k��,����ָ���ı����ع�ϵ����Χ��-1.65��1.36֮��,������ֶ������͵Ŀռ���,��ֵ����ռ�֡�TPI���о��������ﵽ���,TPI�ı����ع�ϵ��Ҳ�ﵽ�����ˮƽ,���ڵ��α仯����[38]�������л��ʱ仯Ҳ�Ǿ��ҵġ�
ͼ7-l��,���δֲ�ָ���ı����ع�ϵ����Χ��-1.48��1.71֮��,������ֶ������ߵĿռ���,����ֵ����ΰ롣TRI���о������ֶ������͵Ŀռ���,ǡǡ������ع�ϵ���෴,TRI<1.98ʱ�����ع�ϵ���ﵽ��С,������������[39]ԽС�л��ʵ���������Խ��TRI>8.59ʱ�����ع�ϵ���ﵽ���,������������Խ���л��ʵļ��ٷ���Խ��
ͼ7-m��,��ƽ��NDVI�ı����ع�ϵ����Χ��-2.83��1.42֮��,������ֱ����ϵ͵Ŀռ���,����ֵ����ΰ롣���ͼ3,NDVI���о����ϲ��ﵽ��С,�����ﵽ���,�ڱ����л���������ƽ��NDVI�����Ӷ�����,Խ�������ӷ���Խ��,��֮Խ��������NDVI�ļ����л�����֮�����ҽ��ͷ��ȱ��
2.6 MGWR��GWRģ�ʹ����Ա�
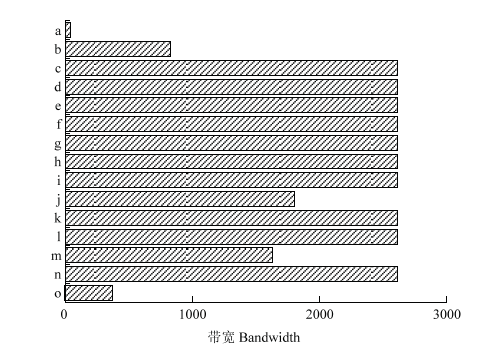
GWRģ�ͼ�MGWR��Э���������Ŵ�����ͼ8,��������ؿ���,����ģ���ڴ����������Ž�Ȼ��ͬ������,��MGWRģ���и�Э���������Ų�ͬ�Ĵ���,��GWRģ�ͽ���һ�ִ���,��ͬ����Э�����Ŀռ��ƽ�����������Ų�ͬ�Ŀռ�߶�,GWRģ���к��������ֿռ�߶�ЧӦ,��MGWRģ�Ͷ��������Լ������������뽨ģ,�ﵽ�˿ɹ۵�Ч����ͼ8
 �´��ڴ�|����ԭͼZIP|����PPT
ͼ8MGMR��GWRģ�ʹ����Ա�
a������;b���¶�;c�������ˮ��;d����ƽ���¶�;e������;f��ֲ�����ܳ���������;g������ɢ��;h��TPI;i��ƽ������;j��SPI;k��TPI;l��TRI;m��NDVI;n���ؾ���;o��GWRģ��
Fig. 8Bandwidth comparison of MGMR and GWR
a: Aspect of MGWR; b: Slope of MGWR; c: Annual mean precipitation of MGWR; d: Annual mean temperature of MGWR; e: Height of MGWR; f: Gross primary productivity of MGWR; g: Evapotranspiration of MGWR; h: TPI of MGWR; i: Plan curvature of MGWR; j: SPI of MGWR; k: TPI of MGWR; l: TRI of MGWR; m: NDVI; n: Intercept of MGWR; o: Geographically Weighted Regression (GWR)
3 ����
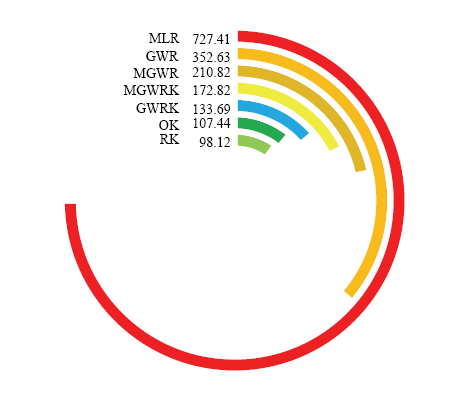
Ϊ�˸���ȫ���̽��MGWRK�������ȱ�GWRK�������ȵ͵�ԭ��,��MLR��GWR��MGWR 3�ַ�����Ԥ�⾫��Ҳ�������ۣ���6��,���������2.3���ֵ�ģ�����ۻ���Radiusָ��Ļ���ͼ��ͼ9������ͼ�����Կ���,MGWRģ�͵�Radiusָ���GWRģ�ͽ�����141.8024,GWRK��Radiusָ�������GWR������218.94,MGWRK�����MGWR��������38��MGWRģ�͵ı�������GWRģ��,��MGWRKģ�͵ı���ȴѷ��GWRKģ�͡����ͼ5,�ԱȲ�ͬģ�͵IJв�ռ�ֲ�ͼ,GWR�IJв�ߵͽ����ṹ����,��Ҳ��GWRģ���д����̶��Ľ��;��MGWR�IJв�ռ�ֲ�ͼ�ߵͽ�����û��GWR�IJв�����,������ΪMGWRģ���в�ͬ�Ա����Ĵ�����ͬ�Բв�Ŀռ�ֲ����Ӱ�������MGWRKԤ�⾫�������GWRKģ���������͡�Table 6
��6
��6����ģ������
Table 6
| ģ�� Model | RMSE | MAE | ME | R2 | Radius |
|---|---|---|---|---|---|
| MLR | 4.5402 | 3.4510 | 0.0000 | 0.1782 | 727.4052 |
| GWR | 3.9863 | 2.9921 | 0.0375 | 0.3731 | 352.6252 |
| MGWR | 3.5959 | 2.6806 | -0.0005 | 0.4916 | 210.8228 |
�´��ڴ�|����CSV
ͼ9
 �´��ڴ�|����ԭͼZIP|����PPT
ͼ9��ͬģ�͵�Radiusָ������ͼ
Fig. 9Radius indices shown in an arc diagram for different models
GWRģ��ģ��������Ϣ��ָ���ֱ�Ϊ��AICc��6705.059����AIC��6665.335��,MGWRģ�ͼ�������Ϣ��ָ���ֱ�ΪAICc��6123.467����AIC��6090.237��,MLRģ�ͼ�������Ϣ��ָ���ֱ�ΪAICc��6940.712����AIC��6938.527������Ϣ��ָ��ԽСģ��Ч��Խ��,����Ϣ��ָ����,MGWR��GWRģ�͵�ģ��Ч��������MLRģ�͡�MLR��GWR��MGWR����϶ȷֱ�Ϊ0.178��0.366��0.484,���Եĵ�����R2�ֱ�Ϊ0.174��0.309��0.442,����϶�����,����Ϣ���Radiusָ����ֵĽ��һ�¡�
����MGWRģ�Ͷ��س߶ȵ�����,ʹ�ø��ֻ���Э�������������Ӱ��̶ȵĿռ�߶�ЧӦ���Ժܺõ�����,���ֶ��س߶����������MGWRģ�͵�Ԥ������,�������ڶ��س߶ȶ���MGWR�в��Ӱ��,�������Է���������MGWRK��Ԥ�⾫�ȡ�MGWRģ����Բ�ͬ����Э�����Ŀռ�Ӱ�����������˲�ͬ�Ŀռ����,��ʵ�ؽ����˲�ͬ����Э������ͬ�ij߶�����,��GWRģ������ͳһ����ʹ�û���Э�����Ŀռ���س߶�ЧӦ���ڸǡ�
4 ����
�о��������л��ʳ��ֶ�������ƫ�͡��в�ƫ�ߵĿռ���,���зں��Զ�����Դ���������������л����ձ�ƫ�ߡ����س߶ȵ�����Ȩ�ع�����MGWRK���ܹ����õ�ʵ�������л��ʵĿռ�Ԥ��,�����ܹ��õ�������Э��������λ�ñ仯���л���Ӱ��ЧӦ�ı仯,����Ӱ��ЧӦ�ڲ�ͬ����Э���������Ų�һ���Ŀռ�߶ȡ�MGWRK�����Ŀռ�Ԥ�⾫�ȷֱ�ﵽ��RK������69.52%��OK������71.74%��GWRK������71.17%�������л��ʵ�Ӱ�������ڶ�,�����¶ȡ�ˮ��״����ͨ�������ֲ��������ԡ��������Ե�,���Ľ�ѡȡ�˲���Э�������뽨ģ,�ں����о��п�����������꾡�ۺϵĻ������������Ԥ�⾫��,���Ҷ��س߶ȵ�����Ȩ�ع�����������������д���һ���о���
�ο����� ԭ��˳��
������ȵ���
������������
�����ڿ�Ӱ������
[��������: 1]
[��������: 1]
URL [��������: 1]

����й������ɺ���ɺ�������ˮ��ʱ��ʴ����ڷ��䲻����������ص㣬̽����Ϊ��Ч��ũ�O��ģʽ��ʵ��ũҵ���Ȳ���Ч�Ϳɳ�����չ��ͨ��2 a������飬�Ա��о��˲����ǣ�CK����¢����Ĥ�������ǣ�M1����¢�����ǹ����ոѣ�M2����¢����Ĥ�����ոѣ�M3����¢����Ĥ�����ոѣ�M4��5�ּ���ģʽ�������������������������ü������л��ʺ�������̬���ֲ���Ӱ�졣����������������ϲ����������������̵Ķ�̬�仯����Logistic����ģ�͡�����M4���ϲ��������������ֵ��ߣ�������������ʱ�������ϵ��������ϵ��Ҫ�ֲ���0��40 cm���㣬�Ҹ��������£������ֲ���dz�������ơ����ǽոѿ���Ч��������л��ʺ�������ͬ����ģʽ��������̬����ֵ����������ȴ��ڲ��죬���д���M3��M4��̬��������������ֵ�Ա�����200 cm�����ڣ�������������©�������������������ۻ�������Ϊ����Ҷ��������������K���ۻ���Ϊ���Դ���Ҷ����2 a�и����Ǵ���������ֲ�굪���ͼ�����Ч�ʼ�����ƫ��������������P��0.05�����ڶ��ա����д���M4��ƽ������ƫ�������ֱ�ϴ���M1��M2��M3���8.37%��14.93%��3.74%���ۺϷ�����ȫ���;�ˮ���ǣ�M3��M4��������¢����Ĥ�����ոѿɽϺõĴٽ�ֲ���������������գ�ͬʱ��ά�ֵ��������нϴ����ЧDZ�������о���Ϊ�ɺ���ɺ��������Ƽ�����ֲģʽ�����ũҵ�������ṩ�ο���
URL [��������: 1]
����й������ɺ���ɺ�������ˮ��ʱ��ʴ����ڷ��䲻����������ص㣬̽����Ϊ��Ч��ũ�O��ģʽ��ʵ��ũҵ���Ȳ���Ч�Ϳɳ�����չ��ͨ��2 a������飬�Ա��о��˲����ǣ�CK����¢����Ĥ�������ǣ�M1����¢�����ǹ����ոѣ�M2����¢����Ĥ�����ոѣ�M3����¢����Ĥ�����ոѣ�M4��5�ּ���ģʽ�������������������������ü������л��ʺ�������̬���ֲ���Ӱ�졣����������������ϲ����������������̵Ķ�̬�仯����Logistic����ģ�͡�����M4���ϲ��������������ֵ��ߣ�������������ʱ�������ϵ��������ϵ��Ҫ�ֲ���0��40 cm���㣬�Ҹ��������£������ֲ���dz�������ơ����ǽոѿ���Ч��������л��ʺ�������ͬ����ģʽ��������̬����ֵ����������ȴ��ڲ��죬���д���M3��M4��̬��������������ֵ�Ա�����200 cm�����ڣ�������������©�������������������ۻ�������Ϊ����Ҷ��������������K���ۻ���Ϊ���Դ���Ҷ����2 a�и����Ǵ���������ֲ�굪���ͼ�����Ч�ʼ�����ƫ��������������P��0.05�����ڶ��ա����д���M4��ƽ������ƫ�������ֱ�ϴ���M1��M2��M3���8.37%��14.93%��3.74%���ۺϷ�����ȫ���;�ˮ���ǣ�M3��M4��������¢����Ĥ�����ոѿɽϺõĴٽ�ֲ���������������գ�ͬʱ��ά�ֵ��������нϴ����ЧDZ�������о���Ϊ�ɺ���ɺ��������Ƽ�����ֲģʽ�����ũҵ�������ṩ�ο���
[��������: 1]
[��������: 1]
[��������: 1]
[��������: 1]
DOI:10.18402/resci.2016.05.18URL [��������: 2]
Soil organic matter��SOM��is an important representation of soil quality or soil fertility,and its spatial distribution characteristic correlates with the ecological environment regionally. The Mongolia Plateau is in an arid and semi-arid climate zone and disturbed by wind erosion and other natural disasters perennially coupled with destruction of human activities,soil nutrient loss is serious and the local ecologic system is vulnerable. This study took the middle and northern area of the Mongolian Plateau as a study area. Elevation,mean annual temperatures,mean annual precipitation and NDVI were selected as environmental indicators,and correlated with SOM content of sample points to construct a geographically weighted regression model to gain the spatial distribution of SOM. Land cover types were also used in combination with interpolation results to analyze the spatial distribution characteristics of SOM and influence on SOM content. We found that the content of SOM in the study area had regional differences,content in the northern mountainous areas was generally higher than 40%,while in the southern desert area the content was close to zero. Landform and climate were the main factors affecting spatial distribution differences. In the north,there were more mountains covered by forest,bush and grass with plenty of moisture from the Arctic Ocean,beneficial for the accumulation of SOM. In the south it was always desertification area and the soil was barren with rare vegetation,bad for the accumulation of SOM.
[��������: 3]
[��������: 3]
DOI:10.1016/j.geoderma.2016.06.033URL [��������: 2]
[��������: 1]
[��������: 1]
[��������: 1]
[��������: 1]
[��������: 1]
URL [��������: 1]
The aim of this paper was to provide methodological support for understanding the response mechanism of soil properties to external factors and the related spatial distribution, which could also serve as a decision-making reference for farmers and agricultural management authorities. Using geostatistical theory, spatial analysis in GIS and geographically weighted regression (GWR) model, the study analyzed the response of soil organic matter to climatic and socio-economic factors in the central Heilongjiang Province in years of 2000 to 2005. For the period 2005, soil organic matter was spatially interpolated along with auxiliary soil type and pH datasets using Co-Kriging in GIS and the temporal variability analyzed. The result showed that in the western region of the study area, organic matter was higher in the east than in the west. Then in the eastern region of the study area, organic matter was higher in the central zone than in the northern and southern zones. Based on conventional regression model and variance inflation factor (VIF), the paper selected suitable variables for GWR model. Spatial autocorrelation analysis of soil organic matter content yielded global Moran's I index of 0.433 (P = 0.00), indicating that significant spatial autocorrelation in soil organic matter. Thus the GWR model was considered to be suitable for local parameter estimation and was used to determine the relationship between organic matter content and its driving factors. The CV method was used to determine the optimal bandwidth and to establish an adaptive kernel-type GWR model. Results showed that the GWR model accounted for over 57% of the total variance in soil organic matter content in the region. The spatial stability of the strength of the influence of each variable on organic matter content was analyzed. It showed that all variables had significant spatial instability. In addition, the minimum, maximum, upper quartile and lower quartile of the regression coefficients of the variables were largely different, and with both positive and negative correlations. This showed that the influence of each variable on soil organic matter content was spatially variable and was either positive or negative. Results from the GWR model showed that precipitation and annual average temperature negatively influenced organic matter content. Annual sunshine hours positively influenced organic matter content in most areas, except southwest Nenjiang Plain and south Songjiang Plain. The influence of mechanized farming level (as a socio-economic factor) on soil organic matter was positive in both north and west Nenjiang Plain and also in some parts of the Kebai Hills. Irrigation areas had relatively large positive effect on soil organic mat-ter in the study area. Fertilizer had negative effect on soil organic matter in areas of south Nenjiang Plain, northwest Songjiang Plain and northeast Sanjiang Plain, but positive effects in other areas. Mulch film consumption had a large positive effect on soil organic matter. The effect of pesticide consumption on soil organic matter was mainly positive in the west of the study area, while it was mainly negative in the east (all significant at the 0.01 level). It was concluded that the effects of climatic factors (which reflect dif-ferences in natural conditions) and socio-economic factors (which reflect agricultural inputs) on soil organic matter were largely het-erogeneous.
[��������: 1]
[��������: 1]
[��������: 2]
[��������: 2]
[��������: 1]
[��������: 1]
[��������: 1]
[��������: 1]
DOI:10.1016/j.jclepro.2019.118084URL [��������: 1]
DOI:10.11821/dlxb201806007URL [��������: 1]
Research into urban expansion patterns and their driving forces is of great significance. Under the background of the integrated development of the Beijing-Tianjin-Hebei (Jing-Jin-Ji) urban agglomeration, it is important to study the temporal and spatial patterns of urban land expansion and the driving forces development. This paper uses land-use data of the Jing-Jin-Ji urban agglomeration from 1990 to 2015 and reveals the multi-dimensional characteristics of the urban land expansion patterns. We then combine the urban spatial interaction and the spatial and temporal nonstationarity of the urban land expansion process and build the center of gravity-geographically and temporally weighted regression (GTWR) model by coupling the center of gravity model with the GTWR model. Using the center of gravity-GTWR model, we analyze the driving forces of urban land expansion at the city scale, and summarize the dominant mode and core driving forces of the Jing-Jin-Ji urban agglomeration. The results show that: (1) Between 1990 and 2015, the expansion intensity of the Jing-Jin-Ji urban agglomeration showed a down-up-down trend, and the peak period of expansion was in 2005-2010. Before 2005, high-speed development was seen in Beijing, Tianjin, Baoding, and Langfang, which were then followed by rapid development in Xingtai and Handan. (2) Although the center of gravity of cities in the Jing-Jin-Ji urban agglomeration showed a divergent trend, the local interaction between cities was enhanced, and the driving forces of urban land expansion showed a characteristic of spatial spillover. (3) The spatial development mode of the Jing-Jin-Ji urban agglomeration changed from a dual-core development mode to a multi-core development mode, which was made up of three function cores: the transportation core in the northern part, the economic development core in the central part, and the investment core in the southern part. The integrated development between functional cores led to the multi-core development mode. (4) The center of gravity-GTWR model analyzes urban land expansion as a space-time dynamic system. The model proved to be feasible in the analysis of the driving forces of urban land expansion.
DOI:10.11821/dlxb201906012URL [��������: 1]
Villages in mountainous areas are under the risk of topography, geomorphology and frequent natural disasters in a long term. Rural transportation system is characterized by low network degree and weak capacity to resist disasters, and the problem of vulnerability of traffic environment is prominent. Taking Luonan county in the Qinling-Daba mountainous areas as an example and based on exposure, sensitivity and response capacity of human-environment system vulnerability, this paper constructed a basic framework of rural transportation environment vulnerability, which contained the key elements of risk events, geographical features, key travel path, road network structures, public and private vehicles, family capital etc., and established a targeted evaluation index system. With the aid of ArcGIS and GeoDa, this research examined the spatial structure and spatial autocorrelation of the transportation environment vulnerability in Luonan county at the village level. It also utilized a geographical weighted regression model to explore the factors of natural conditions, population, socio-economic development, which had influence on response capacity of traffic risk and its spatial difference. The results showed that the vulnerability of transportation environment took the county seat and the suburbs as the center increasing outward, which presents a circle structure featured by great difference in vertical direction. Simultaneously, the vulnerability of the transportation environment in village-level residential areas showed a significant positive spatial autocorrelation, but both exposure degree and sensitivity showed a significant spatial negative correlation with the response capacity. There were three patterns of local spatial correlation in transportation environment vulnerability: the vulnerability of the local "hot spots" areas was widely observed in the north- central mountainous area and fell into the dilemma of high exposure, high sensitivity and low response capacity, while the "cold spots" villages were founded in suburbs or areas adjacent to the towns with higher income, which had low sensitivity and high response capacity. There were a few "heterogeneity points", and these villages were adjacent to low-vulnerable villages, but they belonged to high-vulnerable areas. Moreover, topographical condition, industrial distribution, population structure, education level and family size had a significant impact on response capacity of transportation risk. In addition, the effect direction and intensity of the influencing factors had significant spatial differences.
[��������: 1]
[��������: 1]
[��������: 1]
[��������: 1]
[��������: 1]
DOI:10.1016/j.cageo.2007.05.001URL [��������: 1]
DOI:10.1016/j.catena.2018.10.052URL [��������: 1]
URLPMID:26572015 [��������: 1]
Relative elevation and stream power index were selected as auxiliary variables based on correlation analysis for mapping soil organic matter. Geographically weighted regression Kriging (GWRK) and regression Kriging (RK) were used for spatial interpolation of soil organic matter and compared with ordinary Kriging (OK), which acts as a control. The results indicated that soil organic matter was significantly positively correlated with relative elevation whilst it had a significantly negative correlation with stream power index. Semivariance analysis showed that both soil organic matter content and its residuals (including ordinary least square regression residual and GWR resi����dual)�� had strong spatial autocorrelation. Interpolation accuracies by different methods were estimated based on a data set of 98 validation samples. Results showed that the mean error (ME), mean absolute error (MAE) and root mean square error (RMSE) of RK were respectively 39.2%, 17.7% and 20.6% lower than the corresponding values of OK, with a relative improvement (RI) of 20.63. GWRK showed a similar tendency, having its ME, MAE and RMSE to be respectively ��60.6%��, ��23.7%�� and 27.6% lower than those of OK, with a RI of 59.79. Therefore, both RK and GWRK significantly improved the accuracy of OK interpolation of soil organic matter due to their incorporation of auxiliary variables. In addition, GWRK performed obviously better than RK did in this study, and its improved performance should be attributed to the consideration of sample spatial locations.
[��������: 1]
[��������: 1]
[��������: 3]
DOI:10.1080/24694452.2017.1352480URL [��������: 3]
URL [��������: 1]
[��������: 2]
[��������: 1]
[��������: 1]
[��������: 1]
[��������: 1]
DOI:10.11707/j.1001-7488.20160717URL [��������: 1]
[Objective] Taking foresters who are taking part in forest carbon sequestration project in Sichuan Province as research objects, this paper analyzed foresters'constant participation willingness and its affecting factors in order to provide countermeasures and suggestions for increasing foresters' enthusiasm to constantly participating forest carbon sequestration project, realizing the construction goal of project and speeding up sustainable development of forestry which is regarded carbon sequestration as the main objective in dealing with global climate change.[Method] Based on the survey data of 397 foresters in Novartis forestry carbon sequestration, community and biodiversity project construction zone in the southwest of Sichuan Province, the orderly Probit model was used to conduct an empirical analysis on foresters' constant participation willingness for forest carbon sequestration project and its affecting factors.[Result] The research results indicated that the willingness of foresters to constantly participate in forest carbon sequestration project was not high, and need to be further improved. The parameters such as land area of participation, family income level, satisfaction for early returns, the late earnings forecast, government support, the degree of difficulty in obtaining the forestry information and road traffic etc. haves significant positive influences on foresters' willingness of constant participation. While the age, multiple occupations level and project organization model showed significant negative effects.[Conclusion] We put forward some suggestions to promote the sustainable development of forest carbon sequestration projects from both business and government. For the forestry entity (enterprise), they should carry out multiple targets considering area, land and population, adjust measurements for local conditions to optimize the organization model of project, balance the early earns and late benefits. As for the government, they should intensify policy support, establish and perfect the forestry information release and disaster warning mechanism, introduce financial support policy to improve infrastructure construction of forest carbon sequestration project area. In this way, the sustainable development of forest carbon sequestration project would be promoted, and then realize the climate improvement, ecological prosperity and income increasing of foresters.
[��������: 1]
[��������: 1]
[��������: 1]
[��������: 1]
[��������: 1]
[��������: 1]
[D].
[��������: 1]
[D].
[��������: 1]
DOI:10.13227/j.hjkx.201705122URLPMID:29964548 [��������: 1]
PM2.5 pollution in China has become an extreme environmental and social problem and has generated widespread public concern. We estimate ground-level PM2.5 from satellite-derived aerosol optical depth (AOD), topography data, meteorological data, and pollutant emissions using a new technique, Bayesian maximum entropy (BME) combined with geographically weighted regression (GWR), to evaluate the spatial and temporal characteristics of PM2.5 exposure in an eastern region of China in winter. The overall 10-fold cross-validation R2 is 0.92, and the root mean squared prediction error (RMSE) is 8.32 ��g��m-3. The mean prediction error (MPE) of the predicted monthly PM2.5 is -0.042 ��g��m-3, the mean absolute prediction error (MAE) is 4.60 ��g��m-3. Compared with the results of the Geographically Weighted Regression model-GWR (R2=0.71, RMSE=15.68 ��g��m-3, MPE=-0.095 ��g��m-3, MAE=11.14 ��g��m-3), the prediction by the BME were greatly improved. In this location, the high PM2.5concentration area is mainly concentrated in North China, the Yangtze River Delta, and Sichuan Basin. The low concentration area is mainly concentrated in the south of China, including the Pearl River Delta and southwest of Yunnan. Temporally, there is migration trend from the coastal areas inland, and PM2.5 pollution is most serious in December 2015 and January 2016. It is relatively low in November 2015 and February 2016.
DOI:10.11820/dlkxjz.2013.01.013URL [��������: 2]
In this paper, based on review of the studies on methods and techniques of terrain information description, topographic unit diversity index (TUDI), a new concept and quantification method, was proposed. The diversity index integrates several terrain parameters, e.g., elevation, slope, slope position, slope aspect, water confluences and distributions information. By combining the algorithms of the topographic position index and the topographic wetness index, using layer overlay analysis method and appropriate indicators for classification and grading, TUDI algorithm re-classifies the types of topographic units, and then calculate the TUDI using the neighborhood statistics and analysis method. The results of the experiment in Sichuan Province as a test region using DEM (100 m×100 m) and waters distribution data (1:250,000, 2005) show that TUDI is a comprehensive index, revealing the complexity and variations of the true surface. In the process of calculation, the topographic units were divided into 13 different types. The topographic unit diversity index was calculated with the statistics window radius set to 900m based on division results of the topographic units. The areas with diversity index value less than 0.5 cover around 11 percent of the whole region; the areas with the value more than 0.75 take up as much as 57 percent. Basically the results of the calculation agree with the topographic features of the study areas. In addition to the experiment to test the reliability of the algorithm, the advantages and disadvantages of it were also evaluated. This research provides a good basis for constructing a conceptual system of DEM-based topographic attributes, as well as for the spatial analysis of terrain information from micro to macro scales.
[��������: 1]
