 ,1,2, 刘晓燕2, 串丽敏3, 杨兰芳,1, 何萍2, 王秀斌2, 仇少君2, 赵士诚2, 徐新朋,2
Effects of Yield and Fertilization on Yield Increase of Winter Wheat in Yangtze Valley Under Optimized Fertilization
HUANG XiaoMeng,1,2, LIU XiaoYan2, CHUAN LiMin3, YANG LanFang,1, HE Ping2, WANG XiuBin2, QIU ShaoJun2, ZHAO ShiCheng2, XU XinPeng,2通讯作者:
责任编辑: 李云霞
收稿日期:2019-11-20接受日期:2020-02-13网络出版日期:2020-09-01
| 基金资助: |
Received:2019-11-20Accepted:2020-02-13Online:2020-09-01
作者简介 About authors
黄晓萌,E-mail:

摘要
关键词:
Abstract
Keywords:
PDF (505KB)元数据多维度评价相关文章导出EndNote|Ris|Bibtex收藏本文
本文引用格式
黄晓萌, 刘晓燕, 串丽敏, 杨兰芳, 何萍, 王秀斌, 仇少君, 赵士诚, 徐新朋. 优化施肥下长江流域冬小麦产量及肥料增产效应[J]. 中国农业科学, 2020, 53(17): 3541-3552 doi:10.3864/j.issn.0578-1752.2020.17.011
HUANG XiaoMeng, LIU XiaoYan, CHUAN LiMin, YANG LanFang, HE Ping, WANG XiuBin, QIU ShaoJun, ZHAO ShiCheng, XU XinPeng.
0 引言
【研究意义】长江流域小麦种植区是我国重要的农业生产基地,其小麦播种面积和小麦产量分别为777.8万hm2和3 829.9万t,分别占全国小麦总耕地面积和总产量的31.7%和28.5%[1]。施肥作为提高粮食产量的重要措施之一,在保证我国小麦产量及粮食安全上发挥着重要作用[2]。农民为了追求高产盲目施用化肥的现象非常普遍,致使化肥施用量不断攀高,我国已成为世界上最大的化肥生产国和消费国,而我国的小麦产量增长率却呈负增长趋势,养分利用效率不断降低[3,4,5]。研究表明我国小麦的氮、磷和钾肥的平均生理利用率仅为28.3、67.8和17.4 kg·kg-1[4],氮肥的平均偏生产力仅为28.0 kg·kg-1 [6],氮、磷和钾肥平均利用率分别为32.0%、19.0%和44.0%[7],仍处于较低水平。大量养分资源投入致使土壤养分盈余过剩[8,9],如华北平原和太湖流域的土壤氮素养分的盈余量介于200.0—256.0 kg N·hm-2 [10]。因此,合理地进行养分管理以促使小麦产量与肥料利用率协同发展变得尤为重要。【前人研究进展】诸多****开展了关于提高小麦产量和肥料利用率方面的田间试验研究,如赵营等[11]的研究表明,与农民习惯施肥措施相比,优化施肥在不降低产量的前提下,可节约29.0%的氮肥,提高6.4%—7.3%的肥料利用率,并减少24.0%—44.0%的土壤氮素盈余;苏瑞光等[12]在不同土壤类型上的优化施肥研究表明,应用小麦养分专家系统和ASI法推荐施肥均可提高5.0%以上的小麦产量;以小麦生育期养分需求规律为基础,根据土壤水分和养分进行优化的水肥管理,可节约氮肥一半以上[13];以及刘德平等[14]应用“3414”试验可以得出小麦的最佳施肥量范围。【本研究切入点】分析可获得产量、施肥后的增产效应和肥料利用率特征参数将有助于优化养分管理措施,但长江流域作为冬小麦的重要产区还缺少此方面参数的综合分析。【拟解决的关键问题】本文通过汇总分析我国长江流域开展的1 732个田间试验,探究长江流域冬小麦在优化施肥下的产量和肥料利用率特征,以期为长江流域冬小麦推荐施肥和优化养分管理措施提供数据支撑,实现减肥增效。1 材料与方法
研究区域为长江流域冬小麦种植区各省(市),试验数据按照长江上游至下游流经的省(市),即四川、云南、贵州、重庆、湖北、安徽、江苏、浙江和上海的顺序进行归纳整理分析。1.1 数据来源
本研究的试验数据来源于国际植物营养研究所(IPNI)中国项目组于2000—2018年在中国长江流域开展的小麦田间试验,以及此期间在学术期刊上公开发表的文章,其中文献数据来源于中国知网数据库(CNKI)通过检索关键词及关键词组合“冬小麦”、“冬小麦+产量”及“冬小麦产量+肥料利用率”等得到的中文文献,所有数据均来自于田间试验,共计1 732个田间试验。试验涵盖了长江流域冬小麦主要种植区域,试验类型主要包括“3414”试验、不同肥料用量试验、减肥试验、耕作措施试验等,处理包括优化施肥处理、农民习惯施肥处理、以及基于这两个处理的减氮、减磷和减钾处理等。长江流域冬小麦产区的试验点气候和土壤理化性状见表1。Table 1
表1
表1长江流域冬小麦试验点信息
Table 1
| 省(市) Province | 样本数 No. of samples | 小麦种植面积 Wheat planting area(×103 hm2) | 土壤类型 Soil type | 降雨量 Precipitation (mm) | pH | 有机质 OM (g·kg-1) | 碱解氮 Hydrolyzable N (mg·kg-1) | 速效磷 Olsen P (mg·kg-1) | 速效钾 Available K (mg·kg-1) |
|---|---|---|---|---|---|---|---|---|---|
| 四川 Sichuan | 186 | 64.2 | 潮土、棕壤土、水稻土 Fluvo-aquic soil, Brown soil, Paddy soil | 900-1800 | 5.5-8.2 | 1.6-48.6 | 13.4-191.3 | 1.8-62.4 | 23.9-130.4 |
| 云南 Yunnan | 89 | 343.7 | 水稻土、红壤土、紫色土 Paddy soils, Red soil, Purplish soil | 600-1500 | 4.3-7.8 | 16.5-60.9 | 21.9-224.0 | 5.0-50.8 | 23.9-133.0 |
| 贵州 Guizhou | 35 | 156.0 | 黄壤土、紫色土 Yellow soil, Purplish soil | 700-1500 | 6.1-7.6 | 1.5-32.0 | 53.0-165.0 | 5.0-25.3 | 44.5-123.2 |
| 重庆 Chongqing | 20 | 30.1 | 黄壤土、水稻土、紫色土 Yellow soil, Paddy soil, Purplish soil | 900-1600 | 6.5-7.7 | 9.6-31.2 | 7.8-145.0 | 3.0-26.6 | 58.8-182.4 |
| 湖北 Hubei | 106 | 1153.2 | 潮土、棕壤土、黄棕壤土 Fluvo-aquic soil, Brown soil, Yellow-brown soil | 800-1600 | 4.8-8.3 | 11.0-43.2 | 42.0-167.3 | 2.9-34.8 | 37.1-166.0 |
| 安徽 Anhui | 451 | 2822.8 | 黑土、潮土、水稻土 Black soil, Fluvo-aquic soil, Paddy soil | 600-1500 | 4.1-8.4 | 4.0-28.4 | 7.6-139.1 | 1.6-56.6 | 40.4-270.0 |
| 江苏 Jiangsu | 751 | 2412.8 | 棕壤土、水稻土、潮土 Brown soil, Paddy soil, Fluvo-aquic soil | 800-1400 | 5.2-8.5 | 1.1-46.3 | 7.3-186.3 | 2.3-83.1 | 23.8-213.0 |
| 浙江 Zhejiang | 69 | 103.7 | 水稻土、红壤土 Paddy soil, Red soil | 1000-1800 | 3.4-8.3 | 10.8-60.1 | 106.0-318.0 | 0.7-98.5 | 20.0-237.0 |
| 上海 Shanghai | 29 | 21.0 | 黄棕壤、水稻土,紫色土 Yellow-brown soil, Paddy soil, Purplish soil | 700-1700 | 6.1-7.9 | 10.8-27.9 | 34.5-134.0 | 9.4-50.1 | 62.0-164.0 |
新窗口打开|下载CSV
1.2 数据分析与统计
作物产量和肥料利用率特征是优化养分管理和提高小麦施肥水平的关键,探讨可获得产量及肥料增产效应有助于确定粮食产量目标,分析和制定农业管理措施,对确定地区粮食增产潜力、农业的可持续发展至关重要[15]。本研究中,采用可获得产量即在田间或试验站的试验条件下可以获得的最大产量来表征优化施肥处理产量。使用产量反应表征肥料的增产效应,相对产量表征土壤的基础养分供应能力,农学效率和偏生产力表征肥效。以氮为例计算公式如下,磷、钾计算同氮:氮产量反应(yield response to N fertilizer application,YR-N,t·hm-2)= 氮磷钾全施处理产量-不施氮处理产量,磷和钾产量反应分别用YR-P和YR-K表示;
氮相对产量(relative yield to N fertilizer application,RY-N)= 不施氮处理产量/氮磷钾全施处理产量,磷和钾相对产量分别用RY-P和RY-K表示;
氮农学效率(agronomic efficiency to N fertilizer application,kg·kg-1,AE-N)= (氮磷钾全施处理产量-不施氮处理产量)/施氮量,磷和钾农学效率分别用AE-P和AE-K表示,氮、磷和钾分别为N、P2O5和K2O;
氮偏生产力(partial factor productivity to N fertilizer application,kg·kg-1,PFP-N)=氮磷钾全施处理产量/施氮量,磷和钾偏生产力分别用PFP-P和PFP-K表示,氮、磷和钾分别为N、P2O5和K2O。
采用Microsoft Excel 2010和Sigmaplot 10.0对数据进行计算和图表绘制,用SPSS 17对数据进行方差分析,采用LSD最小极差法在0.05水平上进行多重比较。
2 结果
2.1 可获得产量分布特征
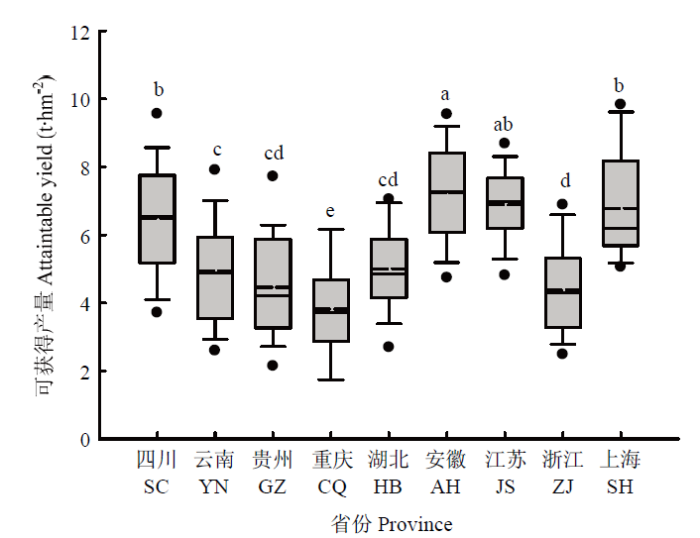
优化施肥措施的产量结果显示(图1),我国长江流域冬小麦的平均产量可达6.6 t·hm-2,但各省(市)的可获得产量变异范围较大,其变化范围为1.4—14.6 t·hm-2,其中浙江省、重庆市、云南省和贵州省的产量变异系数超过30.0%。下游的产量整体要高于上游和中游,其中以安徽省冬小麦的平均可获得产量最高,平均为7.3 t·hm-2,其次为江苏省、上海市和四川省,平均可获得产量分别为6.8、6.7和6.5 t·hm-2。云南省、湖北省、贵州省和浙江省的冬小麦平均可获得产量则处于相对较低水平,分别为4.9、4.9、4.4和4.3 t·hm-2。而重庆市冬小麦的平均可获得产量最低,仅为3.6 t·hm-2。图1
 新窗口打开|下载原图ZIP|生成PPT
图1长江流域各省(市)冬小麦可获得产量比较
中间实线代表中值,短线代表均值,不同字母表示差异达5% 显著水平,方框上下边缘、上下实线和实心圆圈分别代表上下25%的数值、90% 和10% 的数值、95% 和5% 的数值。下同
Fig. 1Comparison of attainable yield of winter wheat among provinces in Yangtze Valley
The middle solid line represents the median value and the short line represent the mean value, the different letters represent the significant difference of 5%, the upper and lower edges of the box, the upper and lower solid lines, and the solid circle represents represent the upper and lower 25%, the 90% and 10% values, the 95% and 5% values. SC: Sichuan; YN: Yunnan; GZ: Guizhou; CQ: Chongqing; HB: Hubei; AH: Anhui; JS: Jiangsu; ZJ: Zhejiang; SH: Shanghai。The same as below
2.2 产量反应和相对产量分布特征
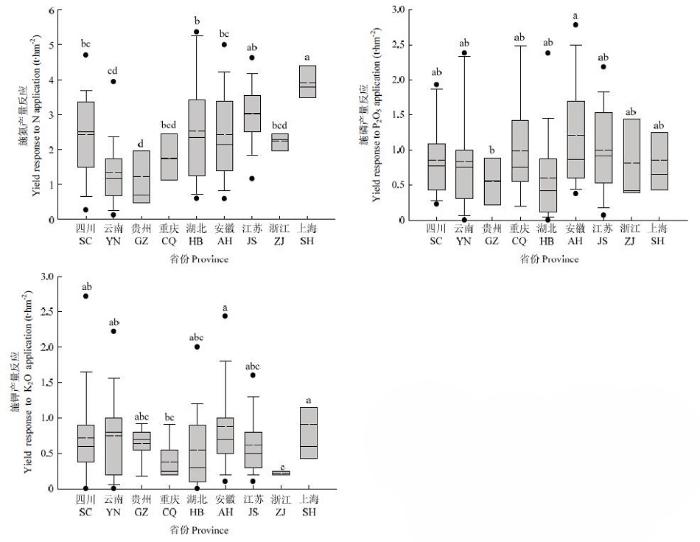
优化施肥措施下的肥料产量反应(YR)结果显示,长江流域冬小麦施用氮、磷和钾肥的平均YR分别为2.3、0.9和0.6 t·hm-2,氮肥产量反应(YR-N)明显高于磷肥产量反应(YR-P)和钾肥产量反应(YR-K)(图2)。其中安徽省、湖北省、云南省、四川省和贵州省的YR-N的变异系数均超过50.0%,其中有18.6%的样本高于3.6 t·hm-2,处于1.4—3.6 t·hm-2的YR-N占总样本的64.4%,上海市的YR-N均值高于其他省份,为3.9 t·hm-2,其次为江苏省,为3.0 t·hm-2,湖北省、四川省、安徽省和浙江省的YR-N均值较为接近,分别为2.5、2.4、2.4和2.2 t·hm-2,YR-N均值较低的省份为重庆市、云南省和贵州省,分别为1.8、1.4和1.2 t·hm-2。各省的YR-P变异系数均超过60%,其中YR-P介于0.3—1.7 t·hm-2之间的占全部样本数的70.2%,以安徽省的YR-P均值最高,为1.2 t·hm-2,较低的YR-P均值出现在湖北省和贵州省,均为0.6 t·hm-2,其余各省(市)的平均YR-P主要分布在0.8—1.0 t·hm-2之间。长江流域的YR-K总体较低,除浙江和贵州外,各省(市)数据变异系数均在70%以上,YR-K处于0.2—1.2 t·hm-2的占全部样本数的69.9%,最高的YR-K均值出现在上海市和安徽省,均为0.9 t·hm-2,较低的YR-K均值出现在浙江省,为0.2 t·hm-2,其余各省(市)的YR-K的平均值分布在0.5—0.7 t·hm-2之间。就总体情况而言,上海市施用氮、磷和钾肥的增产效果最好,贵州省的则最差。图2
 新窗口打开|下载原图ZIP|生成PPT
图2长江流域各省(市)冬小麦氮、磷和钾肥产量反应
Fig. 2Comparison of yield response to N, P and K fertilizer application for winter wheat among provinces in Yangtze Valley
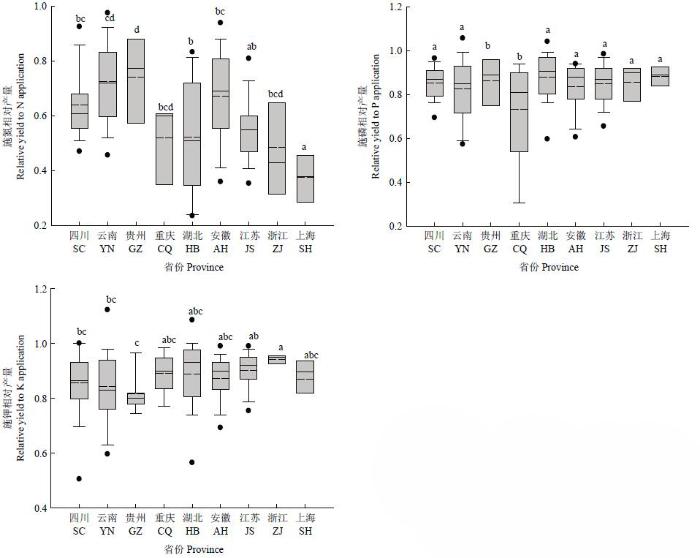
优化施肥措施下的相对产量(RY)显示,长江流域冬小麦施用氮、磷和钾肥的平均RY分别为0.6、0.8和0.9(图3)。各省(市)的氮、磷和钾肥的RY存在较大差异,其中RY-N数据的变异系数范围为19.4%—43.0%,有65.2%的RY-N处于0.4—0.7之间,以贵州省和云南省的RY-N均值最高,为0.7,以浙江省和上海市的最低,分别为0.5和0.4,其余各省(市)的平均RY-N分布在0.5 —0.6之间。重庆市具有较低的RY-P均值(0.7)且具有较高的变异系数,为29.1%,其他各省(市)的RY-P均值较为接近,普遍在0.8左右,变异系数范围为5.6%—18.0%。最高的平均RY-K出现在浙江省,为0.9,最低的出现在贵州省,为0.8,其余各省的RY-K较为接近,平均值都处于0.8—0.9之间,且各省内的变异系数范围为2.0%—15.5%。
图3
 新窗口打开|下载原图ZIP|生成PPT
图3长江流域各省(市)冬小麦氮、磷和钾肥相对产量
Fig. 3Comparison of relative yield to N, P and K fertilizer application for winter wheat among provinces in Yangtze Valley
2.3 农学效率和偏生产力特征
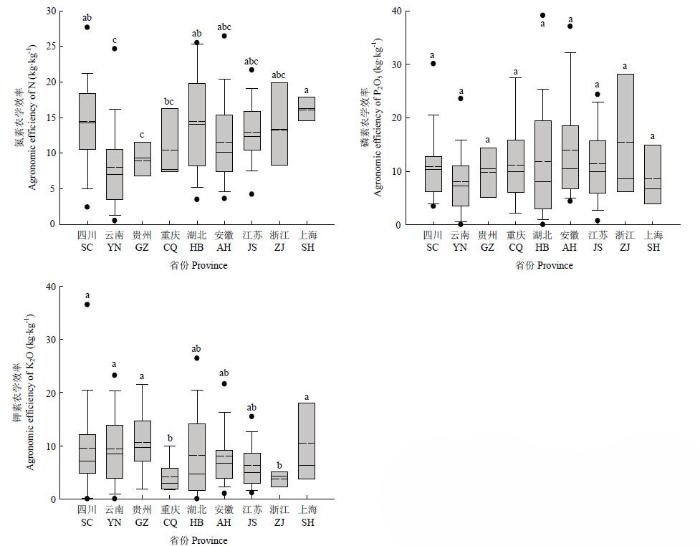
农学效率(AE)结果表明(图4),在优化施肥处理下,我国长江流域冬小麦的平均AE-N、AE-P和AE-K分别为12.6、11.6和7.7 kg·kg-1。AE-N中,有68.0%的样本处于7.4—18.2 kg·kg-1之间,变异系数为11.4%—82.4%,以上海市的平均AE-N最高,为16.1 kg·kg-1,云南省的最低,为7.9 kg·kg-1,主要是因为该省的YR-N较低,其他各省份的AE-N平均值处于10.5—14.5 kg·kg-1之间,且无显著差异。AE-P中,各省数据的变异系数均高于58.6%,处于4.6—19.8 kg·kg-1的AE-P占总样本数的67.4%,AE-P均值以浙江省最高,为15.4 kg·kg-1,云南省最低,为8.1 kg·kg-1,江苏省、湖北省和云南省的AE-P最低值接近于零,其余各省的AE-P的平均值处于8.6—14.0 kg·kg-1之间,且无显著差异。各省(市)AE-K的数据变异范围为39.7%—98.3%,有63.9%的样本分布在2.8—12.9 kg·kg-1,各省(市)间AE-K差异较大,四川省、云南省、贵州省和上海市的平均值均高于9.3 kg·kg-1,而浙江省和重庆市都低于4.1 kg·kg-1,AE-K在湖北省、云南省和四川省的最小值都接近于零。图4
 新窗口打开|下载原图ZIP|生成PPT
图4长江流域各省(市)冬小麦氮、磷、钾肥农学效率
Fig. 4Comparison of agronomic efficiency to N, P and K fertilizer application among provinces in Yangtze Valley
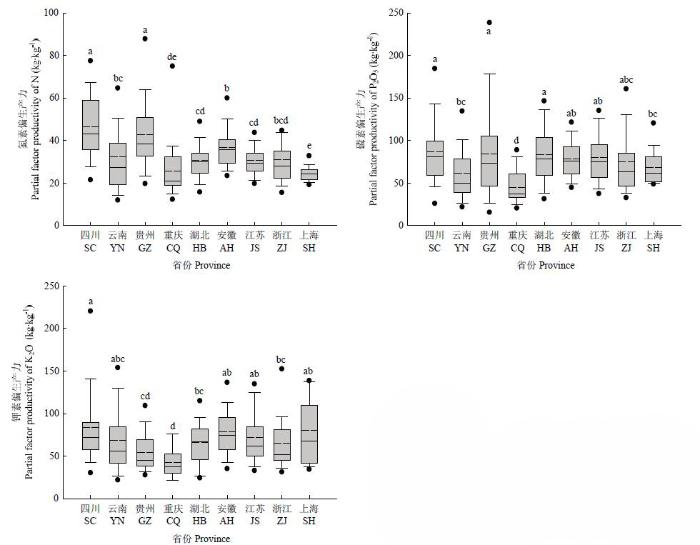
优化施肥处理的偏生产力(PFP)结果表明(图5),长江流域冬小麦的PFP-N、PFP-P和PFP-K的平均值分别为34.0、78.9和73.4 kg·kg-1。PFP-N中,各省(市)变异系数范围为14.3%—83.6%,且70.0%的样本分布在23.4—42.8 kg·kg-1,PFP-N的均值以四川省和贵州省的最高,且显著高于其他各省(市),分别为46.6和42.6 kg·kg-1,重庆市和上海市较低,分别为25.7和24.4 kg·kg-1,其他各省(市)的平均PFP-N介于30.6—36.7 kg·kg-1之间。PFP-P中,各省(市)变异系数范围为29.0%—65.4%,其中68.1%样本的PFP-P分布于49.2—108.8 kg·kg-1之间,重庆市的PFP-P均值显著低于其他各省(市),为44.7 kg·kg-1,其余各省的平均PFP-P介于61.7—87.2 kg·kg-1之间。PFP-K中,各省(市)变异系数范围为37.9%—57.6%,其中67.8%样本处于42.5—103.2 kg·kg-1之间,以四川省的平均值最高,为83.8 kg·kg-1,重庆市最低,为42.4 kg·kg-1,其他各省(市)的平均PFP-K介于54.3—80.4 kg·kg-1之间。
图5
 新窗口打开|下载原图ZIP|生成PPT
图5长江流域各省(市)冬小麦氮、磷和钾肥偏生产力
Fig. 5Comparison of fertilizer partial productivity to N, P and K fertilizer application among provinces in Yangtze Valley
2.4 优化施肥措施与农民习惯施肥措施比较
在分析优化施肥与农民习惯施肥措施间产量及利用率差异时,采用同时具有这两个处理的试验(n≈337,四川18个,云南24个,贵州2个,重庆3个,湖北17个,安徽76个,江苏150个,浙江39个,上海8个)。结果显示,与农民习惯施肥措施相比(表2),优化施肥措施显著提高了长江流域冬小麦产量,平均增加了0.5 t·hm-2,平均增幅为8.8%,变化范围为1.3%—59.1%;显著降低了氮、磷和钾肥的用量,平均减少了25.6%、24.1%和32.9%;显著提高了AE和PFP,其中AE-N、AE-P和AE-K平均分别增加了3.9、6.9和4.4 kg·kg-1;PFP-N、PFP-P和PFP-K平均分别提高了12.1、19.1和25.4 kg·kg-1。Table 2
表2
表2优化施肥和农民习惯施肥产量及利用率比较
Table 2
| 参数 Parameter | 优化施肥措施 Optimal practice | 农民习惯施肥措施 Farmers’ practice |
|---|---|---|
| 产量 Yield (t·hm-2) | 6.2±1.6a | 5.7±1.7b |
| 施氮量 Fertilizer N application (kg·hm-2) | 154.0±34.0b | 207±69.0a |
| 施磷量 Fertilizer P2O5 application (kg·hm-2) | 63.0±14.0b | 83±52.0a |
| 施钾量 Fertilizer K2O application (kg·hm-2) | 55.0±10.0b | 82±43.0a |
| 氮肥农学效率AE-N Agronomic efficiency of N (kg·kg-1) | 13.4±6.8a | 9.5±4.0b |
| 磷肥农学效率AE-P Agronomic efficiency of P (kg·kg-1) | 12.6±9.0a | 5.7±11.1b |
| 钾肥农学效率AE-K Agronomic efficiency of K (kg·kg-1) | 9.6±8.3a | 5.2±6.4b |
| 氮肥偏生产力PFP-N Partial factor productivity of N (kg·kg-1) | 40.6±18.3a | 28.5±10.2b |
| 磷肥偏生产力PFP-P Partial factor productivity of P (kg·kg-1) | 100.5±37.4a | 81.4±36.9b |
| 钾肥偏生产力PFP-K Partial factor productivity of K (kg·kg-1) | 113.5±47.1a | 88.1±51.1b |
新窗口打开|下载CSV
3 讨论
分析可获得产量,有助于决策者确定目标产量,并优化作物养分管理措施。长江流域的集约化农业生产体系在保障我国粮食安全方面发挥着不可替代的作用。品种改良和优化管理等措施显著提高了小麦产量[16,17,18],本研究中长江流域冬小麦优化施肥处理可获得产量的平均值可达6.6 t·hm-2,高于国家农业部统计的全国冬小麦的平均单产(5.6 t·hm-2)[1],与农民习惯施肥措施相比,优化施肥处理的产量平均提高了0.5 t·hm-2,占农民实际获得产量的8.8%,即如果农民采用良好的养分管理策略,其小麦产量可提高8.8%。然而整个长江流域不同区域的土壤类型、气候条件和种植制度等存在明显差异,造成不同省(市)的小麦可获得产量存在明显异质性[19],如冬小麦-夏玉米轮作体系且具有灌溉条件的安徽省和江苏省具有较高的可获得产量,而冬小麦-水稻轮作体系且降雨量大的区域其可获得产量相对较低。肥料增产效应很大程度上取决于土壤养分供应能力,相对产量可以表征土壤的基础养分供应能力,而产量反应可以反映施肥的增产效应[20]。本研究中的RY-P与RY-K与吴良泉[21]的研究结果基本一致,均为0.8和0.9,YR-N、YR-P和YR-K也均高于2001—2005年全国小麦肥料增产效应的平均水平(1.9、0.8和0.4 t·hm-2)[22]。当前小麦的过量施肥现象非常普遍,过量的养分残留在土壤中导致土壤基础养分供应过高,施肥效果不显著,即具有较高的相对产量和较低产量反应[23]。LIU等[24]研究表明,长江中下游的氮、磷和钾的土壤基础养分供应可以分别达到91.2、33.7和92.0 kg·hm-2,与1985—1995年土壤基础养分供应数据[25]相比(N、P和K分别为54.1、14.2和93.4 kg·hm-2),氮和磷的土壤基础养分供应量已大幅增加。本研究中,有些地区不施某种养分处理的产量高于氮磷钾全施处理,如云南省和湖北省的RY-P和RY-K最高值已超过1.0,说明土壤具有较高的土壤磷和钾养分供应,因此需要因地制宜地设计养分管理方案,合理利用土壤的基础养分供应,调控肥料用量,进而提高肥料增产效应。YR中以YR-N最高,表明氮仍是长江流域冬小麦产量的主要养分限制因子。
不合理的化肥施用导致肥料利用率降低,过量的养分残留在土壤中或流失到环境中,对生态环境安全构成威胁。串丽敏等[26]的研究结果显示,长江中下游冬小麦氮肥投入量已超过183.0 kg·hm-2,远远超出了养分允许平衡盈亏率。吴良泉等[21]对整个长江流域冬小麦肥料的推荐用量研究表明,氮、磷和钾施用量分别为165.0 kg N·hm-2、68.0—70.0 kg P2O5·hm-2和53.0 kg K2O·hm-2时可以达到最佳的产投比。在四川省的肥料用量试验结果表明,氮、磷和钾的施用量在96.0 kg N·hm-2、60.0 kg P2O5·hm-2和45.0 kg K2O·hm-2下即可维持小麦产量,且能提高肥料利用率并降低土壤养分盈余[27]。本研究中,优化施肥处理的施肥量显著低于农民习惯施肥措施,显著提高了肥料利用效率,其中AE-N、AE-P和AE-K分别提高了41.1%、121.1%和84.6%,PFP-N、PFP-P和PFP-K提高了42.4%、23.5%和25.4%。与早期的统计数据相比[22,28-29],优化施肥处理显著提高了AE-P和AE-K,但AE-N仍远低于世界平均水平(22 kg·kg-1)[30]。已有研究表明,在合理的肥料施用和管理措施下,AE-N可以达到25.0 kg·kg-1以上[31]。全球的PFP-N需要保持每年平均0.1%—0.4%的增长率才能满足粮食需求[32],本研究中,优化施肥下的偏生产力高于CHUAN等[29]的研究结果(PFP-N、PFP-P和PFP-K分别为32.9、65.9和48.0 kg·kg-1)。然而肥料利用率的高低不仅仅与作物施肥量有关,还需要结合生长环境和养分管理措施才能有效提高肥效,如不同水分条件,轮作体系等等[4,10,15]。对于整个长江流域冬小麦种植区而言,其养分效率还有待进一步提高,而科学的养分管理对于提高肥料利用效率和保障产量上具有重要意义。
优化施肥处理对长江流域冬小麦具有显著增产效果,本研究中增幅范围可达1.3%—59.1%,但为维持小麦高产,提高养分利用率,除优化施肥外,仍需从土壤养分供应、肥料调控与种植方式等诸多方面针对长江流域冬小麦进行综合管理。土壤肥力直接决定着小麦产量和施肥量,并最终影响肥料利用率,通过培肥地力,可以达到削减肥料用量,实现小麦增产的目的[33],本研究中四川、云南、湖北等省份的部分地区产量反应接近于零,表明土壤具有较高的基础养分供应能力,施肥的增产效果较低,可以通过降低肥料投入来增加肥料利用效率。采用有机替代化肥、控释肥与普通肥料配施、硝化抑制剂等肥料调控措施也是优化养分管理的重要举措,可以促进作物增产,减少肥料损失,提高肥料利用率,也是我国“十三五”计划“两减”重大专项和“2020年化肥零增长行动计划”重点研究方向之一[34]。已有研究表明,许多地区在当前施肥水平下减氮20%,不仅能够保证产量,还能显著提高肥料利用率,而在优化施氮条件下,施用控释尿素的氮肥效率更高[35]。施用小麦专用肥料并结合恰当的耕种方式可以在减少化肥投入的同时,增产6.1%—11.3%,节约生产成本[36]。合理增加种植密度可在保障产量的前提下减少15.0%—30.0%的施氮量,并显著提高氮肥农学效率[37]。此外,改变单一的种植模式、调整茬口作物的种类,如将大豆和花生作为冬小麦种植区两熟复种模式的前茬作物,可以增加农田生物多样性,增强农田的持续生产力[16]。采取相关的养分管理措施,如氮肥后移,能不同程度地促进产量提高,最高可达22.2%[38]。而农民在施肥时对作物生长环境、土壤类型、土壤养分、作物轮作系统及环境差异缺乏考虑,都将导致产量损失和养分利用率降低。本研究主要分析了施肥量对产量和肥料利用率的影响,如果将土壤培肥、种植模式和肥料调控等综合为一个有机整体,包括“4R”精准养分管理技术(合适的肥料种类、合适的肥料用量、合适的施肥时间、合适的施肥位置)及合理的水肥调控等技术,从不同角度采取不同的作物管理措施进行集约化管理将有效促进我国长江流域冬小麦高产高效生产。
4 结论
优化施肥措施下长江流域各省(市)冬小麦产量存在明显差异性,以安徽省、江苏省和四川省的产量最高。总体而言,长江流域冬小麦的氮磷钾平均产量反应分别为2.3、0.9和0.6 t·hm-2,平均农学效率分别为12.6、11.6和7.7 kg·kg-1,平均偏生产力分别为34.0、78.9和73.4 kg·kg-1。由于气候、土壤和轮作制度等差异,产量反应、农学效率和偏生产力各省(市)间存在显著差异性。但与农民习惯施肥措施相比,优化施肥措施显著提高了小麦产量,平均增加了0.5 t·hm-2,氮、磷和钾肥的农学效率增幅均超过40%,偏生产力增幅均超过20%。可见优化施肥具有显著增产增效的作用,这仅仅是优化了肥料用量、施肥时间和施肥比例,如果与其他耕作管理措施相结合,效果将更佳。参考文献 原文顺序
文献年度倒序
文中引用次数倒序
被引期刊影响因子
[本文引用: 2]
[本文引用: 2]
DOI:10.1093/jxb/err132URLPMID:21551079 [本文引用: 1]

China has to feed 20% of the global population with only about 5% of the planet's water resources and 7% of its arable land. With such limited natural conditions, however, China's grain production has increased from about 200 kg per capita in 1949 to about 400 kg in the early 1990s. Hunger as a social problem has largely disappeared after being prevalent in China for several thousand years with the rise and decline of dynasties. This achievement has been accompanied by a 2.5-fold increase in the population and a 4.5-fold increase in total grain production. Although total cropped land has increased slightly in some areas, land used for cropping has decreased from 0.18 hectare per capita in the 1950s to less than 0.1 hectare per capita today. Apparently, yield increase or improved land productivity is the major contributor to the increase of food production per capita. What are the major reasons for the unprecedented achievement in China's food production? Political decisions, good or bad, on land distribution and ownership changes, have caused unusual fluctuation in grain production. Technical progress, however, has maintained a long-term increasing trend. The semi-dwarf cultivars of rice and wheat, the use of heterosis in rice and maize, and the alleviation of salinized soil stress in the major grain-producing areas have all played significant roles in increasing China's food production capability.
[本文引用: 1]
[本文引用: 3]
[本文引用: 3]
[本文引用: 1]
[本文引用: 1]
[本文引用: 1]
[本文引用: 1]
[本文引用: 1]
[本文引用: 1]
DOI:10.3864/j.issn.0578-1752.2018.14.009URL [本文引用: 1]
DOI:10.3864/j.issn.0578-1752.2018.14.009URL [本文引用: 1]
DOI:10.1016/j.agee.2015.02.014URL [本文引用: 2]
[本文引用: 1]
[本文引用: 1]
[本文引用: 1]
[本文引用: 1]
[本文引用: 1]
[本文引用: 1]
DOI:10.3724/SP.J.1011.2014.30634URL [本文引用: 1]
针对内蒙古河套灌区农业面源污染的现状, 本研究以内蒙古河套灌区常规作物小麦和玉米为供试材料, 采取 "3414" 部分实施方案, 对氮、磷肥的施用效应及养分交互作用进行了研究, 探讨进一步削减当地农业生产过程中的肥料用量的施肥技术。结果表明: 小麦/玉米套作条件下, 作物产量与氮、磷肥施用量之间满足二次型回归模型, 氮肥、磷肥及氮磷交互效应对产量产生显著影响, 氮磷交互作用>氮>磷。在施肥水平较低时, 氮、磷肥表现出较好的协同促进作用, 在达到产量的极限值后, 则表现为无效及拮抗作用; 中氮中磷处理能够较好地满足作物生长发育过程中对氮和磷的需求, 提高作物对氮、磷的利用率。但随着施肥量的进一步增加, 作物植株吸肥量也随之增加, 施肥效益降低, 肥料利用率持续下降。通过对氮、磷单因素及二因素肥料效应的分析, 对施肥水平做进一步优化, 得出小麦最佳施氮量为167.67~196.61 kg?hm-2, 最佳施磷量为130.43~186.64 kg?hm-2; 玉米最佳施氮量为222.10~299.14 kg?hm-2, 最佳施磷量为156.14~188.00 kg?hm-2。这将为进一步削减氮、磷配施量, 改善当地土壤养分平衡, 减轻农业面源污染提供一定的指导作用。
[本文引用: 2]
[本文引用: 2]
[本文引用: 2]
DOI:10.3864/j.issn.0578-1752.2018.14.011URL [本文引用: 1]
【Objective】The objective of the study was to determine the effects of film mulching cultivation on yield formation and nitrogen uptake-translocation of winter wheat in dry highland of Loess Plateau, so as to provide important basis for high yield and high efficiency in rainfed winter wheat production.【Method】An experiment was conducted to study the effects of interactions between different fertilization and film mulching practices on yield formation of winter wheat, aboveground nitrogen accumulation and translocation, soil nitrate-N residue and N balance in soil-plant system by four cultivation patterns, including farmer pattern (PF), farmer fertilization rate plus ridge mulching-furrow planting (RFSF1), monitoring fertilization plus ridge mulching-furrow planting (RFSF2) and monitoring fertilization plus whole field filming with soil covering and hole-seeding (WFFHS), during 2012-2016 in winter wheat growing region of dry highland in Southern Shanxi. 【Result】Obtained results showed that average yield of winter wheat under traditional farmer pattern was 3 367 kg·hm-2 , which could be increased to 4 491 kg·hm-2 by optimized fertilization combined with mulching cultivation. The contribution rate of optimized fertilization on yield was 14.8%, and the synergy contribution rate of mulching and optimized fertilization was up to 24.7%-42.1%. The yield formation mainly depended on spikenumberperhectare, followed by thousand kernelweight in dry high land of Loess Plateau. Due to the reasonable population construction and favorable water and nutrientconditions, the spikenumber per hectare, 1000-grain weight and yield of WFFHS treatment were the highest, with the mean value of 5.81million·hm-2, 44.3 g and 4 785 kg·hm-2, respectively. In terms of aboveground nitrogen translocation, a significant positive correlation was observed between nitrogen translocation amount from vegetative organs to grains after anthesis and biomass or grain yield, the correlation coefficients were 0.959** and 0.960**, respectively. Aboutthree quartersofN in grain were from translocation of vegetative organs before anthesis, and a quarter from root uptake after anthesis under the PF treatment, optimized fertilization combined with mulching cultivation remarkably increased the nitrogen translocation amount from vegetative organs to grains, the translocation contribution rate was 81.4%-88.8%. In terms of soil nitrate-N residue, the accumulation amounts of nitrate nitrogen of 1 m soil layer had been over 100 kg·hm-2 on account of long-term excessive fertilization in Loess Plateau, and the peak of nitrate nitrogen accumulation was 20-60 cm layer. After successive planting of winter wheat for 4 years, the accumulation amounts of nitrate nitrogen in 2 m soil layer under traditional fertilization rate had been up to 277 kg·hm-2, of which 75% concentrated on 0-120 cm soil layer, with a 87.7% increase since pre-sowing of 2012. However, the amounts of nitrate nitrogen accumulation in 2 m soil layer under optimized fertilization combined with mulching cultivation was only 15.7%-24.2% higher than that at pre-sowing in 2012. Meanwhile, it was found that nitrate nitrogen accumulation in 120-200 cm at harvest stage in 2016 was 10.2%-133.7% higher than that at pre-sowing in 2012, which indicated that the residual nitrate nitrogen had a strong leaching downward trend. With considering of aftereffect of residual N, the soil N balance for 4 years was overall analyzed, and it was observed that the N utilization efficiency was 28.8%-56.7%, the N apparent residualrate was 12.1%-28.9%, and the N apparent loss rate was 31.2%-49.6% in dry highland of Loess Plateau. Optimized fertilization combined with mulching cultivation could reduce the apparent nitrogen loss and the residual Nmin, increase the apparent mineralized nitrogen. The WFFHS treatment could utilize the residual Nmin and mineralized nitrogen ina more great extent, which accumulated in the previous years, so the WFFHS treatment had lowest nitrogen apparent loss rate (31.2%) and N apparent residualrate (12.1%), highest N utilization efficiency (56.7%) among all the treatments.【Conclusion】it was concluded that whole field filming with soil covering and hole-seeding combined with monitoring fertilization cultivation could further improve the soil water and fertilizer condition, utilize the residual Nmin, increase the aboveground nitrogen accumulation and translocation, construct reasonable population, and obtain the remarkable yield increasing effect and higher N utilization efficiency finally. So it was considered as a recommendable cultivation mode in dryland of Loess Plateau.
[本文引用: 1]
[本文引用: 1]
[D].
[本文引用: 1]
[D].
[本文引用: 1]
DOI:10.1016/j.fcr.2015.11.011URL [本文引用: 1]
[D].
[本文引用: 2]
[D].
[本文引用: 2]
[本文引用: 2]
[本文引用: 2]
DOI:10.1016/j.fcr.2012.09.020URL [本文引用: 1]
The inappropriate application of fertilizer has become a common phenomenon in wheat production systems in China and has led to nutrient imbalances, inefficient use and large losses to the environment. However, defining an appropriate fertilization rate remains the foundation to science-based nutrient management. This paper described a new fertilizer recommendation method for wheat in China based on yield response and agronomic efficiency using datasets from 2000 to 2011. The results showed that the mean yield responses of wheat to N. P and K were 1.7, 1.0 and 0.8 t/ha, respectively. Nitrogen was the nutrient most limiting yield, followed by P and then K. The soil indigenous nutrient supplies were 122.6 kg N/ha, 38.0 kg P/ha, and 120.2 kg K/ha. The mean agronomic efficiencies were 9.4, 10.2 and 6.5 kg/kg for N, P and K, respectively. There was a significant negative exponential relationship between yield response and indigenous nutrient supply, and a significant negative linear correlation between yield response and relative yield. It was also demonstrated a quadratic equation between yield response (x) and agronomic efficiency (y) (P < 0.05). The relationship between yield response (x) and agronomic efficiency (y) for N was y(N) = 0.3729x(N)(2) + 6.1333x(N) + 0.1438 (R-2 = 0.76, n = 601), for P was y(p) = 0.5013x(p)(2) + 8.3209x(p) + 2.3907 (R-2 = 0.65, n = 288), and for K was y(K) = 1.6581x(K)(2) + 9.099x(K) +0.7668 (R-2 = 0.58, n = 379). These equations were all incorporated as part of the Nutrient Expert for Wheat fertilizer recommendation decision support system. The results of multiple field experiments helped to validate the feasibility of the recommendation model and concluded that Nutrient Expert for Wheat could be used as an alternative method to make fertilizer recommendations in China. (C) 2012 Elsevier B.V.
[本文引用: 1]
[本文引用: 1]
URLPMID:25985656 [本文引用: 1]
In this study, the input and output parameters of N for wheat production were collected from published literatures and International Plant Nutrition Institute in the period of 2000 to 2011 to evaluate N cycling and balances in North China, the middle and lower reaches of Yangtze River and Northwest China. The results showed that the N fertilizer application rates for each region were 170, 183 and 150 kg N . hm-2, the amounts of N from the previous crop were 74.6, 15.2 and 8.1 kg N . hm-2, and from seeds were 4.9, 4.2 and 3.5 kg N . hm-2, respectively. The N inputs from symbiotic fixation, atmospheric deposition and irrigation water in North China were 15, 12.9 and 9.9 kg N . hm-2, and in the middle and lower reaches of Yangtze River were 15, 14.5 and 5.8 kg N . hm-2, and in Northwest China were 15, 9.4 and 7.7 kg N . hm-2, respectively. The amounts of N uptake by aboveground plant at harvest time in North China, the middle and lower reaches of Yangtze River and Northwest China were 174.3, 144.4 and 122.3 kg N . hm-2, respectively, and the rates of ammonia volatilization, N20 emission and N leaching in North China were 19.9, 2.6 and 11.8 kg N . hm-2, in the middle and lower reaches of Yangtze River were 9.4, 2.4 and 15.5 kg N . hm-2, and in Northwest China were 3.4, 0.7 and 0 kg N . hm-2, respectively. As a result, the N balances in these three regions were all showing surpluses by 78.7, 66.0 and 67.3 kg N . hm-2. It is therefore necessary to adjust the N fertilizer application rates in these three regions to avoid the negative impacts on the environment.
[本文引用: 1]
[本文引用: 1]
URL [本文引用: 1]
The perspective of the world food production, especially problems of food production facing China has gradually become the focus of widespread concerns. Food production is dependent on cropping land area and the yield per unit land. However, it is unpractical for China to increase cropping land area because of the decreased arable land and increased population. Therefore, the major way of resolving the problems of food production facing China is to increase the yield per unit land. Fertilizer application is one of the effective ways to increase the yield per unit land, but there is no synchrony between fertilizer application and food production. Fertilizer consumption increased from 2 600×104 tons in 1990 to 4 700×104 tons in 2005, while the yields per unit land increased from 4 tons per hectare in 1990 to 4.6 tons per hectare. The effect of fertilizer application on yield growth decreased gradually. The rate of fertilizer application increased from 64.9 kg/hm2 in 1980 to 274 kg/hm2 in 2005, while partial factor productivity (PFP) decreased from 42.1 kg/kg in 1980 to 16.9 kg/kg in 2005. Reasons for this phenomenon can be explained in following three aspects: 1) Unbalanced application of fertilizers in terms of N, P and K by different farmers and in different regions; 2) Over application of fertilizers in rice, wheat and maize production. Mean application rate of fertilizer N is 205 kg/hm2, and 84 kg/hm2 for P, which are greatly higher than the rational rates; 3) Contributions from other soil nutrients, organic fertilizers were ignored.In this paper, the strategies for integrated soil nutrients management were put forward, which are improvement of traditional fertilizing techniques, and seeking high yield base on the diversity of soil, fertilizer and environmental inputs, practicing integrated soil nutrients management in small scaled household, and solving contradictions of nutrients input, crop production and environmental risk. In addition, the governments, enterprises, research institutions and farmers should cooperate to strengthen macro-management of nutrients resources, and put great emphasis on research and nutrient management techniques and agricultural services.
DOI:10.1371/journal.pone.0162802URLPMID:27631468 [本文引用: 2]
In order to make clear the recent status and trend of wheat (Triticum aestivum L.) production in China, datasets from multiple field experiments and published literature were collected to study the agronomic characteristics related to grain yield, fertilizer application and nutrient use efficiency from the year 2000 to 2011. The results showed that the mean grain yield of wheat in 2000-2011 was 5950 kg/ha, while the N, P2O5 and K2O application rates were 172, 102 and 91 kg/ha on average, respectively. The decrease in N and P2O5 and increase in K2O balanced the nutrient supply and was the main reason for yield increase. The partial factor productivity (PFP, kg grain yield produced per unit of N, P2O5 or K2O applied) values of N (PFP-N), P (PFP-P) and K (PFP-K) were in the ranges of 29.5~39.6, 43.4~74.9 and 44.1~76.5 kg/kg, respectively. While PFP-N showed no significant changes from 2000 to 2010, both PFP-P and PFP-K showed an increased trend over this period. The mean agronomic efficiency (AE, kg grain yield increased per unit of N, P2O5 or K2O applied) values of N (AEN), P (AEP) and K (AEK) were 9.4, 10.2 and 6.5 kg/kg, respectively. The AE values demonstrated marked inter-annual fluctuations, with the amplitude of fluctuation for AEN greater than those for AEP and AEK. The mean fertilizer recovery efficiency (RE, the fraction of nutrient uptake in aboveground plant dry matter to the nutrient of fertilizer application) values of N, P and K in the aboveground biomass were 33.1%, 24.3% and 28.4%, respectively. It was also revealed that different wheat ecological regions differ greatly in wheat productivity, fertilizer application and nutrient use efficiency. In summary, it was suggested that best nutrient management practices, i.e. fertilizer recommendation applied based on soil testing or yield response, with strategies to match the nutrient input with realistic yield and demand, or provided with the 4R's nutrient management (right time, right rate, right site and right fertilizer) should be adopted widely to improve the yield production and nutrient use efficiency.
[本文引用: 1]
[本文引用: 1]
[本文引用: 1]
[本文引用: 1]
[本文引用: 1]
DOI:10.3724/SP.J.1006.2017.01077URL [本文引用: 1]
DOI:10.3724/SP.J.1006.2017.01077URL [本文引用: 1]
[本文引用: 1]
[本文引用: 1]
DOI:10.3864/j.issn.0578-1752.2018.20.008URL [本文引用: 1]
【Objective】The objective of this study was to explore the suitable controlled-release nitrogen fertilizer varieties and their application methods in the wheat production process, so as to provide a theoretical basis for the popularization and application of the one-off mechanized application technology of wheat controlled-release fertilizer. 【Method】Three dominant wheat producing areas with different soil types, fertility levels and climatic conditions in Shandong province were selected to study effects of different application methods of controlled-release nitrogen fertilizer for wheat (surface broadcasting and rotary tillage (CRF1), banding below seeds (CRF2), and banding below and away from seeds (CRF3)) on wheat yield, nutrient absorption, soil nitrate nitrogen content and nitrogen use efficiency under the same optimal fertilization conditions by the method of field plot experiment. At the same time, the application methods were compared with the conventional urea fertilization (half urea was used as the base fertilizer, and half of urea was used at jointing of wheat (CK1), and all of urea was used as the base fertilizer by surface broadcasting and rotary tillage (CK2)) and no nitrogen fertilizer (CK0). 【Result】The yield of wheat grown in Taian brown soil ranged from 7 021 to 7 683 kg·hm-2, and the yields of CRF1 and CRF2 increased by 6.1% and 3.5% respectively compared with CK1, but the difference did not reach a significant level. The yield of CRF3 and CK1 was not significantly different, and the yield of CRF1 and CRF2 wheat was significantly higher than that of CK2, which increased by 9.4% and 6.7%, respectively. The yield of wheat grown in Chiping tidal soil ranged from 4 576 to 5 193 kg·hm-2, and the yield of CRF1 and CK1 wheat was not significantly different, but significantly higher than that of CK2, with an increase of 11.3%. The yield of wheat treated with nitrogen fertilizer in the Huantai cinnamon soil ranged from 5 222 to 5 830 kg·hm-2. The yield of CRF1, CRF2 and CRF3 had no significant difference with CK1, while the yield of CRF1 was significantly higher than that of CK2, with an increase of 10.8%. The wheat yield and partial factor productivity of nitrogen fertilizer of CRF1 were higher in all three sites, but there was no significant difference between CRF2 and CRF3. In Taian brown soil, the distribution rates of grain nitrogen of CRF1 and CRF3 were significantly higher than those of CK1 and CK2. The nitrogen use efficiency of CRF1, CRF2 and CRF3 in Huantai cinnamon soil was 46.7%, 49.5% and 50.2%, respectively. There was no significant difference among the three treatments, and no significant difference with CK1 and CK2. The three kinds of fertilization methods of controlled-release nitrogen fertilizer had no significant effect on the distribution of dry matter in wheat grain and straw, the nitrogen content and accumulation of grain and the surplus of nitrogen. In Chiping and Huantai, the content of nitrate nitrogen of CRF2 and CRF3 in 0-90 cm soil layer was higher. The content of nitrate nitrogen under CK1 and CK2 in Taian was higher, while that under CRF1 was the lowest. 【Conclusion】In the case of optimized dosage, the surface broadcasting and rotary tillage method for self-made wheat-specific controlled-release nitrogen fertilizer was conducive to stable or higher yield and production costs savings.
[本文引用: 1]
[本文引用: 1]
DOI:10.13287/j.1001-9332.201706.008URLPMID:29745151 [本文引用: 1]
A nitrogen management experiment with three nitrogen levels (0, 120, and 180 kg.hm(-2), namely N0, N120, N180) and three nitrogen allocation modes (NA: base fertilizer 100%; NB: base fertilizer 70% + seedling fertilizer 30%; NC: base fertilizer 60% + jointing fertilizer 40%) was conducted at four sites (Chongqing, Renshou, Guanghan and Xichang) during two consecutive years, the SPAD value, canopy photosynthetic rate (CAP), photosynthetically active radia-tion (PAR) interception efficiency and grain yield were determined, and the nitrogen use efficiency and PAR use efficiency were calculated. The results showed that the SPAD of upper-most three leaves, CAP, PAR interception efficiency and grain yield were promoted with increasing nitrogen fertilizer, but nitrogen fertilizer use efficiency, productivity efficiency, uptake efficiency and use efficiency were decreased. The promoting effects of nitrogen fertilizer postponing were different among nitrogen levels, with the highest SPAD in N180 treatment and the highest CAP in N120 treatment. The light use efficiency of different nitrogen fertilization patterns differed among four sites. Furthermore, nitrogenous fertilizer postponing significantly increased nitrogen agricultural fertilizer use efficiency, productivity efficiency, uptake efficiency and apparent nitrogen recovery efficiency, but declined nitrogen use efficiency, and the performance of NC was better than NB. Among different sites, Guanghan had the highest SPAD, CAP, PAR interception efficiency and grain yield, Xichang had higher SPAD and nitrogen use efficiency, lower CAP and PAR use efficiency, Chongqing and Renshou had the lowest SPAD, light use efficiency, nitrogen use efficiency and grain yield. Biomass had significant positive relationships with grain yield, CPA, SPAD, and PAR interception efficiency. Therefore, the increase of nitrogen fertilizer could promote yield at all sites, and nitrogenous fertilizer postponing could further optimize grain yield component and improve nitrogen and light use effi-ciency. But the effects depended on the years and sites, thus a target nitrogen management mode should be site-specifically made.
