 ,1, 杨俐苹,2, 卢艳丽2, 师校欣1, 杜国强,1
Status of Soil Fertility in Main Grape Producing Areas of China
LI BaoXin,1, YANG LiPing,2, LU YanLi2, SHI XiaoXin1, DU GuoQiang,1通讯作者:
责任编辑: 李云霞
收稿日期:2019-10-30接受日期:2020-01-2网络出版日期:2020-09-01
| 基金资助: |
Received:2019-10-30Accepted:2020-01-2Online:2020-09-01
作者简介 About authors
李宝鑫,E-mail:

摘要
关键词:
Abstract
Keywords:
PDF (7627KB)元数据多维度评价相关文章导出EndNote|Ris|Bibtex收藏本文
本文引用格式
李宝鑫, 杨俐苹, 卢艳丽, 师校欣, 杜国强. 我国葡萄主产区的土壤养分丰缺状况[J]. 中国农业科学, 2020, 53(17): 3553-3566 doi:10.3864/j.issn.0578-1752.2020.17.012
LI BaoXin, YANG LiPing, LU YanLi, SHI XiaoXin, DU GuoQiang.
0 引言
【研究意义】葡萄(Vitis vinifera L.)是世界上重要的经济作物,也是我国的重要水果之一。自2011年至今我国葡萄产量一直稳居世界首位,2014年至今葡萄栽培面积位于世界第二位,葡萄产业在我国现代农业生产中具有很大的经济效益[1,2]。近些年,随着农业生产方式的变革,使得我国部分土壤有机质含量出现了明显变化,且不同区域的土壤养分状况也随之改变[3,4,5]。土壤养分研究滞后并缺乏科学的施肥指导,逐渐成为制约葡萄产业可持续发展的焦点问题。因此,为保证葡萄健康生长,必须了解当前土壤肥力状况[6],并以此为依据优化葡萄管理方式,进而实现葡萄产业的可持续发展。【前人研究进展】我国国土面积辽阔,不同地区土壤养分状况存在一定差异[7]。尹兴[8]分析了河北省葡萄主产区土壤状况,结果表明土壤中有机质、锰、锌含量缺乏,应合理施用氮肥,减少铜制剂农药的应用。杨珍[9]、侍朋宝等[10]分析了陕西省葡萄主要产区的土壤状况,结果表明土壤养分的地域和深度分布不均衡问题较为突出,养分含量偏低。于费[11]在山西曲沃县的调查结果表明多数土壤养分含量适中,碱解氮含量较为缺乏。王则玉[12]、刘春燕等[13]对新疆吐鲁番地区葡萄园的研究结果发现葡萄产量、生长状况与土壤肥力存在一定关系。王玉倩[14]对贵州葡萄园土壤的调查结果表明土壤有机质含量偏低,速效养分含量较高。段永华[15]、张小卓等[16]对云南葡萄主产区土壤研究发现葡萄耕作土壤养分含量丰富,但差异较大,不同营养元素间拮抗现象严重。【本研究切入点】土壤是葡萄生长发育的基础,其养分丰缺状况很大程度上决定了植株寿命、果实品质以及葡萄酒的质量与风味。前人对葡萄土壤养分的研究仅局限于各省市范围内,对我国葡萄主产区整体性的土壤养分状况缺乏较为系统性的研究。【拟解决的关键问题】本研究旨在明确我国葡萄主产区土壤养分丰缺状况并提出合理施肥建议,为我国葡萄主产区土壤养分平衡管理和科学施肥提供依据。1 材料与方法
1.1 研究区概况
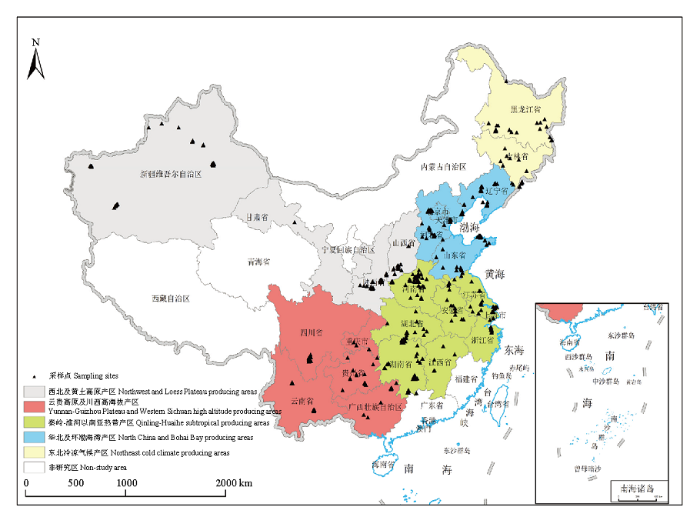
我国幅员辽阔,土壤类型复杂多样,根据葡萄种植区域的地理、气候、栽植方式等特点,将其划分为五大主产区,分别为东北冷凉气候产区、华北及环渤海湾产区、秦岭-淮河以南亚热带产区、西北及黄土高原产区、云贵高原及川西高海拔产区[17]。本文基于我国五大葡萄主产区的23个省级行政区域开展研究。1.2 土壤样品采集
2018年8—12月,采集了我国葡萄五大主产区的23个省级行政区域1 100份土壤样品(东北冷凉气候产区83份,华北及环渤海湾产区235份,秦岭-淮河以南亚热带产区376份,西北及黄土高原产区275份,云贵高原及川西高海拔产区131份)(图1)。在每个省份的主栽县区选择20个具有代表性的区域,每个采样区域约为6.6 hm2,并且该区域内葡萄树龄、品种、种植方式、地形地貌等大致相似,在每一个采样区域按照随机、等量和多点混合的原则采集1个混合样品,土壤取样深度为0—30 cm,并记录采样点经纬度。土壤样品采用四分法保留500 g,风干研磨过2 mm细筛,用于土壤养分的测定。图1
 新窗口打开|下载原图ZIP|生成PPT
图1土壤采样点分布图
审图号:GS(2020)2588号
Fig. 1Distribution of soil sampling sites
1.3 养分测定方法
土壤样品分析测定在中国农业科学院农业资源与农业区划研究所国家测土施肥中心实验室采用土壤养分状况系统研究法[18,19,20]完成。有机质用浸提剂(0.2 mol·L-1 NaOH+0.01 mol·L-1 EDTA+2%甲醇)浸提,比色法(420 nm)测定;速效氮(NO3--N和NH4+-N)、有效钙和有效镁用 KCl 浸提,钙和镁用原子吸收法测定,NO3--N 用紫外分光光度法测定,NH4+-N用靛酚蓝比色法测定;有效态P、K、Fe、Mn、Cu和Zn用联合浸提剂(0.25 mol·L-1 NaHCO3+0.01 mol·L-1 EDTA+0.01mol·L-1 NH4F)浸提,P用钼锑抗比色法测定,其他元素用原子发射和吸收法测定;有效态S和有效态B用 CaH4(PO4)2浸提,S用比浊法测定,B用姜黄素比色法测定;pH 计测定 pH,水土比为2.5﹕1[18]。参考国内外相关文献资料[18,19,20,21,22],根据葡萄生长需肥规律将土壤的大、中、微量元素含量由低到高划分为极缺、缺乏、中等、丰富、很丰富、极丰富6个等级(表1)。Table 1
表1
表1葡萄土壤养分分级标准
Table 1
| 养分 Nutrient | 极缺 Serious deficient | 缺乏 Deficient | 中等 Medium | 丰富 Rich | 很丰富 Very rich | 极丰富 Extremely rich |
|---|---|---|---|---|---|---|
| 有机质Organic matter (g·kg-1) | 0-10.00 | 10.00-15.00 | 15.00-20.00 | 20.00-25.00 | 25.00-30.00 | >30.00 |
| 速效氮Available N (mg·kg-1) | 0-20.0 | 20.0-50.0 | 50.0-100.0 | 100.0-150.0 | 150.0-200.0 | >200.0 |
| 有效磷Available P (mg·kg-1) | 0-15.0 | 15.0-25.0 | 25.0-45.0 | 45.0-70.0 | 70.0-150.0 | >150.0 |
| 有效钾Available K (mg·kg-1) | 0-60.0 | 60.0-120.0 | 120.0-240.0 | 240.0-400.0 | 400.0-600.0 | >600.0 |
| 有效钙Available Ca (mg·kg-1) | 0-200.0 | 200.0-400.0 | 400.0-1200.0 | 1200.0-3600.0 | 3600.0-4800.0 | >4800.0 |
| 有效镁Available Mg (mg·kg-1) | 0-60.0 | 60.0-120.0 | 120.0-250.0 | 250.0-750.0 | 750.0-1460.0 | >1460.0 |
| 有效硫Available S (mg·kg-1) | 0-7.0 | 7.0-13.0 | 13.0-25.0 | 25.0-40.0 | 40.0-60.0 | >60.0 |
| 有效铁Available Fe (mg·kg-1) | 0-5.0 | 5.0-10.0 | 10.0-30.0 | 30.0-150.0 | 150.0-300.0 | >300.0 |
| 有效铜Available Cu (mg·kg-1) | 0-1.0 | 1.0-2.0 | 2.0-3.0 | 3.0-4.0 | 4.0-5.0 | >5.0 |
| 有效锰Available Mn (mg·kg-1) | 0-2.5 | 2.5-5.0 | 5.0-15.0 | 15.0-30.0 | 30.0-150.0 | >150.0 |
| 有效锌Available Zn (mg·kg-1) | 0-1.0 | 1.0-2.0 | 2.0-3.0 | 3.0-6.0 | 6.0-10.0 | >10.0 |
| 有效硼Available B (mg·kg-1) | 0-0.10 | 0.10-0.20 | 0.20-0.60 | 0.60-3.00 | 3.00-6.00 | >6.00 |
新窗口打开|下载CSV
1.4 数据分析
采用Excel 2010软件进行数据处理,运用ArcGIS 10.2软件中的反距离权重插值法(Inverse Distance Weighted,IDW)对土壤养分进行插值,再按照分级标准绘制成土壤养分空间分布图。本研究中各主产区土壤养分含量均值是调查样本养分值与该主产区葡萄种植面积的加权平均值,全国土壤养分含量则是各主产区的土壤养分值与葡萄种植面积的加权平均值[23]。2 结果
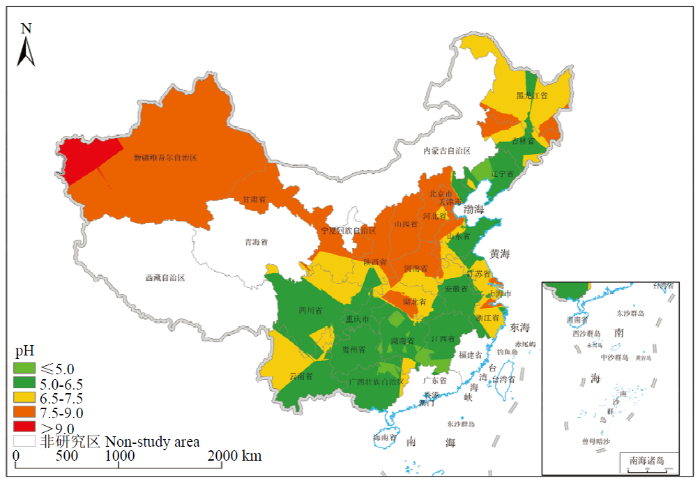
2.1 葡萄主产区土壤pH状况
根据表2可知,在我国葡萄五大主产区因产地分布位置不同pH状况各有差异。图2显示适宜葡萄生长的中性(6.5—7.5)土壤较少,占比仅为11.7%。东北冷凉气候产区、华北及环渤海湾产区、秦岭-淮河以南亚热带产区、云贵高原及川西高海拔产区均存在pH<5.5的酸性土壤区域,在各主产区中占比分别为16.9%、21.3%、22.6%、36.6%;土壤pH>8.5的碱性土壤主要存在于东北冷凉气候产区、华北及环渤海湾产区、西北及黄土高原产区,在各主产区中占比分别为22.9%、23.8%、37.5%。Table 2
表2
表2我国葡萄主产区土壤养分含量
Table 2
| 产区 The production areas | pH | 有机质 OM (g·kg-1) | 速效氮 Available N (mg·kg-1) | 有效磷 Available P (mg·kg-1) | 有效钾 Available K (mg·kg-1) | 有效钙 Available Ca (mg·kg-1) | 有效镁 Available Mg (mg·kg-1) | |||||||
|---|---|---|---|---|---|---|---|---|---|---|---|---|---|---|
| 东北冷凉气候产区 Northeast cold climate producing areas | 平均值 Mean | 6.6±0.16 | 20.18±1.61 | 83.6±20.41 | 49.1±20.41 | 171.5±32.20 | 2019.3±104.49 | 282.3±28.22 | ||||||
| 最大值 Max | 9.2 | 71.13 | 914.5 | 210.9 | 1659.1 | 4399.9 | 1440.7 | |||||||
| 最小值 Min | 4.0 | 3.12 | 1.4 | 3.0 | 40.2 | 89.2 | 2.1 | |||||||
| 标准差 SD | 1.42 | 15.04 | 185.91 | 48.91 | 293.35 | 951.95 | 257.13 | |||||||
| 华北及环渤海湾产区 North China and Bohai Bay producing areas | 平均值 Mean | 6.9±0.10 | 9.09±0.32 | 70.5±4.93 | 151.5±4.93 | 244.4±13.74 | 1671.3±54.70 | 310.8±15.76 | ||||||
| 最大值 Max | 9.2 | 28.29 | 625.9 | 730.7 | 1665.2 | 7663.5 | 1188.4 | |||||||
| 最小值 Min | 3.5 | 2.04 | 1.2 | 6.7 | 30.6 | 159.2 | 3.6 | |||||||
| 标准差 SD | 1.59 | 4.36 | 75.56 | 135.29 | 210.61 | 838.59 | 241.59 | |||||||
| 秦岭-淮河以南亚热带产区 Qinling-Huaihe subtropical producing areas | 平均值 Mean | 6.9±0.01 | 9.71±0.19 | 109.1±7.20 | 107.5±7.20 | 213.1±10.03 | 1963.7±45.60 | 271.7±8.89 | ||||||
| 最大值 Max | 9.2 | 37.22 | 997.0 | 1962.8 | 1692.7 | 6747.3 | 1261.2 | |||||||
| 最小值 Min | 2.9 | 1.63 | 5.1 | 2.3 | 24.4 | 194.4 | 8.2 | |||||||
| 标准差 SD | 1.46 | 4.07 | 139.55 | 206.60 | 194.48 | 884.27 | 172.31 | |||||||
| 西北及黄土高原产区 Northwest and Loess Plateau producing areas | 平均值 Mean | 8.4±0.09 | 7.39±0.32 | 44.1±4.16 | 71.6±4.16 | 218.4±8.98 | 1512.5±69.13 | 266.1±8.72 | ||||||
| 最大值 Max | 9.6 | 23.84 | 561.3 | 526.0 | 1944.4 | 15818.3 | 904.1 | |||||||
| 最小值 Min | 4.9 | 1.03 | 0.0 | 0.7 | 48.7 | 264.4 | 57.6 | |||||||
| 标准差 SD | 0.78 | 5.01 | 69.04 | 57.29 | 148.98 | 1146.38 | 144.55 | |||||||
| 云贵高原及川西高海拔产区 Yunnan-Guizhou Plateau and Western Sichuan high altitude producing areas | 平均值 Mean | 5.9±0.04 | 21.81±0.64 | 103.4±11.04 | 70.3±11.04 | 181.4±9.89 | 1537.8±76.87 | 221.0±13.08 | ||||||
| 最大值 Max | 8.3 | 44.86 | 799.5 | 533.9 | 752.3 | 6102.8 | 713.0 | |||||||
| 最小值 Min | 3.7 | 6.88 | 6.4 | 2.0 | 32.3 | 213.6 | 26.3 | |||||||
| 标准差 SD | 1.1 | 6.32 | 126.32 | 72.89 | 113.17 | 879.86 | 149.73 | |||||||
| 总计 Total | 平均值 Mean | 7.2±0.04 | 11.42±0.26 | 77.8±3.59 | 97.2±3.59 | 214.7±5.80 | 1670.8±29.34 | 299.0±5.87 | ||||||
| 最大值 Max | 9.6 | 71.13 | 997.0 | 1962.8 | 1944.4 | 15818.3 | 1440.7 | |||||||
| 最小值 Min | 2.9 | 1.03 | 0.0 | 0.7 | 24.4 | 89.2 | 2.1 | |||||||
| 标准差 SD | 1.50 | 7.61 | 119.0 | 147.14 | 192.31 | 973.0 | 194.66 | |||||||
| 东北冷凉气候产区 Northeast cold climate producing areas | 平均值 Mean | 38.1±9.78 | 64.2±5.71 | 8.7±0.74 | 22.2±2.40 | 5.9±1.94 | 2.17±0.51 | |||||||
| 最大值 Max | 598.6 | 276.8 | 36.2 | 162.1 | 152.8 | 25.55 | ||||||||
| 最小值 Min | 0.0 | 1.9 | 0.1 | 1.7 | 1.1 | 0.09 | ||||||||
| 标准差 SD | 89.13 | 52.01 | 6.75 | 21.88 | 17.65 | 4.66 | ||||||||
| 华北及环渤海湾产区 North China and Bohai Bay producing areas | 平均值 Mean | 46.3±2.66 | 77.7±5.02 | 11.2±0.58 | 19.0±1.15 | 9.9±1.15 | 2.25±0.12 | |||||||
| 最大值 Max | 210.6 | 374.1 | 48.5 | 134.2 | 191.9 | 14.17 | ||||||||
| 最小值 Min | 1.2 | 1.6 | 0.3 | 1.9 | 0.4 | 0.18 | ||||||||
| 标准差 SD | 40.74 | 76.90 | 8.85 | 17.65 | 17.58 | 1.82 | ||||||||
| 秦岭-淮河以南亚热带产区 Qinling-Huaihe subtropical producing areas | 平均值 Mean | 67.2±3.22 | 103.6±5.33 | 6.3±0.27 | 19.8±0.96 | 8.8±0.54 | 3.70±0.25 | |||||||
| 最大值 Max | 501.5 | 633.6 | 48.7 | 185.7 | 77.6 | 49.10 | ||||||||
| 最小值 Min | 0.0 | 4.3 | 0.2 | 0.8 | 0.0 | 0.00 | ||||||||
| 标准差 SD | 62.44 | 103.42 | 5.28 | 18.63 | 10.38 | 4.89 | ||||||||
| 西北及黄土高原产区 Northwest and Loess Plateau producing areas | 平均值 Mean | 87.9±6.10 | 21.1±1.59 | 1.7±0.11 | 10.9±0.42 | 1.9±0.12 | 2.62±0.23 | |||||||
| 最大值 Max | 918.9 | 185.3 | 12.7 | 82.9 | 15.3 | 36.65 | ||||||||
| 最小值 Min | 0.0 | 2.2 | 0.1 | 0.1 | 0.2 | 0.00 | ||||||||
| 标准差 SD | 101.12 | 26.38 | 1.81 | 7.00 | 2.03 | 3.77 | ||||||||
| 云贵高原及川西高海拔产区 Yunnan-Guizhou Plateau and Western Sichuan high altitude production areas | 平均值 Mean | 87.4±11.59 | 173.3±9.58 | 5.2±0.27 | 16.2±1.43 | 7.4±1.43 | 3.04±1.43 | |||||||
| 最大值 Max | 1334.0 | 460.6 | 19.1 | 95.6 | 95.6 | 95.56 | ||||||||
| 最小值 Min | 9.8 | 24.4 | 0.3 | 2.6 | 2.6 | 1.76 | ||||||||
| 标准差 SD | 132.62 | 109.65 | 3.14 | 16.31 | 16.34 | 16.36 | ||||||||
| 总计 Total | 平均值 Mean | 72.5±2.53 | 83.9±2.82 | 5.8±0.20 | 16.1±0.51 | 6.5±0.40 | 2.86±0.25 | |||||||
| 最大值 Max | 1334.0 | 633.6 | 48.7 | 185.7 | 191.9 | 95.56 | ||||||||
| 最小值 Min | 0.0 | 1.6 | 0.1 | 0.1 | 0.0 | 0.00 | ||||||||
| 标准差 SD | 83.78 | 93.46 | 6.50 | 16.75 | 13.35 | 8.23 | ||||||||
新窗口打开|下载CSV
图2
 新窗口打开|下载原图ZIP|生成PPT
图2土壤pH空间分布
审图号:GS(2020)2588号
Fig. 2Spatial distribution of pH
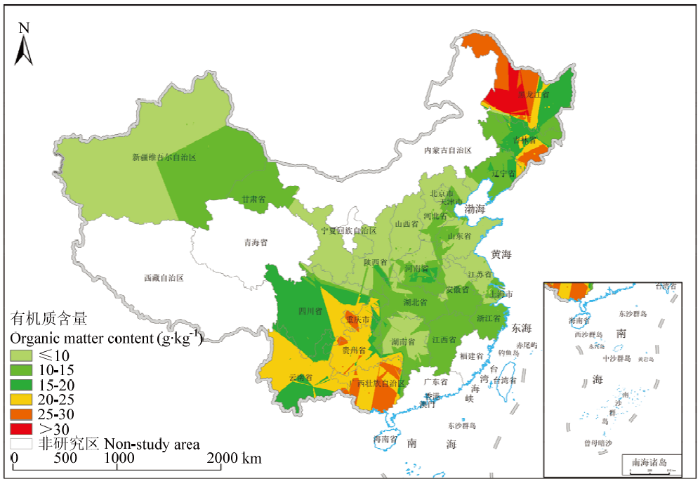
2.2 葡萄主产区土壤有机质含量及其分布
我国葡萄主产区的土壤有机质平均含量为11.42 g·kg-1,处于缺乏(10.0—15.0 g·kg-1)水平,有机质含量在15.0 g·kg-1以下的土壤占比为78.8%。东北冷凉气候产区和云贵高原及川西高海拔产区的有机质含量分别为20.18 g·kg-1和21.81 g·kg-1,土壤有机质含量处于丰富(20.00—25.00 g·kg-1)水平;华北及环渤海湾产区、秦岭-淮河以南亚热带产区、西北及黄土高原产区的土壤有机质含量均值分别为9.09、9.71和7.39 g·kg-1,均处于很缺乏(0—10.00 g·kg-1)水平(图3,表2)。图3
 新窗口打开|下载原图ZIP|生成PPT
图3土壤有机质空间分布
审图号:GS(2020)2588号
Fig. 3Spatial distribution of soil organic matter
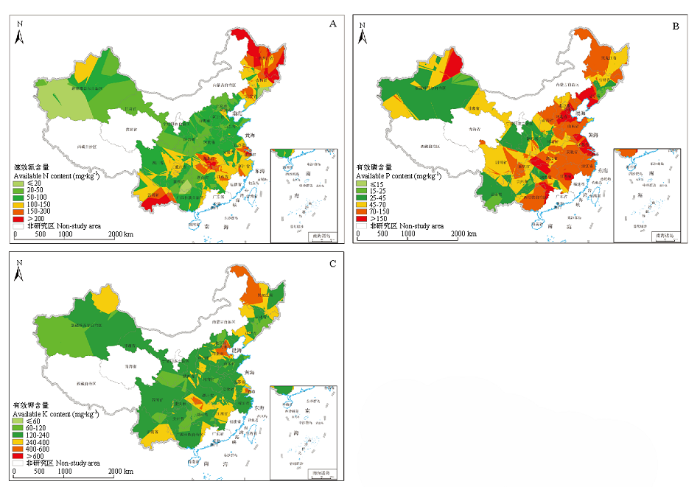
2.3 葡萄主产区土壤大量元素含量及其分布
由表1和表2可知,我国葡萄主产区的土壤速效氮含量为77.8 mg·kg-1,处于中等(50.0—100.0 mg·kg-1)水平,而缺乏水平以下(<50.0 mg·kg-1)的土壤占比达55.6%。秦岭-淮河以南亚热带产区、云贵高原及川西高海拔产区的速效氮含量处于丰富(100.0—150.0 mg·kg-1)水平;东北冷凉气候产区、华北及环渤海湾产区的速效氮含量处于中等水平;而西北及黄土高原产区的土壤速效氮含量仅为44.1 mg·kg-1,处于缺乏(20.0—50.0 mg·kg-1)水平(图4-A)。图4
 新窗口打开|下载原图ZIP|生成PPT
图4土壤大量元素空间分布
审图号:GS(2020)2588号
Fig. 4Spatial distribution of soil macro elements
我国葡萄主产区的土壤有效磷含量为97.2 mg·kg-1,处于很丰富(70.0—150.0 mg·kg-1)水平,有效磷含量在很丰富及其水平以上的土壤占比为41.6%。其中华北及环渤海湾产区的土壤有效磷平均含量处于极丰富(>150.0 mg·kg-1)水平,该产区土壤有效磷含量在极丰富及其水平以上的土壤占比高达35.2%;东北冷凉气候产区的土壤有效磷含量在五大主产区中含量最低,但仍处于丰富(45.0—70.0 mg·kg-1)水平(图4-B)。
我国葡萄主产区的土壤有效钾含量为214.7 mg·kg-1,处于中等(120.0—240.0 mg·kg-1)水平,土壤有效钾含量在中等及其以下水平的土壤占比为72.1%。除华北及环渤海湾产区的有效钾含量处于丰富(240.0—400.0 mg·kg-1)水平外,其他主产区有效钾含量均处于中等水平,其中以东北冷凉气候产区的土壤有效钾含量(171.5 mg·kg-1)最低。各主产区均存在有效钾分布不均衡现象(图4-C)。
2.4 葡萄主产区土壤中量元素含量及其分布
表1、表2显示,我国葡萄主产区的土壤有效钙含量为1 670.8 mg·kg-1,处于丰富(1 200.0—3 600.0 mg·kg-1)水平,全国有效钙含量处于丰富及其以上水平的土壤占比为73.2%,各主产区的土壤有效钙含量均处于丰富水平。但是由图5-A有效钙含量分布图可知,在辽宁、河北、山东、甘肃、新疆、湖南、江西、贵州、广西壮族自治区等省份仍存在有效钙含量不足的区域。图5
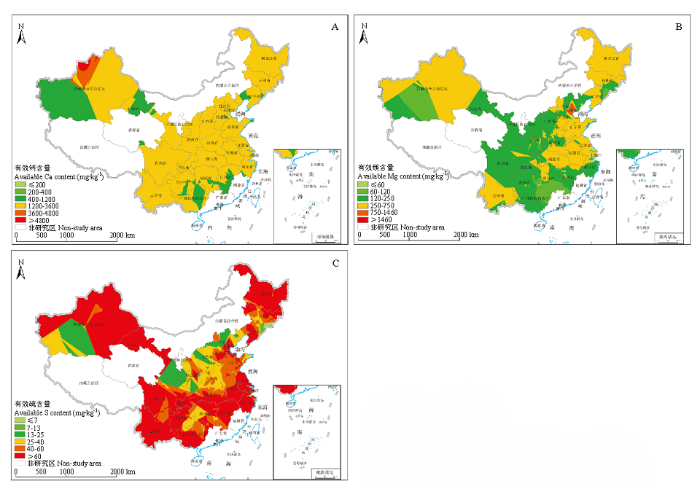 新窗口打开|下载原图ZIP|生成PPT
图5土壤中量元素空间分布
审图号:GS(2020)2588号
Fig. 5Spatial distribution of soil medium elements
我国葡萄主产区土壤中有效镁含量为299.0 mg·kg-1,处于丰富(250.0—750.0 mg·kg-1)水平,但变异系数较大。华北及环渤海湾产区的土壤有效镁含量处于丰富水平且高于全国平均水平;东北冷凉气候产区、秦岭-淮河以南亚热带产区、西北及黄土高原产区的土壤有效镁含量处于丰富水平且低于全国平均水平;云贵高原及川西高海拔产区的土壤有效镁含量最低,处于中等(120.0—250.0 mg·kg-1)水平。由图5-B有效镁含量分布图可知,在我国北方的吉林、河北、山东等省份以及南方和西北大部分产区均存在不同程度的缺镁区域。
在我国葡萄主产区土壤中有效硫含量为72.5 mg·kg-1,处于极丰富(>60.0 mg·kg-1)水平。其中秦岭-淮河以南亚热带产区、西北及黄土高原产区、云贵高原及川西高海拔产区的土壤有效硫含量均处于极丰富水平且高于全国平均水平;华北及环渤海湾产区的土壤有效硫含量处于很丰富(40.0—60.0 mg·kg-1)水平;东北冷凉气候产区的土壤有效硫含量最低,仍处于丰富(25.0—40.0 mg·kg-1)水平。由图5-C有效硫含量分布图可知,我国葡萄主产区的土壤有效硫含量整体偏高。
2.5 葡萄主产区土壤微量元素含量及其分布
由表1、表2可知,我国葡萄主产区土壤中有效铁含量为83.9 mg·kg-1,处于丰富(30.0—150.0 mg·kg-1)水平,但是南北方土壤中有效铁含量差异明显,云贵高原及川西高海拔产区土壤有效铁含量处于很丰富(150.0—300.0 mg·kg-1)水平,秦岭-淮河以南亚热带产区、东北冷凉气候产区、华北及环渤海湾产区的有效铁含量处于丰富水平,西北及黄土高原产区有效铁含量为中等(10.0—30.0 mg·kg-1)水平。由图6-A有效铁含量分布图可看出,土壤中有效铁的含量由南到北逐渐下降,南方的主产区土壤有效铁含量高于北方地区。我国葡萄主产区土壤中的有效铜含量为5.8 mg·kg-1,处于极丰富(>5.0 mg·kg-1)水平,全国有效铜含量处于极丰富水平的土壤占比可达38.5%。西北及黄土高原产区的土壤有效铜含量分别为1.7 mg·kg-1,处于缺乏(1.0—2.0 mg·kg-1)水平,其余四大主产区的有效铜含量均处于极丰富水平,华北及环渤海湾产区的土壤有效铜含量最高(11.2 mg·kg-1),该主产区土壤有效铜含量处于极丰富水平的土壤占比可达70.6%(图6-B)。
我国葡萄主产区土壤中的有效锰含量为16.1 mg·kg-1,处于丰富(15.0—30.0 mg·kg-1)水平。西北及黄土高原产区土壤有效锰含量(10.9 mg·kg-1)最低,处于中等(5.0—15.0 mg·kg-1)水平,其余四大主产区的有效锰含量均处于丰富水平。由图6-C有效锰含量分布图可知,自东向西土壤有效锰含量逐渐降低。
我国葡萄主产区土壤中的有效锌含量为6.5 mg·kg-1(表2),处于很丰富(6.0—10.0 mg·kg-1)水平(表1)。但是有效锌含量在五大产区土壤中变异系数较大,华北及环渤海湾产区、秦岭-淮河以南亚热带产区、云贵高原及川西高海拔产区的土壤有效锌含量处于很丰富水平;东北冷凉气候产区土壤有效锌含量处于丰富(3.0—6.0 mg·kg-1)水平;西北及黄土高原产区的土壤有效锌含量最低,处于缺乏(1.0—2.0 mg·kg-1)水平(图6-D)。
图6
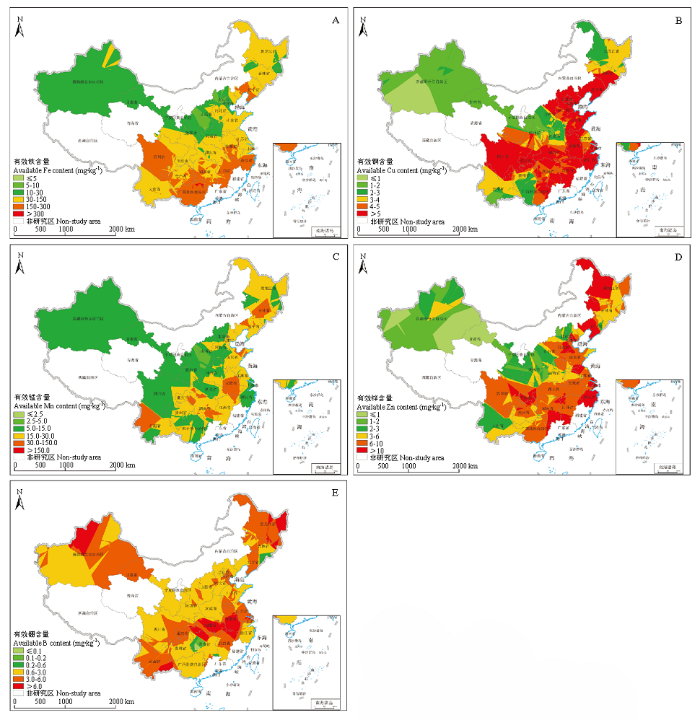 新窗口打开|下载原图ZIP|生成PPT
图6土壤微量元素空间分布
审图号:GS(2020)2588号
Fig. 6Spatial distribution of soil micro elements
我国葡萄主产区的土壤有效硼平均含量为2.86 mg·kg-1,整体处于丰富(0.60—3.00 mg·kg-1)水平。其中秦岭-淮河以南亚热带产区、云贵高原及川西高海拔产区的有效硼含量处于很丰富(3.00—6.00 mg·kg-1)水平;东北冷凉气候产区、华北及环渤海湾产区、西北及黄土高原产区的有效硼含量处于丰富水平(图6-E)。
3 讨论
3.1 我国葡萄主产区土壤养分丰缺状况的影响因子
土壤速效养分丰缺状况调查是对葡萄进行合理施肥与养分管理的主要依据,土壤的pH,有机质及大、中、微量元素的含量对葡萄树体生长状况及果实品质有很大影响[24]。由于我国葡萄种植区域广泛,各大主产区之间的土壤类型及养分含量差异较大。东北冷凉气候产区以暗棕壤、黑钙土为主,养分含量较丰富;华北及环渤海湾产区土壤以棕壤、褐土、滨海盐土为主,土壤类型复杂,有机质含量较低,养分含量差异明显;西北及黄土高原产区以风沙土、钙层土、漠土为主,土壤偏碱性且空隙较大,不利于养分积累;秦岭-淮河以南亚热带产区以黄棕壤、红壤为主,土壤酸度较高加上高温气候导致有机质含量较低且周转速率很快;云贵高原及川西高海拔产区以紫色土、黄壤为主,土壤肥力较高,但由于喀斯特地貌特征导致水土流失现象较为严重[25,26]。本研究结果表明,全国土壤的酸化存在加重的趋势,这可能与北方地区连续施用化肥和南方设施栽培模式有一定关系[27,28,29]。通过IDW插值的土壤养分分布结果显示,有机质和速效氮含量分布规律较为一致,全国土壤有机质和速效氮含量处于较低水平,这与我国传统的土壤清耕管理,不施或少施有机肥有关[30]。在全国范围内土壤有效磷含量处于很丰富水平,尤其以华北及环渤海湾产区含量最高,这可能与常年磷肥投入量较大有一定关系,这与尹兴等[31]对华北及环渤海湾产区的研究结果一致。我国葡萄主产区土壤有效钾含量处于中等水平,但各产区之间及内部区域均存在分布不均衡现象。整体而言,速效氮、有效钾在我国葡萄主产区的土壤中含量偏低,在各产区之间变异系数较大,这与全国的土壤类型多元化有很大关系,有效磷在主产区的分布含量偏高,与过量施用磷肥和复合肥带入有一定关系。
中、微量元素在葡萄生长发育过程中也具有不可替代的作用[32]。本次研究结果表明,我国葡萄主产区中有效硫的含量处于极丰富水平,马文娟[33]、李挺[34]等调查研究结果表明在西北及黄土高原产区、云贵高原及川西高海拔产区的有效硫含量与当地农户长期偏重施用化学肥料有关。有效钙、有效镁总体处于丰富水平,但各产区之间变异系数较大,仍存在钙、镁缺乏区域,这可能与土壤类型和施肥习惯有一定关系[35]。土壤中的微量元素有效铜处于极丰富水平,有效铁、有效锰、有效锌、有效硼总体含量丰富,但各主产区及内部区域之间存在分布不平衡现象。由于南北方土壤类型差异明显,有效铁在北方土壤中的含量普遍低于南方土壤;西北及黄土高原产区由于土壤保水保肥效果较差,微量元素含量普遍较低。
3.2 我国葡萄主产区施肥建议
优质高产葡萄园的土壤养分应保持在一个充足而不过量的水平(丰富水平),此时葡萄园推荐施肥量应等于一定目标产量下葡萄果实和植株养分带走量。若土壤养分测定值低于丰富水平,则推荐施肥量除了满足葡萄果实和植株生长所需求的养分外,还应增加一定施肥量以培肥土壤,使葡萄园土壤养分含量达到丰富水平。如果土壤养分测定值已在丰富水平以上,应降低施肥水平,以避免土壤养分过量造成的环境风险[36]。同时我国葡萄栽培以鲜食品种为主,约占栽培总面积的80%,酿酒葡萄约占15%,其他用途葡萄约占5%,鲜食、酿酒葡萄的产量水平在各地区差异很大[37],实际生产中各产区应结合本地区土壤环境水平、葡萄植株营养水平及目标产量来确定施肥方案。东北冷凉气候产区土壤有机质、速效养分含量丰富,速效氮、有效磷不同区域分布差异较大。由于化肥连年投入导致该主产区存在土壤酸化加重的现象,建议可施用适量石灰或施用碱性肥料代替酸性肥料,有利于缓解土壤酸化问题。针对部分地区存在有机质、速效氮、有效钾以及锰、锌、硼微量元素缺乏问题,生产中可在8月底至9月上旬(该地区葡萄根系第二次生长高峰期)施用有机肥[38],一般每产1 000 kg果实需施入腐熟有机肥2 000 kg,不仅可以提升土壤肥力,此时更利于树体的养分吸收;可在花前补充锌、硼微量元素,在果实膨大期至转色期增施钾肥和中、微量元素肥料,有助于改善果实品质[39]。
华北及环渤海湾产区是著名的葡萄产区之一,该地区土壤有机质缺乏,氮、磷、钾大量元素变异系数很大,土壤有效磷、有效铜含量过高,速效氮含量偏低,部分区域土壤有效镁、有效锌、有效锰、有效硼含量偏低。研究报道我国北方成龄丰产葡萄园建议施纯N 187.25—225 kg·hm-2、P2O5 150—187.5 kg·hm-2、K2O 150—225 kg·hm-2 [40],而该主产区氮、磷、钾养分投入量均超标50%以上,养分投入量过高,比例不协调,导致肥料利用率较低[31]。建议该地区增施有机肥以提升土壤肥力,结合土壤养分丰缺状况开展配方施肥,优化施肥方法与时期,减少磷肥的投入量;此外,影响微量元素含量的原因除与构成土壤的成土母质状况有很大关系外,还与人为因素有关[41],生产中要合理使用波尔多液,避免因铜元素过多而增加环境风险,在中、微量元素缺乏地区可在秋施基肥中补充钙、镁肥,翌年在葡萄生长关键期采用土施、叶面喷肥等方式补充中、微量元素;同时在天津、秦皇岛等滨海产区也应注意土壤盐碱化的发生。
秦岭-淮河以南亚热带产区土壤酸化严重,有机质、有效钾、有效镁含量偏低,土壤肥力亟待提升。该主产区常年避雨栽培,化肥施用较多,土壤淋雨较少,导致土壤酸化,严重影响根系对养分的吸收效率[42],建议通过施用石灰改良土壤酸性,或者在秋施基肥时,可混入钙镁磷肥也有助于改良土壤。该主产区多以设施栽培为主,土层较浅,土壤黏性较高,不利于土壤有效养分的释放,花前可采用土施加叶面喷施的方式进行追肥,待坐果后可适当增加土施肥料进行养分补充。同时滨海地区土壤盐碱化现象较为严重,可采用避雨栽培、完善排水系统等方式降低危害;新建园区应先进行土壤养分测定并进行土壤改良再定植葡萄,可为其生长营造良好的土壤环境。由于该地区土壤类型多样,土壤管理更加复杂[43],可根据不同土壤类型采取相应的土壤管理和改良措施。
西北及黄土高原产区土壤养分状况整体较差,有机质、氮、磷、钾大量元素含量偏低,这与前人对陕西[33]、山西[44]、新疆[45,46]等地区的葡萄土壤养分研究结果一致。生产中建议要提高有机肥用量及比例,补充缺乏的大、中、微量元素。根据主产区实际情况可应用水肥一体化管理措施,既可以节约用水,又提高肥料利用率。新疆、宁夏等地区的盐碱地所占比例较高,可施用有机肥或土壤调理剂改良土壤,生产中要合理施用复合肥,联合物理化学改良方法培肥土壤,防止次生盐碱化的发生。
云贵高原及川西高海拔产区土壤酸化严重,有机质含量较少、养分比例失衡等问题较为突出。该主产区土壤pH普遍偏低的原因除土壤自身因素外,还可能是连年生产中硫酸钾、过磷酸钙等酸性肥料施用量过高导致的[47],建议土壤pH低于5.5的地区可采取施用适量石灰或种植绿肥等方式改良土壤,同时增施有机肥、生物菌肥等提高有机质含量。由于该主产区喀斯特地貌的地理因素致使硼元素较为缺乏,建议土壤深耕施用有机肥时可添加硼肥,并结合花前叶面喷施硼肥等方式进行补充。前人研究也曾表明贵州葡萄园土壤速效氮、磷、钾含量偏高,钙、镁、铁、铜、锰、锌含量过高[14],云南省主要葡萄园土壤整体养分含量较高,各地区养分含量差异明显[16],因此该主产区可开展配方施肥科学合理补充养分。
4 结论
4.1 我国葡萄主产区土壤pH范围为2.85—9.75,中性土壤面积占比仅为11.7%,有机质含量为11.42 g·kg-1,有机质处于缺乏水平的土壤面积占比为78.8%,建议采用增施有机肥、行间生草、施用土壤调理剂等方式改良土壤。4.2 我国葡萄主产区土壤速效氮(77.8 mg·kg-1)、有效钾(214.7 mg·kg-1)含量偏低,有效磷(97.2 mg·kg-1)含量偏高,建议合理控施氮肥,减少磷肥施用量,缺钾地区增施钾肥,平衡施用复合肥。
4.3 我国葡萄主产区土壤的中量元素有效钙、镁、硫含量处于丰富水平,但不同地区之间钙、镁含量差异较大,建议在钙、镁缺乏区域合理补充钙肥和镁肥;微量元素有效铜(5.8 mg·kg-1)含量极为丰富,铁、锰、锌、硼含量均处于丰富水平,但不同地区差异较为明显,建议合理补充微量元素,并应注意评估有效铜过高导致的环境风险,避免因盲目施用中、微量肥料导致土壤中某些元素失衡而影响树体生长和果实品质。
参考文献 原文顺序
文献年度倒序
文中引用次数倒序
被引期刊影响因子
[本文引用: 2]
[本文引用: 1]
[本文引用: 1]
[本文引用: 2]
[本文引用: 2]
[本文引用: 1]
[本文引用: 1]
[本文引用: 3]
[本文引用: 3]
[本文引用: 2]
[本文引用: 2]
[本文引用: 2]
[本文引用: 1]
[本文引用: 1]
[本文引用: 2]
[本文引用: 1]
[本文引用: 1]
[本文引用: 1]
[本文引用: 1]
[本文引用: 1]
[本文引用: 1]
[本文引用: 1]
[本文引用: 1]
[本文引用: 1]
[本文引用: 1]
[本文引用: 1]
[本文引用: 1]
[本文引用: 1]
URLPMID:22803470 [本文引用: 1]

Soil samples (0-80 cm) were collected from a 30-year fertilization experimental site in Xuzhou, Jiangsu Province of East China to study the variations of the pH, calcium carbonate and active calcium carbonate contents, and pH buffer capacity of sandy loam calcareous fluvor-aquic soil under different fertilization treatments. Thirty-year continuous application of different fertilizers accelerated the acidification of topsoil (0-20 cm), with the soil pH decreased by 0.41-0.70. Under different fertilization, the soil pH buffer capacity (pHBC) varied from 15.82 to 21.96 cmol x kg(-1). As compared with no fertilization, single N fertilization decreased the pHBC significantly, but N fertilization combined with organic fertilization could significantly increase the pHBC. The soil pHBC had significant positive correlations with soil calcium carbonate and active calcium carbonate contents, but less correlation with soil organic matter content and soil cation exchange capacity, suggesting that after a long-term fertilization, the sandy loam calcareous fluvor-aquic soil was still of an elementary calcium carbonate buffer system, and soil organic matter and cation exchange capacity contributed little to the buffer system. The soil calcium carbonate and active calcium carbonate contents were greater in 0-40 cm than in 40-80 cm soil layer. Comparing with soil calcium carbonate, soil active calcium carbonate was more sensitive to reflect the changes of soil physical and chemical properties, suggesting that the calcium carbonate buffer system could be further classified as soil active calcium carbonate buffer system.
URLPMID:22803470 [本文引用: 1]
Soil samples (0-80 cm) were collected from a 30-year fertilization experimental site in Xuzhou, Jiangsu Province of East China to study the variations of the pH, calcium carbonate and active calcium carbonate contents, and pH buffer capacity of sandy loam calcareous fluvor-aquic soil under different fertilization treatments. Thirty-year continuous application of different fertilizers accelerated the acidification of topsoil (0-20 cm), with the soil pH decreased by 0.41-0.70. Under different fertilization, the soil pH buffer capacity (pHBC) varied from 15.82 to 21.96 cmol x kg(-1). As compared with no fertilization, single N fertilization decreased the pHBC significantly, but N fertilization combined with organic fertilization could significantly increase the pHBC. The soil pHBC had significant positive correlations with soil calcium carbonate and active calcium carbonate contents, but less correlation with soil organic matter content and soil cation exchange capacity, suggesting that after a long-term fertilization, the sandy loam calcareous fluvor-aquic soil was still of an elementary calcium carbonate buffer system, and soil organic matter and cation exchange capacity contributed little to the buffer system. The soil calcium carbonate and active calcium carbonate contents were greater in 0-40 cm than in 40-80 cm soil layer. Comparing with soil calcium carbonate, soil active calcium carbonate was more sensitive to reflect the changes of soil physical and chemical properties, suggesting that the calcium carbonate buffer system could be further classified as soil active calcium carbonate buffer system.
[本文引用: 1]
[本文引用: 1]
[本文引用: 1]
[本文引用: 1]
DOI:10.3864/j.issn.0578-1752.2013.10.012URL [本文引用: 2]
【Objective】Soil nutrient fertility status was investigated to formulate a suitable fertilization strategy so as to help to raise its economic and environmental benefits. 【Method】Soil samples from different layers (0-20 cm, 20-40 cm and 40−60 cm) were collected from 99 vineyard producing areas located in Changli, Huailai, Xuanhua and Zhuozhou counties in Hebei Province, respectively. 【Result】The content of soil organic matter was low at large, the deficiency rate of 0−20 cm, 20−40 cm and 40−60 cm was 52%, 76% and 90%, respectively. Moreover, the CV of vineyards soil N, P and K was high and the CV of surface soil was 113.1%, 143.5% and 68%, respectively. Similarly, the concentrations of Fe and Cu in vineyards soil were too high, 94% and 99% in surface soil above suitable content, respectively. However, the contents of Zn and Mn were low and the deficiency rate of Zn and Mn was 56% and 100% in surface soil, respectively. 【Conclusion】It was suggested that more organic matter, Zn, Mn, rational application of nitrogen and less Cu fungicide should be used in the tested vineyards.
[本文引用: 1]
[本文引用: 1]
[本文引用: 2]
[本文引用: 2]
[本文引用: 1]
[本文引用: 1]
DOI:10.3864/j.issn.0578-1752.2019.15.012URL [本文引用: 1]
【Objective】Balanced supply of mineral elements is the prerequisite for the high quality and efficient cultivation of grapes. This study was carried to investigate the mineral nutrient requirement of Kyoho grape, so as to provide a theoretical basis for rational fertilization and precise fertilization of grapes.【Method】Kyoho was used as test material. The whole plant was sampled at different growth stages in 7 consecutive years from 2012 to 2018. The contents of mineral elements in tree were determined, and the demand and proportion of mineral elements in different growth stages were calculated. 【Result】The absorption of mineral elements in Kyoho grapes varied during different growth stages throughout the growing season. The demand for nitrogen, potassium, iron, manganese, zinc and molybdenum from the germination to the initial flowering period exceeded 15% of the total annual demand, and the demand ratio of phosphorus, calcium, magnesium, copper and boron also exceeded 10%. From the beginning of flowering to the end of flowering period, the demand ratio of nitrogen, iron and molybdenum exceeded 15%, and the demand ratio of phosphorus, potassium, calcium, magnesium and zinc exceeded 10%. From the end of flowering to the veraison stage, the demand ratio of each mineral element was 41.7% nitrogen, 47.44% phosphorus, 44.83% potassium, 45.88% calcium, 44.92% magnesium, 39.75% iron, 27.40% manganese, 30.28% zinc, 60.20% copper, 38.72% boron, and 41.59% molybdenum. The demand for potassium, manganese and boron from the veraison stage to the harvesting period was relatively large, accounting for 21.76%, 22.19% and 20.17%, respectively. And the demand ratios of phosphorus, magnesium, calcium and zinc were 17.12%, 16.76%, 16.34% and 14.72%, respectively. While the demand ratio for nitrogen, iron, copper and molybdenum was less than 10%. During the harvesting period to the defoliation period, the demand ratios of manganese and zinc were 28.71% and 23.57%, respectively. The demand ratio of iron and boron exceeded 15%, and the proportion of nitrogen, calcium, magnesium and molybdenum also exceeded 10%. Phosphorus, potassium and copper accounted for 9.72%, 4.78% and 8.69%, respectively.【Conclusion】It should be paid attention to the supply of mineral element at different developmental phases of grapevine. The demand for mineral elements in the production of 1 000 kg of fruit was nitrogen 5.67 kg, phosphorus 2.37 kg, potassium 5.66 kg, calcium 5.70 kg, magnesium 1.02 kg, iron 153.45 g, manganese 53.14 g, zinc 36.25 g, copper 7.28 g, boron 41.84 g and molybdenum 0.47 g. The average contents of mineral elements in dry matter weight were nitrogen 0.92%, phosphorus 0.36%, potassium 0.66%, calcium 0.84%, magnesium 0.15%, iron 269.27 mg·kg -1, manganese 57.24 mg·kg -1, zinc 49.64 mg·kg -1, copper 12.66 mg·kg -1, boron 66.35 mg·kg -1 and molybdenum1.09 mg·kg -1.
[本文引用: 1]
[本文引用: 1]
[本文引用: 1]
[本文引用: 1]
[本文引用: 1]
[本文引用: 1]
[本文引用: 1]
[本文引用: 1]
[本文引用: 1]
[本文引用: 1]
[本文引用: 1]
[本文引用: 1]
[本文引用: 1]
[本文引用: 1]
[本文引用: 1]
[本文引用: 1]
[本文引用: 1]
[本文引用: 1]
[本文引用: 1]
[本文引用: 1]
[本文引用: 1]
[本文引用: 1]
[本文引用: 1]
[本文引用: 1]
[本文引用: 1]
[本文引用: 1]
[本文引用: 1]
[本文引用: 1]
[本文引用: 1]
[本文引用: 1]
[本文引用: 1]
[本文引用: 1]
[本文引用: 1]
[D].
[本文引用: 1]
[D].
[本文引用: 1]
[D].
[本文引用: 1]
[D].
[本文引用: 1]
[本文引用: 1]
[本文引用: 1]
[本文引用: 1]
[本文引用: 1]
[本文引用: 1]
[本文引用: 1]
[本文引用: 1]
[本文引用: 1]
[本文引用: 2]
