 ,1,2, 黄晶1,3, 孙钰翔4,5, 柳开楼1,6, 周虎5, 韩天富1, 都江雪1, 蒋先军2, 陈金,7, 张会民,1,3
Spatiotemporal Variability Characteristics of Soil Fertility in Red Soil Paddy Region in the Past 35 Years—A Case Study of Jinxian County
WANG YuanPeng,1,2, HUANG Jing1,3, SUN YuXiang4,5, LIU KaiLou1,6, ZHOU Hu5, HAN TianFu1, DU JiangXue1, JIANG XianJun2, CHEN Jin,7, ZHANG HuiMin,1,3通讯作者:
责任编辑: 李云霞
收稿日期:2019-09-30接受日期:2019-12-8网络出版日期:2020-08-16
| 基金资助: |
Received:2019-09-30Accepted:2019-12-8Online:2020-08-16
作者简介 About authors
王远鹏,E-mail:

摘要
关键词:
Abstract
Keywords:
PDF (4866KB)元数据多维度评价相关文章导出EndNote|Ris|Bibtex收藏本文
本文引用格式
王远鹏, 黄晶, 孙钰翔, 柳开楼, 周虎, 韩天富, 都江雪, 蒋先军, 陈金, 张会民. 近35年红壤稻区土壤肥力时空演变特征—以进贤县为例[J]. 中国农业科学, 2020, 53(16): 3294-3306 doi:10.3864/j.issn.0578-1752.2020.16.008
WANG YuanPeng, HUANG Jing, SUN YuXiang, LIU KaiLou, ZHOU Hu, HAN TianFu, DU JiangXue, JIANG XianJun, CHEN Jin, ZHANG HuiMin.
0 引言
【研究意义】我国南方稻区水热资源丰富,水稻种植面积广[1,2],而红壤是该地区典型的稻田土壤类型,对于我国粮食生产至关重要。近年来,随着农业生产中化肥投入量的持续增长以及秸秆还田和绿肥种植技术的推广,红壤稻区土壤肥力总体得到改善[3,4]。但中低产红壤稻田面积所占比重仍比较大[5],具有很大的增产潜力。因此,研究红壤稻田土壤肥力时空演变特征对于提高红壤稻田肥力和保障粮食生产具有重要意义。【前人研究进展】20世纪80年代起,我国大规模开展第二次土壤普查工作,基本摸清全国土壤养分状况。目前基于第二次土壤普查数据的土壤肥力演变的研究较多。与第二次土壤普查时比较,吉林省农田土壤有酸化趋势,有机质明显下降,碱解氮和有效磷有所提高,速效钾含量略有降低[6]。湖北省稻田土壤有机质、碱解氮和有效磷含量均有所提高,而速效钾含量和pH呈下降趋势[7]。海南省稻田土壤的有效磷、速效钾含量总体上有较大程度的提高,而大部分地区的土壤有机质都有不同程度的下降[8]。由于资料难以收集,前人关于区域土壤肥力演变的研究多基于两个时间段数据差值的简单比较,而基于多阶段的土壤肥力演变过程特征研究较少。就红壤稻田肥力演变而言,前人研究多基于长期定位试验[1,9-12]或单一肥力指标变化[13,14,15],无法客观全面表征常规水肥管理下的土壤肥力水平及其变化特征。【本研究切入点】近年来随着田间管理和农耕制度不断完善,红壤稻区土壤肥力发生明显变化,然而在不同时间阶段其肥力演变特征尚不明确。进贤县是典型的红壤稻区,探究进贤县3个时间阶段稻田肥力特征对于研究红壤稻区土壤肥力时空演变特征具有较好的代表性。【拟解决的关键问题】基于县域尺度研究近35年进贤县红壤稻区土壤在常规水肥管理下土壤肥力变化,掌握该地区稻田土壤肥力状况及其时空演变规律,可为红壤稻区土壤培肥及农耕管理提供科学依据。1 材料与方法
1.1 研究区概况
进贤县为江西省南昌市下辖县,位于鄱阳湖南部(N28°10′—28°46′,E116°01′—116°34′),地处亚热带季风湿润气候区,年均温度为17.5℃,年均日照时长为1 936 h,年均降水量为1 587 mm。该县为典型的低丘地形(海拔9—257 m),北部濒临湖滨,山水环绕,南部为低丘山峦,地势整体呈东南高西北低,起伏平缓。该县稻田以红壤性水稻土为主,水稻种植制度为早稻-晚稻,稻田面积为7.6×10⁴ hm2,占耕地面积的89%,是鄱阳湖流域具有代表性的水稻种植区域。1.2 样品的采集与分析
选取土壤pH、有机质、碱解氮、有效磷和速效钾为土壤肥力评价指标。1982年土壤属性数据来源于第二次土壤普查资料,并以1982年第二次进贤县土壤普查数据作参照,兼顾高、中、低产的稻田,以相对均匀空间分布原则,为避免水稻生长期间施肥的影响,先后于2008年和2017年在水稻收获后按照5点法采取耕层(0—20 cm)土壤样品100个和103个,采样时利用GPS记录采样点经纬度。将土样室内风干,剔除动植物残渣等杂质并磨细过筛,用于土壤理化性质的测定。测定方法参见《土壤农化分析》[16]。1.3 数据处理
利用Excel 2010数据整理。离群值的存在影响土壤变量的空间分布,采用阈值法[7, 17]对离群值进行剔除。离群值大于样本平均值加3倍标准差,则用样本平均值加3倍标准差代替。离群值小于样本平均值减3倍标准差,则用样本平均值减3倍标准差代替。其中,针对pH、有机质、碱解氮、有效磷和速效钾数据剔除的离群值分别为2、1、3、2和5个。LSD差异性分析和主成分分析均在SPSS 19.0软件完成。土壤肥力指标和土壤综合肥力指数分布图在ArcGIS 10.2的地统计分析模块(Geostatistical Analyst)中完成。箱式图在Origin 9.0中完成。1.4 土壤肥力评价方法
权重的确定:为避免主观性,本文借鉴康日峰等[18]的方法,进行主成分分析计算权重。主成分中的载荷值除以主成分对应的特征值开平方根得到主成分中对应的特征向量,将各个主成分中特征向量与对应贡献率的乘积相加再除以所提取的主成分贡献率之和即为各个指标的综合得分。指标权重则由各个指标的综合得分除以总得分得到。隶属度值的计算:隶属度函数表示的是评价指标与作物效应之间的关系曲线[19],将参评指标转变为0—1无量纲的数值,起到原始数据标准化的作用。土壤有机质、碱解氮、有效磷和速效钾采用S型隶属函数(公式1),土壤pH采用抛物线型隶属函数(公式2)。
以全国第二次土壤普查的养分分级标准[20]作参考(表1),兼顾3个时期土壤养分状况,借鉴《土壤质量指标与评价》中稻田土壤肥力指标隶属度函数的阈值范围[19],确定隶属度函数曲线转折点的值(表2)。
Table 1
表1
表1土壤养分分级标准对照表
Table 1
| 等级 Grade | pH | 等级 Grade | SOM (g·kg-1) | AN (mg·kg-1) | AP (mg·kg-1) | AK (mg·kg-1) |
|---|---|---|---|---|---|---|
| 强酸 Strong acid | <4.5 | 一级 Grade 1 | >40 | >150 | >40 | >200 |
| 酸性 Acidity | 4.5—5.5 | 二级 Grade 2 | 30—40 | 120—150 | 20—40 | 150—200 |
| 微酸 Slightly acid | 5.5—6.5 | 三级 Grade 3 | 20—30 | 90—120 | 10—20 | 100—150 |
| 中性 Neutral | 6.5—7.5 | 四级 Grade 4 | 10—20 | 60—90 | 5—10 | 50—100 |
| 碱性 Alkalinity | >7.5 | 五级 Grade 5 | 6—10 | 30—60 | 3—5 | 30—50 |
| 六级 Grade 6 | <6 | <30 | <3 | <30 |
新窗口打开|下载CSV
Table 2
表2
表2隶属函数曲线转折点取值
Table 2
| 转折点 Turning point | pH | SOM (g·kg-1) | AN (mg·kg-1) | AP (mg·kg-1) | AK (mg·kg-1) |
|---|---|---|---|---|---|
| x1 | 4.5 | 20 | 100 | 5 | 50 |
| x2 | 6.0 | 40 | 200 | 40 | 150 |
| x3 | 7.0 | ||||
| x4 | 8.5 |
新窗口打开|下载CSV
土壤综合肥力评价指数的计算:以模糊数学中的加乘原则为原理,利用各土壤肥力指标的权重值和隶属度值计算土壤综合肥力指数(integrated fertility index,IFI)[21],具体计算公式如下:
式中,Fi为第i项评价指标的隶属度值,Wi为第i项评价指标的权重。IFI取值范围在0—1之间,该值越接近于1,土壤肥力越高。肥力分级:参考《土壤质量指标与评价》中红壤稻区土壤综合肥力等级划分标准[19]将进贤县稻田土壤肥力分为5级:一级(IFI≥0.85)、二级(IFI:0.85—0.70)、三级(IFI:0.70—0.50)、四级(IFI:0.50—0.35)和五级(IFI<0.35)。
2 结果
2.1 不同时期稻田土壤肥力指标的统计分析
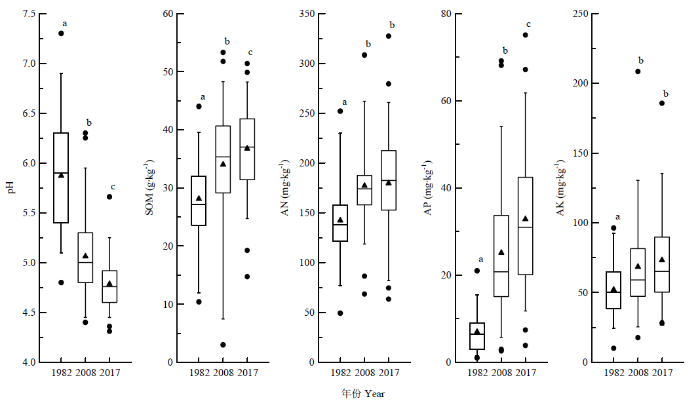
对进贤县稻田土壤各项肥力指标进行统计分析(图1),随着耕种年限的增加,土壤有机质、碱解氮、有效磷和速效钾均呈不同程度的上升趋势,而土壤pH呈逐渐显著下降的趋势。1982、2008年和2017年稻田土壤pH平均值分别为5.9、5.1和4.8;土壤pH下降趋势显著,1982—2008年和2008—2017年前后两个阶段土壤pH年均下降速率基本一致,均为0.03个单位。2008年和2017年土壤有机质含量平均值分别为34.0和36.8 g·kg-1,分别比1982年土壤有机质含量的平均值(28.1 g·kg-1)增加21%和31%;1982—2008年土壤有机质年均增加0.21 g·kg-1,2008—2017年土壤有机质年均增加速率提高,年均增加0.31 g·kg-1。1982年土壤碱解氮含量在49.2—252.0 mg·kg-1之间,平均值为142.3 mg·kg-1,而2008年和2017年土壤碱解氮含量的平均值没有显著差异,分别为177.0和179.7 mg·kg-1,1982—2008年土壤碱解氮年均增加1.24 mg·kg-1,而2008—2017年土壤碱解氮年均增加速率减缓,年均增加仅0.29 mg·kg-1。1982、2008和2017年土壤有效磷含量的平均值分别为7.0、25.1和32.1 mg·kg-1,1982—2008年和2008—2017年间土壤有效磷含量年均增加速率分别为0.65和0.68 mg·kg-1。2008年和2017年土壤速效钾含量的平均值没有显著差异,分别为68.4和73.2 mg·kg-1,相比于1982年土壤速效钾含量的平均值52.1 mg·kg-1,分别提高了31%和41%;1982—2008年和2008—2017年两个阶段土壤速效钾含量年均增加速率分别为0.58和0.53 mg·kg-1。图1
 新窗口打开|下载原图ZIP|生成PPT
图1进贤县稻田土壤各项肥力指标变化趋势
Fig. 1Variation trend of soil fertility factors in paddy soil of Jinxian County
2.2 不同时期稻田土壤肥力贡献因子分析
运用主成分分析法探究进贤县1982、2008和2017年3个时期土壤pH、有机质、碱解氮、有效磷和速效钾5个肥力指标对土壤综合肥力的影响,结果见表3。根据累积贡献率≥85%提取主成分的原则,1982、2008和2017年3个时期均提取4个主成分,累积贡献率分别为92%、90%、88%,3个时期累积贡献率均大于85%,因此3个时期所提取的主成分作为评价综合变量评价土壤肥力状况均是可行的。进贤县3个时期稻田土壤肥力指标综合得分分别为:碱解氮>有效磷>pH>速效钾>有机质(1982年);pH>有效磷>速效钾>有机质>碱解氮(2008年);速效钾>有效磷>pH>碱解氮>有机质(2017年),说明碱解氮、pH和速效钾分别为3个时期影响进贤县稻田土壤肥力空间分布特征的关键因素。Table 3
表3
表31982、2008和2017年进贤县土壤各肥力指标主成分分析结果与指标权重
Table 3
| 年份 Year | 肥力指标 Fertility factor | 主成分 Principal component | 综合得分 Score | 指标权重 Weight | |||
|---|---|---|---|---|---|---|---|
| PC1 | PC2 | PC3 | PC4 | ||||
| 1982 | pH | 0.160 | 0.012 | -0.132 | 0.975 | 0.229 | 0.187 |
| SOM | 0.853 | -0.156 | -0.176 | 0.230 | 0.201 | 0.165 | |
| AN | 0.854 | 0.265 | 0.192 | 0.019 | 0.331 | 0.271 | |
| AP | 0.056 | 0.982 | 0.073 | 0.009 | 0.252 | 0.206 | |
| AK | 0.011 | 0.076 | 0.980 | -0.132 | 0.208 | 0.170 | |
| 特征值 Eigenvalue | 1.486 | 1.065 | 1.051 | 1.022 | |||
| 贡献率Contribution rate (%) | 29.716 | 21.295 | 21.011 | 20.445 | |||
| 累计贡献率 Cumulative contribution rate (%) | 29.716 | 51.011 | 72.022 | 92.468 | |||
| 2008 | pH | 0.876 | 0.258 | 0.161 | -0.026 | 0.302 | 0.294 |
| SOM | -0.092 | -0.082 | 0.062 | 0.985 | 0.189 | 0.184 | |
| AN | -0.684 | 0.392 | 0.364 | 0.201 | 0.052 | 0.051 | |
| AP | 0.017 | 0.063 | 0.975 | 0.056 | 0.254 | 0.247 | |
| AK | 0.080 | 0.949 | 0.061 | -0.097 | 0.230 | 0.224 | |
| 特征值 Eigenvalue | 1.251 | 1.131 | 1.116 | 1.025 | |||
| 贡献率 Contribution rate (%) | 25.019 | 22.622 | 22.318 | 20.49 | |||
| 累计贡献率 Cumulative contribution rate (%) | 25.019 | 47.641 | 69.959 | 90.449 | |||
| 2017 | pH | 0.905 | -0.124 | -0.024 | 0.132 | 0.222 | 0.210 |
| SOM | -0.091 | -0.051 | 0.984 | -0.089 | 0.169 | 0.160 | |
| AN | 0.637 | 0.504 | -0.213 | -0.130 | 0.204 | 0.193 | |
| AP | 0.062 | 0.050 | -0.085 | 0.980 | 0.230 | 0.218 | |
| AK | -0.038 | 0.937 | -0.019 | 0.078 | 0.231 | 0.219 | |
| 特征值 Eigenvalue | 1.238 | 1.153 | 1.022 | 1.009 | |||
| 贡献率 Contribution rate (%) | 24.762 | 23.062 | 20.448 | 20.189 | |||
| 累计贡献率 Cumulative contribution rate (%) | 24.762 | 47.824 | 68.272 | 88.461 | |||
新窗口打开|下载CSV
2.3 稻田土壤各项肥力指标时空演变特征
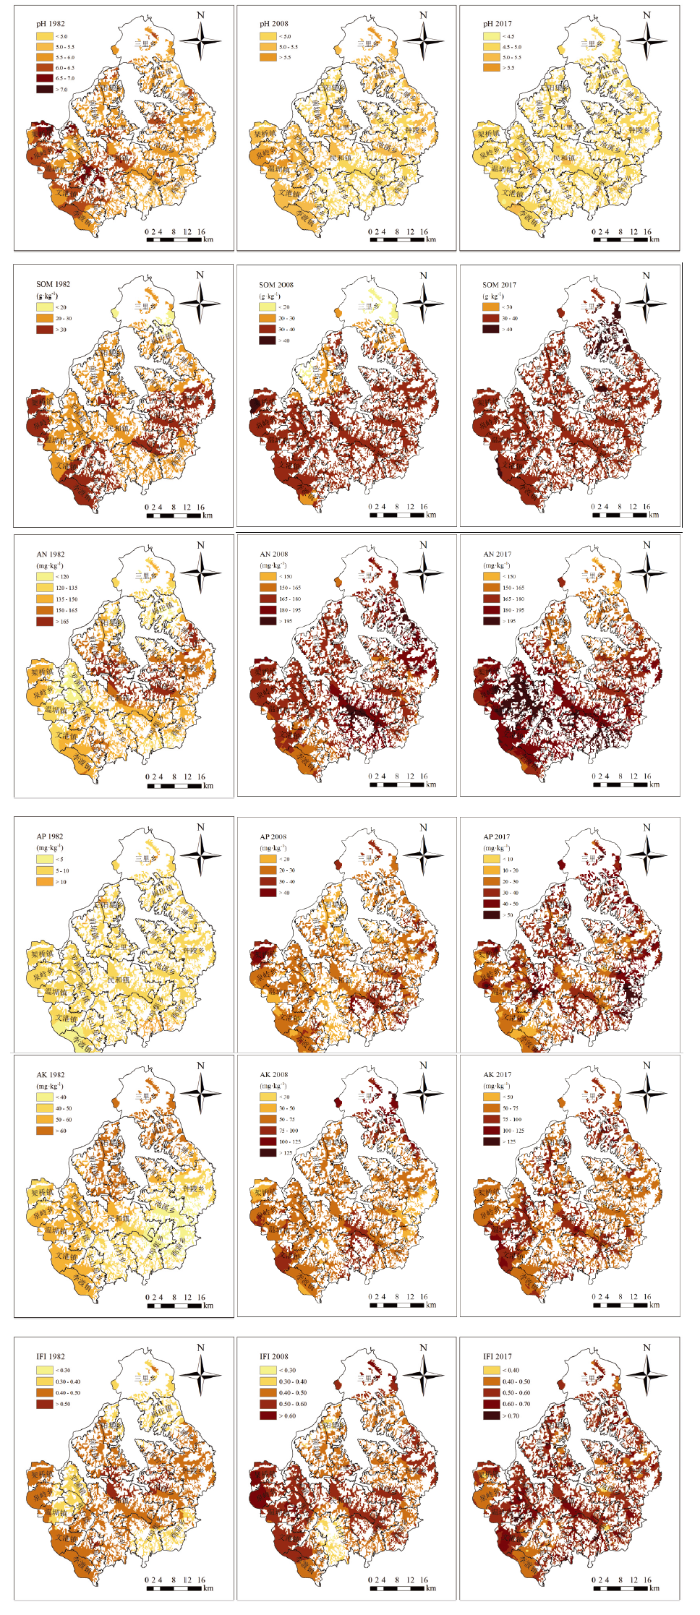
利用ArcGIS地统计分析模块中的普通克里格方法绘制土壤肥力指标和综合肥力指数的分布图(图2),并作了面积比例统计(表4)。1982年进贤县81%的稻田土壤pH处于微酸水平,土壤pH处于中性水平的稻田占比为5%,主要分布在架桥镇东部、罗溪镇北部以及张公镇和白圩乡的交汇处。2008年93%的稻田土壤处于酸性水平,至2017年土壤pH处于酸性水平的稻田占比增加到99%。1982—2017年各乡镇土壤pH出现不同程度下降,整体由西部向东南和西北下降速率逐渐减低,下降范围在0—2.52个单位之间,其中罗溪镇北部和架桥镇下降程度最高。图2
 新窗口打开|下载原图ZIP|生成PPT
图2土壤肥力指标及综合肥力指数分布图
Fig. 2Distribution map of soil fertility factors and integrated fertility index
Table 4
表4
表4不同时期土壤肥力指标和综合肥力指数面积比例统计结果
Table 4
| 项目 Item | 年份 Year | 面积占比 Area ratio (%) | ||||
|---|---|---|---|---|---|---|
| 强酸Strong acid | 酸性Acidity | 微酸Slightly acid | 中性Neutral | 碱性Alkalinity | ||
| pH | 1982 | 0 | 14 | 81 | 5 | 0 |
| 2008 | 0 | 93 | 7 | 0 | 0 | |
| 2017 | 1 | 99 | 0 | 0 | 0 | |
| 目 Item | 年份 Year | 面积占比 Area ratio (%) | ||||
| 一级 Grade 1 | 二级 Grade 2 | 三级 Grade 3 | 四级 Grade 4 | 五级 Grade 5 | ||
| SOM | 1982 | 0 | 38 | 59 | 3 | 0 |
| 2008 | 2 | 81 | 14 | 3 | 0 | |
| 2017 | 6 | 94 | 0 | 0 | 0 | |
| AN | 1982 | 30 | 64 | 6 | 0 | 0 |
| 2008 | 100 | 0 | 0 | 0 | 0 | |
| 2017 | 98 | 2 | 0 | 0 | 0 | |
| AP | 1982 | 0 | 0 | 1 | 93 | 6 |
| 2008 | 3 | 79 | 18 | 0 | 0 | |
| 2017 | 19 | 75 | 6 | 0 | 0 | |
| AK | 1982 | 0 | 0 | 0 | 59 | 41 |
| 2008 | 0 | 0 | 4 | 86 | 10 | |
| 2017 | 0 | 0 | 10 | 89 | 1 | |
| IFI | 1982 | 0 | 0 | 7 | 86 | 7 |
| 2008 | 0 | 0 | 58 | 41 | 1 | |
| 2017 | 0 | 21 | 78 | 1 | 0 | |
新窗口打开|下载CSV
1982年和2008年稻田土壤有机质含量的空间分布特征相似,整体呈南高北低的分布格局,2017年土壤有机质含量空间分布相对均匀。1982—2017年间大部分乡镇土壤有机质呈上升趋势,整体由东北向西南上升速率逐渐减低,其中三乡里和梅庄镇土壤有机质含量增加幅度最大,由1982年的三、四级水平上升至2017年的一、二级水平,局部增加值最高可达24.6 g·kg-1。1982年以有机质含量处于三级水平的稻田为主,占比为59%,二级水平的稻田土壤占比为38%,2008—2017年土壤有机质处于二级水平的稻田占比由81%上升为94%。
1982年稻田土壤碱解氮含量呈中间高,南北低的分布格局,以碱解氮含量处于一、二级水平的稻田为主,占比分别为30%和64%。至2008年土壤碱解氮含量为一级水平的稻田占比接近100%。2017年稻田土壤碱解氮含量由北向南呈逐渐增加的趋势,碱解氮含量为一级水平的稻田占比为98%。35年来进贤县土壤碱解氮含量东南地区上升速率高,西北地区上升速率低,其中罗溪镇和张公镇土壤碱解氮含量增加最为明显,1982年两镇土壤碱解氮含量多为120.0 mg·kg-1,而2017年土壤碱解氮含量均在195.0 mg·kg-1以上,涨幅最高可达105.6 mg·kg-1。
1982年稻田土壤有效磷含量的空间分布相对均匀,93%的稻田土壤有效磷含量处于四级水平,仅三里乡、三阳集乡、下埠集乡和衙前乡少部分区域土壤有效磷含量处于四级水平以上。1982—2008年进贤县土壤有效磷含量均出现不同程度的增加,其中民和镇和下埠集乡的交汇处以及架桥镇土壤有效磷含量增加幅度最大,其局部区域有效磷含量增加值最高可达47.93 mg·kg-1。2017年土壤有效磷含量空间分布特征不明显,与1982年相比,大部分区域稻田土壤有效磷含量出现不同程度的增加,增加范围在0—67.06 mg·kg-1,与2008年相比,表现为局部地区存在增加或者下降的趋势,有效磷含量为一级水平的稻田土壤占比由3%增加至19%,零星分布在各个乡镇;二级水平的稻田土壤占比由79%下降至75%。
1982年稻田土壤速效钾含量整体偏低,大多处于四、五级水平,占比分别为59%和41%,由西北向东南呈降低的趋势,具有较强的空间连续性。2008年以土壤速效钾含量处于四级水平的稻田为主,占比为86%;而三级水平的稻田占比为4%,集中在三里乡和梅庄镇;五级水平的稻田占比为10%,主要集中在钟陵乡南部和池溪乡东部。2017年进贤县89%的稻田土壤速效钾含量处于四级水平,其空间分布连续性较差,其中在各乡镇中,以温川镇、文港镇和梅庄镇的土壤速效钾含量最高。1982—2017年稻田土壤速效钾含量升降变化不一,变化幅度在-26.15—104.64 mg·kg-1。
1982年进贤县稻田土壤综合肥力指数平均值为0.43,以四级水平为主,占比为86%,三级水平的稻田占比为7%,主要分布在七里乡、民和镇和池溪乡。2008年土壤综合肥力指数平均值为0.50,处于三、四级水平的稻田占比分别为58%和41%,仅有1%的稻田土壤综合肥力指数仍处于五级水平,集中在白圩乡中部地区。2017年土壤综合肥力指数平均值为0.55,处于二级水平的稻田占比新增至21%,三级水平的稻田增加至78%。1982—2017年罗溪镇、张公镇、温圳镇、三里乡、梅庄镇和下埠集乡土壤综合肥力指数增加幅度最大,均提高两个肥力等级。
3 讨论
1982—2017年进贤县各乡镇稻田土壤pH出现不同程度下降,至2017年进贤县稻田土壤pH平均值为4.8。农业农村部30年长期监测结果显示,全国稻田土壤监测前期(1988—2001)快速下降,后期(2007—2016)pH稳定在6.0—6.1[22]。与全国尺度典型稻区土壤pH变化相比,进贤县稻田土壤pH下降速度较快,1982—2008年和2008—2017年前后两个阶段土壤pH年均下降速率没有差异。2017年进贤县稻田土壤整体呈酸性,土壤酸化严重,这与前人研究结果一致。樊亚男等[23]将水稻产量和主成分相关分析结合发现进贤县影响土壤肥力的主要障碍因子是土壤酸化。土壤pH下降主要受到氮肥投入、植物吸收阳离子和酸沉降的影响[15, 24-25],经实地调研发现进贤县稻田土壤氮肥(N)年均施入量由1982年的90 kg·hm-2增加到2017年的360 kg·hm-2,大量氮肥的施用可能导致土壤发生明显酸化;其次,植物的生长和收获会从土壤中吸收和移除盐基离子,根系每吸收1 mol盐基离子会向土壤中释放等当量H+[24]。近30多年来,进贤县种植模式由单一水稻种植改变为绿肥-双季稻多种作物复合种植,连续的作物种植增加土壤中H+含量,进一步促进土壤酸化;此外,进贤县处于酸雨沉降区,酸沉降也是进贤县稻田土壤酸化加剧的原因之一。1982—2017年进贤县各乡镇大部分稻田土壤有机质、碱解氮、有效磷和速效钾含量均出现不同程度的上升趋势。各项养分指标的上升与该地区持续增长的化肥投入量及2000年后秸秆还田技术的推行有关。自20世纪80年代开始江西省化肥施用较为普遍,且施肥量逐年增加,1982—2017年全省化肥施用总量由37.1万t到134.97万t,进贤县稻田土壤化肥投入量也同比增长。前人研究表明,作物秸秆作为农作物最主要的副产品,含有大量有机质和丰富的氮、磷、钾等营养元素[26,27],与秸秆不还田相比,秸秆还田能提高稻田土壤有机质、全氮、有效磷和速效钾含量[10]。1982—2008年稻田土壤有机质年均增加速率较慢,2008—2017年土壤有机质年均增加速率较小幅度提高,两个时期稻田土壤有机质增速出现差异可能与该地区绿肥-双季稻的种植模式有关。首先,常规双季稻的种植模式使得稻田处于长期淹水条件下,土壤处于嫌气厌氧环境,微生物代谢缓慢,有机质分解速率下降,易于积累[28,29,30]。其次,2000年开始,进贤县的绿肥种植发展迅速,研究表明绿肥能显著增加稻田土壤有机质含量[12],因此与1982—2008年相比,2008—2017年土壤有机质增长速率有所提高。土壤有机质是土壤氮素的主要来源,有机质矿化会释放大量氮素[14],1982—2008年进贤县稻田土壤有机质的不断累积使得碱解氮含量快速增加,且稻田氮肥投入量过大,2008年土壤碱解氮含量已达到一级水平,可能是由于氮素过剩,存在氮素损失风险,进贤县高温多雨的气候易造成土壤NH3挥发或者土壤中氮素随着径流水或田面排水而流失[31],因此2008—2017年土壤碱解氮年均增加速率明显变慢。稻田土壤有效磷累积速率较快,年均增加0.70 mg·kg-1,由1982年的7.0 mg·kg-1提高到2017年的32.1 mg·kg-1,这与磷肥投入量加大以及土壤类型和磷素特性有关。1982—2017年进贤县稻田磷肥(P2O5)年均投入量由35 kg·hm-2上升到180 kg·hm-2。进贤县稻田土壤多为红壤,红壤是由氧化铁和氧化铝胶体形成的结构体,大量活性铁铝的存在促使土壤对磷素有较强的固定作用,且磷素本身迁移能力较弱,易被吸附固定[31],因此进贤县稻田土壤有效磷显著增加。进贤县稻田土壤速效钾含量1982—2017年仅增加21.09 mg·kg-1,土壤速效钾含量累积缓慢与该地区土壤类型有关,进贤县稻田土壤多属于红壤,红壤中不含钾的高岭类黏土矿物占比较高, 而云母类黏土矿物占比只为6%—17%[32],因此土壤本身较低的供钾潜力也决定进贤县稻田土壤速效钾含量较低;稻田长期钾肥施用不足也是造成土壤钾素平衡处于亏缺状态,2017年进贤县稻田土壤钾肥(K2O)年均施入量约为300 kg·hm-2,而前人研究表明一季水稻吸收的K2O约为225 kg·hm-2[31],尽管施行秸秆还田技术,但双季稻的种植模式仍加剧土壤速效钾的消耗;此外,有研究表明红壤稻区土壤质地黏重,黏粒含量较高,土壤钾素主要集中在黏粒中。水耕条件下,稻田土壤黏粒随着水分下渗,造成含钾矿物机械淋失[32]。绿肥种植促进水稻对钾素吸收[12],使得土壤速效钾累积更加缓慢,因此稻田土壤速效钾在1982—2008年和2008—2017年两个阶段增长速率均呈先快后慢的趋势。
与2008年和2017年相比,1982年土壤各项肥力指标和综合肥力指数在空间分布更具连续性,具有明显的分布特征。1982年以前,田间管理程度低,养分投入少,1982年以后实行家庭联产承包责任制进行土地调整,当地稻田小而分散,秸秆还田、绿肥还田和有机肥化肥配施等管理方式的应用程度存在较大差异[2],造成土壤各项肥力指标和综合肥力指数在空间分布上缺乏连续性。有研究表明实行土地整改,将小田块合并扩大,统一基础设施,能够显著降低稻田土壤有效养分的总体差异性[33]。家庭联产承包责任制虽然造成田块碎片化,但是也促使农民加大对稻田土壤的养分投入以及水稻种植模式的不断优化,使得35年来进贤县稻田土壤肥力水平总体得到提高。当前进贤县稻田土壤肥力水平整体处于三级中等水平,大部分稻田土壤有机质、碱解氮和有效磷含量达到二级及以上水平,但土壤酸化和资源浪费问题突出,尤其是氮素资源。包耀贤等[11]基于进贤长期定位试验点研究红壤稻区土壤肥力,结果表明长期平衡施肥能够提高土壤综合肥力,而氮磷钾肥配施有机肥的增肥效果显著高于氮磷钾配施,长期偏施肥不利于土壤培肥,尤其单施氮肥反而造成土壤肥力下降。因此,优化施肥结构,适当控制氮肥用量,提高氮肥利用率,增加钾肥投入,化肥有机肥合理配施的同时,适当使用石灰等碱性改良剂,有助于稻田土壤肥力的提高和防止土壤酸化。
4 结论
经35年常规施肥管理的稻田土壤肥力水平得到提高,土壤有机质、碱解氮、有效磷和速效钾均呈不同程度的上升趋势,土壤pH呈下降趋势。当前稻田土壤肥力整体处于三级中等水平,土壤pH平均值为4.8,土壤有机质、碱解氮、有效磷和速效钾含量平均值分别为36.8 g·kg-1、179.7 mg·kg-1、32.8 mg·kg-1和73.2 mg·kg-1。土壤碱解氮、pH和速效钾分别为1982年、2008年和2017年3个时期造成进贤县稻田土壤肥力空间分布差异性的关键因素。进贤县稻田土壤碱解氮过量、速效钾亏缺、土壤酸化严重,需优化施肥结构。参考文献 原文顺序
文献年度倒序
文中引用次数倒序
被引期刊影响因子
[本文引用: 2]
[本文引用: 2]
[本文引用: 2]
[本文引用: 2]
[本文引用: 1]
[本文引用: 1]
[本文引用: 1]
[本文引用: 1]
[本文引用: 1]
[本文引用: 1]
[本文引用: 1]
[本文引用: 1]
[本文引用: 2]
[本文引用: 2]
[本文引用: 1]
[本文引用: 1]
DOI:10.3864/j.issn.0578-1752.2016.06.009URL [本文引用: 1]

【Objective】 In order to reveal the impact of various fertilization treatments on the characteristics of paddy soil phosphorus (P) evolution, and its response to soil P balance. We analyzed the annual variation of soil available P content, total P content, soil P balance, and phosphorus activation coefficient (PAC). 【Method】 This study was based on a long-term different fertilization experiment of paddy soil in subtropical China that was established in 1982. The different fertilization treatments included non-fertilization (CK), cattle manure (M), chemical nitrogen (N), P and potassium (K) fertilizer (NPK), NPK with M (NPKM), N and P fertilizer with M (NPM), N and K fertilizer with M (NKM), and P and K fertilizer with M (PKM). The annual variation characteristics of soil available P content, total P content, soil P balance, and PAC from 1982 to 2012 were analyzed. 【Result】 Soil available P content improved efficiently through fertilizer application. The change rate of soil available P content of M, NKM, NPK, NPM, NPKM, and PKM was 0.18, 0.20, 0.83, 1.35, 1.46, and 1.62 mg·kg-1·a-1, respectively. The soil total P content was on the decline under non-fertilization. The change rate of the soil total P content of M, NPK, PKM, NPM, and NPKM was 4.3, 15.4, 16.0, 18.3, and 22.9 mg·kg-1·a-1, respectively. All the fertilizer treatments had a P surplus no matter whether applying chemical fertilizer or cattle manure. The P apparent balance was significantly correlated with the Olsen-P increment (P<0.05). With an average surplus of 100 kg P·hm-2, the soil Olsen-P increased by 0.4, 0.7, 1.9, 2.1, 2.2, and 3.2 mg·kg-1, in the M, NKM, NPM, NPKM, PKM, and NPK treatments, respectively. The PAC of NPK was significantly higher than M and NKM (P<0.05), while there was no significant difference in the soil P surplus amount among these treatments. 【Conclusion】Applying chemical P fertilizer plus cattle manure can significantly improve the soil available P, total P content, and PAC, compared with the treatments that applied chemical fertilizer or cattle manure alone.
DOI:10.3864/j.issn.0578-1752.2016.06.009URL [本文引用: 1]
【Objective】 In order to reveal the impact of various fertilization treatments on the characteristics of paddy soil phosphorus (P) evolution, and its response to soil P balance. We analyzed the annual variation of soil available P content, total P content, soil P balance, and phosphorus activation coefficient (PAC). 【Method】 This study was based on a long-term different fertilization experiment of paddy soil in subtropical China that was established in 1982. The different fertilization treatments included non-fertilization (CK), cattle manure (M), chemical nitrogen (N), P and potassium (K) fertilizer (NPK), NPK with M (NPKM), N and P fertilizer with M (NPM), N and K fertilizer with M (NKM), and P and K fertilizer with M (PKM). The annual variation characteristics of soil available P content, total P content, soil P balance, and PAC from 1982 to 2012 were analyzed. 【Result】 Soil available P content improved efficiently through fertilizer application. The change rate of soil available P content of M, NKM, NPK, NPM, NPKM, and PKM was 0.18, 0.20, 0.83, 1.35, 1.46, and 1.62 mg·kg-1·a-1, respectively. The soil total P content was on the decline under non-fertilization. The change rate of the soil total P content of M, NPK, PKM, NPM, and NPKM was 4.3, 15.4, 16.0, 18.3, and 22.9 mg·kg-1·a-1, respectively. All the fertilizer treatments had a P surplus no matter whether applying chemical fertilizer or cattle manure. The P apparent balance was significantly correlated with the Olsen-P increment (P<0.05). With an average surplus of 100 kg P·hm-2, the soil Olsen-P increased by 0.4, 0.7, 1.9, 2.1, 2.2, and 3.2 mg·kg-1, in the M, NKM, NPM, NPKM, PKM, and NPK treatments, respectively. The PAC of NPK was significantly higher than M and NKM (P<0.05), while there was no significant difference in the soil P surplus amount among these treatments. 【Conclusion】Applying chemical P fertilizer plus cattle manure can significantly improve the soil available P, total P content, and PAC, compared with the treatments that applied chemical fertilizer or cattle manure alone.
[本文引用: 1]
[本文引用: 1]
[本文引用: 1]
[本文引用: 1]
[本文引用: 3]
[本文引用: 3]
[本文引用: 1]
[本文引用: 1]
[本文引用: 2]
[本文引用: 2]
[本文引用: 2]
[本文引用: 2]
[本文引用: 1]
[本文引用: 1]
[本文引用: 1]
[本文引用: 1]
DOI:10.3864/j.issn.0578-1752.2016.11.008URL [本文引用: 1]
【目的】东北黑土区土壤肥沃,是中国重要的粮食主产区之一。对东北黑土区20世纪80年代以来国家级耕地质量长期监测数据进行整理和分析,以明确中国东北黑土区农业生产实践中土壤养分状况和肥力水平,为农田土壤培肥提供科学指导依据。【方法】利用时间趋势分析法探讨17个国家级黑土耕地质量长期监测点26年来土壤养分随时间的变化趋势,分别总结土壤有机质(SOM)、全氮(TN)、碱解氮(AN)、有效磷(AP)和速效钾(AK)含量在监测初期(1988—1997年)、监测中期(1998—2003年)和监测后期(2004—2013年)的变化规律及其总体变化趋势;在分析土壤全氮和有机碳含量变化特征以及碳氮比(C/N)演变规律的基础上,进一步分析碳和氮之间的养分平衡关系;运用主成分分析方法分析不同监测时期上述5大肥力指标对黑土区土壤综合肥力的影响,得出该区综合肥力主要贡献因子,并分别计算3个不同监测时期黑土区土壤综合肥力属性得分。【结果】黑土区农田土壤经过10—26年的演变,土壤有机质、全氮、碱解氮、有效磷、速效钾含量整体呈上升趋势。与监测初期相比,监测后期土壤养分含量均显著提高(P<0.05),土壤有机质、全氮、碱解氮、有效磷和速效钾分别提高了33.9%、43.9%、27.6%、90.3%和11.8%,有效磷提升效果最为显著。进一步分析土壤有效磷含量发现,监测后期71.4%的监测点土壤有效磷含量维持在15.0—50.0 mg·kg-1,既能满足作物生长需求,又不至于引发地下水环境污染,而28.6%的监测点土壤有效磷含量已超过50.0 mg·kg-1的环境阈值,应及时控制磷素的输入。分析主要肥力因素有机碳和全氮之间的关系表明,黑土区土壤C/N略有下降趋势,从1988年的10.3降至2013年的9.6,下降了6.8%。黑土区5个肥力指标得分系数由大到小的顺序为:SOM>TN>AN>AP>AK,说明黑土区土壤有机质和全氮是影响土壤综合肥力的关键因素;监测初期和监测中期土壤综合肥力属性得分平均值分别为-1.099和-0.541,而监测后期土壤综合肥力属性的得分增加到了0.5888,监测后期土壤综合肥力得到显著提升。【结论】在农民常规施肥条件下,经过10—26年的长期耕作,黑土区土壤肥力在监测后期得到显著改善,但28.6%的监测点应注意控制磷肥用量,以免引起水体污染;而监测区黑土C/N呈逐年下降趋势,应该加大有机物料的投入,以维持土壤碳氮的养分平衡。
[本文引用: 3]
[本文引用: 3]
[本文引用: 1]
[本文引用: 1]
URL [本文引用: 1]
土壤肥力是土壤的养分状况以及土壤在供应植物生理所需物质时所处的环境条件这两者的有机结合,本文根据模糊(Fuzzy)数学和多元数理统计分析原理,建立了一个定量的土壤肥力综合评价方法.首先,利用我国东南丘陵山区的第二次全国土壤普查资料,选取了11项评价指标,分成两组,并根据其植物效应建立了两类隶属度函数(S型和抛物线型),分别计算了隶属度值.然后,利用统计分析软件STATGRAPHICS进行因子分析,确定各因子的权重.最后,根据加乘法则,求出土壤肥力的综合性评价指标值(IFI,Integrated Fertility Index).根据评价结果,采用地理信息系统(GIS)软件ILWIS绘制了东南丘陵区土壤肥力状况图.从土壤肥力水平与该区粮食、水果产量水平进行比较中,我们找出了存在差距的地区以及引起这些差距的主要因子.结果表明,这一地区土壤肥力大多处于中下水平,高、中、低肥力土壤的面积比例分别为25.9%、40.8%和33.3%.内陆腹地,特别是土壤肥力较高的安徽沿江平原、鄱阳湖平原、湘西武陵山区和广西的河池等地区,土壤肥力资源尚有较大潜力待进一步挖掘,限制本区土壤肥力资源潜力发挥的两个主要因子是土壤侵蚀严重和投入水平低.
[本文引用: 1]
[本文引用: 1]
[本文引用: 1]
[本文引用: 1]
DOI:10.3864/j.issn.0578-1752.2019.08.010URL [本文引用: 2]
【Objective】In Qiyang County, Hunan Province which is a typical county of China, quantifying key acidity inducing factors could provide theoretical bases for combating soil acidification, and provide scientific and technological supports for red soil acidification remediation in China. 【Method】To achieve our objective, data of fertilizer rate, biomass (or yield) of main crops and trees, and above-ground nutrient contents reported within the experimental site were obtained from a large number of published literatures and statistical yearbooks. We quantified the acidity-inducing factors (nitrogen cycling process, BC (base cation) absorption and acid deposition) based on classical mass and charge balance. Relative contributions of the three key processes were used to illustrate the dominant factor of the soil acidification in uplands, paddy fields and woodlands. 【Result】For the whole county, nitrogen cycling process accounted for 66.5% (65.3% - 68.8%) of the total H + production, base absorption accounted for 33.0% (30.1%-34.4%), and acid deposition accounted for 0.5% (0.3% - 1.7%). Regardless of the land use patterns, nitrogen cycling process was the main source of H + production and main controlling factor of soil acidification. Among the three land use patterns, H + net production of upland was the highest (19.01 kmol·hm -2·a -1), followed by paddy field (16.5 kmol·hm -2·a -1), and woodland (3.2 kmol·hm -2·a -1) as the lowest. H + net production in dry farmland was about 6 times of woodland. H + net production of 6 main crop systems varies from 10.1 kmol·hm -2·a -1 to 30.0 kmol·hm -2·a -1, and followed the order: soybean>rape>peanut>rice>corn>sweet potato. Acidity production of the economic crops (rape, peanut and soybean) was generally higher than that of the grains (rice, corn, sweet potato); contribution rate of acidity-inducing of nitrogen cycling process among 6 main crop systems varied from 45.3% to 78.3%, contribution rate of acidity-inducing of base absorption varied from 21.4% to 54.2% . H + net production of 7 main woodland systems varied greatly from 1.96 kmol·hm -2·a -1 to 27.8 kmol·hm -2·a -1, and followed the order: citrus>chestnut>camellia oleifera abel>pine>fir>bamboo>slash pine. Acidity production of economic forest (citrus, chestnut and camellia oleifera abel) was generally higher than that of timber forest (pine, fir, bamboo and slash pine) ; contribution rate of acidity-inducing of nitrogen cycling process among 7 main woodland systems varied from 46.1% to 80.8%, and contribution rate of acidity-inducing of base absorption varied from 19.0% to 53.3% . The long-term field experiment combined with soil buffering curve technique was used to verify reliability of the calculation method of H + production. The simulated value of soil pH was positively correlated with the measured value significantly, with root mean square error (RMSE) of 0.15, while anastomosis degree between the two was high. 【Conclusion】 Nitrogen cycling process was the main controlling factor of red soil acidification in Qiyang County. The differences of total acidity production and contribution of acidity-inducing factors depended largely on land use patterns, crop types and tree species.
DOI:10.1126/science.1182570URLPMID:20150447 [本文引用: 1]
Soil acidification is a major problem in soils of intensive Chinese agricultural systems. We used two nationwide surveys, paired comparisons in numerous individual sites, and several long-term monitoring-field data sets to evaluate changes in soil acidity. Soil pH declined significantly (P < 0.001) from the 1980s to the 2000s in the major Chinese crop-production areas. Processes related to nitrogen cycling released 20 to 221 kilomoles of hydrogen ion (H+) per hectare per year, and base cations uptake contributed a further 15 to 20 kilomoles of H+ per hectare per year to soil acidification in four widespread cropping systems. In comparison, acid deposition (0.4 to 2.0 kilomoles of H+ per hectare per year) made a small contribution to the acidification of agricultural soils across China.
URL [本文引用: 1]
基于统计数据、农户调研数据以及公开发表的文献资料中的数据,估算了2006年中国作物秸秆及其养分资源数量,并且对其利用状况进行了详细的分析。结果表明,2006年中国作物秸秆资源数量超过7.6亿t,其中,作物秸秆氮、磷(P2O5)、钾(K2O)养分资源数量分别达到776万t、249万t、1 342万t。从作物秸秆去向来看,作物秸秆还田、秸秆饲用、秸秆燃烧以及其他去向所占比例分别为24.3%、29.9%、35.3%和10.5%。从不同利用方式下作物秸秆养分还田情况来看,2006年中国作物秸秆氮、磷(P2O5)、钾(K2O)养分还田量分别达到304.6万t、175.6万t、966.7万t,占秸秆养分资源量的比例分别为39.3%、70.5%和72.0%,这表明秸秆还田比例及其养分还田比例仍然有很大的提升空间。
[本文引用: 1]
[本文引用: 1]
[本文引用: 1]
[本文引用: 1]
DOI:10.11766/trxb200609060109URL [本文引用: 1]
Based on the results of in-situ determination using electrochemical methods,oxidation-reduction regimes of major natural soils,upland soils and paddy soils in China were systematically summarized for the first time.The natural soils and upland soils belonged to the category of oxidizing soil,with Eh in the range of 440~730 mV,and content of reducing substances equal to 0.00~4.01×10⁻⁵mol L-1 of Mn2+,and remained basically oxidizing within a year,oxygen being the Eh-determinging factor and quite weak in transformation and translocation of materials in the soils,while the paddy soils ranged between 670~-70 mV in Eh,with the content of reducing substances equal to 0.01~17.8×10⁻⁵mol L-1 of Mn2+,and reducing substances being the Eh-determining role.And their material transformation/translocation intensity and speed was far greater than that in the natural soils and upland soils.In terms of oxidation-reduction regime varying periodically with water regime,paddy soils could be divided into three types,i.e.oxidizing,oxidizing-reducing and reducing.Soil oxidation-reduction regime is characterized by close correlation between Eh and content of reducing substances,spatial and horizontal variation,heterogeneity, wider range of variation and high reversibility.Determination in situ with electrochemical methods has paved a way to research of oxidation-reduction properties of weakly reducing soils.
[本文引用: 3]
[本文引用: 3]
DOI:10.11766/trxb200212080611URL [本文引用: 2]
In the present study, changes in soil physical, chemical and biological properties in paddy fields of a cultivation chronosequence were observed by field sampling in a typical red soil region in subtropical China, Jiangxi Province.After cultivation, clay (< 0.002 mm) content decreased from 39% of the orig-i nal uncultivated wasteland to 17% of the 80 a paddy field, while silt (0.02~0.002 mm) content increased.Soil pH increased generally by 0.5~1 units, the 0~10 cm soil organic C and total N contents increased respectively from 4.58 g kg-1 and 0.39 g kg-1 of the original to 19.6 g kg-1 and 1.62 g kg-1 of the 30 a paddy field, and then remained stable.With 3 a cultivation for paddy field, total P content increased from 0.5 g kg-1 to 1.3 g kg-1, which suggested that fertilizer application can accelerate phosphorous accumulation in paddy field.0~10 cm soil total K content showed a decrease by 80% with a 80 a cult ivation.Total Fe and free Fe contents also showed a decreasing tendency.Bacterial population in-creased and urease activity intensified obviously.In this chronosequence it appeared that it took 30 year to raise fertility to a relatively constant value, seen after 80 a cultivation.
[本文引用: 1]
