 ,, ����, ����,, ���廪,, ������, �Ӽ̳��й�ũҵ��ѧԺ�����о���/ũҵũ�岿������������Դ�����ص�ʵ����,�����˳� 125100
Genetic Relationship and Structure Analysis of 15 Species of Malus Mill. Based on SNP Markers
GAO Yuan,, WANG DaJiang, WANG Kun,, CONG PeiHua,, LI LianWen, PIAO JiChengInstitute of Pomology, Chinese Academy of Agricultural Sciences/Key Laboratory of Horticultural Crops Germplasm Resources Utilization, Ministry of Agriculture and Rural Affairs of the People��s Republic of China, Xingcheng 125100, LiaoningͨѶ����:
���α༭: ������
�ո�����:2019-12-30��������:2020-06-10�����������:2020-08-16
| ��������: |
Received:2019-12-30Accepted:2020-06-10Online:2020-08-16
����� About authors
��Դ,E-mail��

ժҪ
�ؼ��ʣ�
Abstract
Keywords��
PDF (1608KB)Ԫ������ά�����������������EndNote|Ris|Bibtex�ղر���
�������ø�ʽ
��Դ, ����, ����, ���廪, ������, �Ӽ̳�. ���ڸ��ܶ�SNP��ǵ�ƻ����15��ֲ����Դ����Ե��ϵ���Ŵ��ṹ����[J]. �й�ũҵ��ѧ, 2020, 53(16): 3333-3343 doi:10.3864/j.issn.0578-1752.2020.16.011
GAO Yuan, WANG DaJiang, WANG Kun, CONG PeiHua, LI LianWen, PIAO JiCheng.
0 ����
���о����塿ƻ������Malus Mill.��ΪǾޱ�ƣ�Rosaceae��ֲ��,����ƻ����ֲ����ԴԼ35����[1,2],��Ҫ�ֲ��ڱ��´�,���ŷ�Ǵ�½�ͱ�����;��ԭ���й�����27����,����Ұ����Ե��21�֡�������6��[3]���о�����ƻ����ֲ�ﲻͬ�ֵ��Ŵ��ṹ,̽�����Ŵ�������,�ǽ�ʾ���ֵĽ�����ʷ[4,5]�����������DZ����δ������[6]��̽������ϡ�л��Σԭ��[7,8]����Ҫ����,���ƶ�������Դ�������ԡ�ָ������������Դɸѡ�������������ھ������Ҫ���塣��ǰ���о���չ�����ӱ���ǽ�ʾ��ͬƷ�ּ��Ŵ������Ժ���Ե��ϵ����Ч�ֶ�[9],RAPD[10]��AFLP[11]�ȷ��ӱ����������ƻ�����Ŵ������Է���,SSR���ӱ�DZ���Ϊ�Ƕ�ֲ��������Ҫ�ı��֮һ[12],��ƻ���Ŵ��������о���Ӧ����Ϊ�㷺[13]��SNP�����������̬��,���ɵ�����������������DNA���ж�̬��,SNP�����Ŀǰ����DNA���ӱ���ж�������Ϊ�ḻ�ı�ǡ��о�SNP��ס��ȷ�ķ�����Ϊֱ�Ӳⶨij�ض�����ĺ���������,����ջ������ж�Ӧ����ĺ��������н��бȽ�,�Ӷ��������ж�̬�Եĵ�����������졣SNP�����ͼ����Ѿ���Ӧ�õ�����������Ŵ��ṹ�������Ŵ����������ۺ��Ŵ�����ͼ�Ĺ���[14,15]��CHAGNE��[16]����EST-SNP��ǵķ�����ƻ������������о����ִ��������ķ�չ,ƻ��ȫ�������������,����SNP��ƻ���о��е�Ӧ�þ�����Ҫ���ƶ����á�MICHELETTI��[17]��27��ƻ�������ʽ��в���,��ɸѡ��237��SNP����о�260��ƻ��Ʒ�ֵ��Ŵ������Բ������Ŵ�����ͼ�ס���Դ����[18]��SUN��[19]������[20]�ֱ�SNP���ӱ�ǵķ�������ƻ�����κ�ʵƷ����ػ���������������QTL��λ����,����ɭ[21]����SNP��ǹ�����ƻ���Ŵ�ͼ�ס�����ƻ���ο�������ķ���[22,23,24],����ִ�������,��������ȫ�����鷶Χ��Ѱ�Ҷ�̬��SNP���ӱ������ƻ����ֲ��������Դ�Ŵ��������о�,�����䱣������þ�����Ҫ����[25]��SLAF-seq��Specific Locus Amplified Fragment Sequencing����һ�ָ�ͨ���ļ�������Ȳ�����,ͨ��������Ϣѧ�������������鷽��,�ڲ����ú��������Գ��ȵ�DNAƬ�Σ�SLAF��ǩ��������,��ȫ�����鷶Χ����������������SNP��ǡ����Ѿ���Ӧ�õ���������,��ˮ��[26]������[27]����[28]������[29]�ȵ�SNP��ǿ�����,�պ�ϼ[30]����SLAF��������SNP����ƻ���Ŵ�����ͼ�ס������о�����㡿���Ž�Щ�����ƻ����Դ��ƻ����ֲ��������Դ�ռ��ͱ��湤���IJ�������,����ƻ����Դ�Ա����˴�����������ƻ����ֲ��������Դ,����SLAF-seq�����ϴ�ȫ�����鿪��SNP����о�ƻ����ֲ�ﲻͬ�ֵ���Ե��ϵ���Ŵ��ṹ���������Ĺؼ����⡿���о��ڶԹ���ƻ��������Դ�Ա����15���ֵ�427��ƻ����ֲ��������Դ���и�ͨ����������������,����SNP���,����15��ƻ����ֲ�����ں��ּ����Ե��ϵ���Ŵ��ṹ,̽�ֲ�ͬ�ּ��ϵͳ�ݻ���ϵ,Ϊ��ͬ��ƻ����ֲ��ļ��������Լ���һ���ռ��ͱ����ṩ���ݡ�1 �����뷽��
1.1 ����
427��ƻ�����ʲ�������25��ȡ�Թ��ҹ������ʹ����뺮�ع����ԣ�����ʡ�����룩,1�ݵ�غ��ĺ�1�ݲ�����ȡ�Թ��ҹ��������������й�������ľ�ԣ�����ʡ������,����400�ݲ��Ͼ�ȡ�Թ��ҹ��������˳��桢ƻ���ԣ�����ʡ�˳��У���427�����ʷ�����ƻ������15����,���Ը������Ƽ�������Դ����1����2017�괺���ɼ���������ҶƬ,ҶƬ���轺����֮���á�Table 1
��1
��1����SLAF���������15����ƻ����ֲ��������Դ
Table 1
| ��� Code | ������ Species | ��Դ�� Origin | ���� Number | ��� Code | ������ Species | ��Դ�� Origin | ���� Number | |
|---|---|---|---|---|---|---|---|---|
| 1 | �½�Ұƻ�� Malus sieversii | �½� Xinjiang | 161 | 5 | ���� Malus asiatica | ������ Heilongjiang | 7 | |
| 2 | �й�ƻ�� Malus domestica subsp.chinensis | �½� Xinjiang | 2 | ���� Gansu | 1 | |||
| ������ Heilongjiang | 2 | �ӱ� Hebei | 9 | |||||
| ���� Gansu | 4 | ���� Yunnan | 1 | |||||
| �ӱ� Hebei | 14 | 6 | ���⺣�� Malus robusta | �ӱ� Hebei | 32 | |||
| ɽ�� Shanxi | 10 | ɽ�� Shanxi | 1 | |||||
| ɽ�� Shandong | 1 | ���� Jilin | 1 | |||||
| 3 | ɽ���� Malus baccata | ������ Heilongjiang | 47 | 7 | ¤������ Malus kansuensis | ���� Gansu | 4 | |
| ���� Gansu | 3 | 8 | ��˿���� Malus halliana | ���� Gansu | 9 | |||
| �ӱ� Hebei | 10 | 9 | ɽ髺��� Malus komarovii | ���� Jilin | 1 | |||
| ɽ�� Shanxi | 14 | 10 | ��Ҷ���� Malus toringoides | �Ĵ� Sichuan | 2 | |||
| ���ɹ� Inner Mongolia | 41 | ���� Yunnan | 1 | |||||
| ���� Jilin | 19 | 11 | ��Ҷ���� Malus transitoria | �Ĵ� Sichuan | 1 | |||
| 4 | ��� Malus prunifolia | ������ Heilongjiang | 5 | 12 | ����ɽ���� Malus rockii | ���� Yunnan | 1 | |
| ���� Gansu | 4 | 13 | ��غ��� Malus yunnanensis | ���� Yunnan | 1 | |||
| �ӱ� Hebei | 2 | 14 | �������� Malus hupehensis | ���� Yunnan | 1 | |||
| ɽ�� Shanxi | 8 | 15 | ������ Malus ombrophila | ���� Yunnan | 1 | |||
| ���ɹ� Inner Mongolia | 1 | |||||||
| ���� Jilin | 5 |
�´��ڴ�|����CSV
1.2 ������DNA����ȡ
���õ¹�QIAGEN��DNeasy Plant Mini Kit��ȡ���Բ��ϴ�����Ҷ�Ļ�����DNA���ֱ���1%����֬��������Ӿ�ͳ�������ֹ��ȼƣ�����DeNovix,DS-11�ͣ������Ũ�Ⱥʹ���,���զ�DNA��40 ng����L-1������ȡ�������DNAŨ�ȵ�����100 ng����L-1,-20�汣�汸�á�1.3 ø��Ԥ��
��2010���Ѿ�������ƻ����������Ϊ�ο����������ø��Ԥ�⡣�ο���������Ϣ��ƻ����Malus pumila Mill.��������[22]��http://www.ncbi.nlm.nih. gov/genome/?term=apple��,��װ���Ļ������СΪ1 874.77 Mb,GC����Ϊ45.32%������SLAF-predict����,ͨ��ƻ����������з���Ԥ��,ȷ��ø����ϲ�����ø�С�1.4 �������ݿ���
�����ø��Ƭ�ε�3��˽��м�A����,�ڼ���polyA��ø��Ƭ�������Ӳ����ͷ,����PCR�������н�����Ŀ��Ƭ��,�����Ŀ⡣��Illumina HiSeqTM2500������Illumina��˾,HiSeq 2500�ͣ��϶Լ���ϸ���Ŀ���в���,����������ȥ��ͷ���������Ķ������Ⱦ��������øɾ����м�SLAF��ǩ���������������е�GC������Q30ָ��,��������������ڲ�ͬ��Ʒ���в����SLAF��ǩ��Ϊ��̬��SLAF��ǩ��ͨ��BWA����[31]��SLAF��ǩ��ƻ���ο�������[22]�Լ��ڲ�ͬ��Ʒ����бȶ�,���䶨λ���ο��������ϻ�ö�̬�Ե�SLAF��ǩ������GATK[32]��SAMtools[33]���ַ����ڶ�̬��SLAF�п���SNP,ɸѡ���ַ�����ͬ�õ���SNP��Ϊ������SNP������ݼ�������������>0.94,��Ҫ��λ����Ƶ�ʣ�MAF��>0.05����[34],ɸѡ��̬�Ե�SNP,���ڽ�һ��������ͳ�ƺͷ�����1.5 Ⱥ���Ŵ��ṹ����Ե��ϵ����
����ɸѡ�Ķ�̬��SNP,ʹ��MEGA 7[35]��NJ��neighbor-joining���㷨[36],����ƻ������ͬ�ֵ�ϵͳ����������ͬ�ּ���Ŵ������С��ϵͳ�������ķ�֧��������,����Խ�̼�������������֮�����Ե��ϵԽ��������Admixture����[37]����Ⱥ���Ŵ��ṹ����,������Ʒ�ķ�Ⱥ����K��Ϊ1��15���о���,���ݽ�����֤������ȷ����Ⱥ����2 ���
2.1 ����Ͳ�����������
����SLAF-predict����,����2010��ƻ�����������ø��Ԥ��,ȷ��ѡ��Rsa I+Hae IIIø��Ͻ���ø��,ɸѡSLAF��ǩ���ȷ�ΧΪ314��414 bp,��Ԥ�151 808��SLAF��ǩ,SLAF��ǩ�ڻ������ϻ����ֲ����ȡ���ˮ���IJ������ݣ�http://rapdb.dna. affrc.go.jp/��Ϊ���ս�һ������ø�е���Ч�Ժ�ø��Ч��,��ˮ���IJ���������ƻ���ο���������бȶ�,˫�˱ȶ�Ч��Ϊ95.19%,ø��Ч��Ϊ92.79%,ø�з�Ӧ����,SLAF���������������й���ƻ����ֲ�����ʲ����1 276.7 Mb�Ķ�������,��������Ʒ��õĶ�����Ŀ��1 189 223��1 968 102 bp,����ƽ��Q30Ϊ91.58%,���в�����Ʒ��Q30ֵ����80%����;ƽ��GC����Ϊ40.04%,GC�����ձ�ϵ͡������������齨��ȷ�Ե�ˮ��������0.45 Mb���������������ļ�������ʵ�,�������ݴﵽҪ��2.2 SLAF��ǩ���̬��SNP���ɸѡ
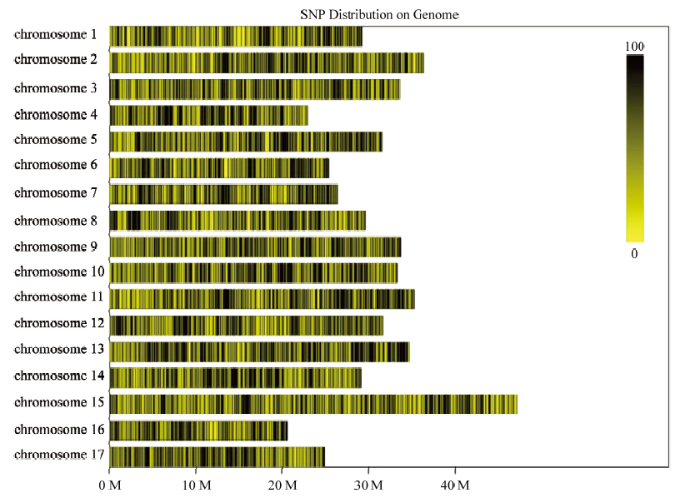
��427��ƻ����ֲ�����ʲ�����586 454��SLAF��ǩ,ƽ���������Ϊ6.42 X��ͨ��BWA�����ȶԻ��463 612����̬��SLAF��ǩ,����5 896 021��Ⱥ��SNP,����������>0.94��MAF>0.05����,���õ�46 460����̬��SNPλ��,���ں�����Ⱥ��ṹ����������ɸѡ�Ķ�̬��SNP��Ⱦɫ���ϵķֲ�,���ƶ�̬�Ե�SNP��Ⱦɫ���ϵķֲ�ͼ��ͼ1����ͼ1
 �´��ڴ�|����ԭͼZIP|����PPT
ͼ1��̬�Ե�SNP��Ⱦɫ���ϵķֲ�
ÿһ����ɫ��������һ��Ⱦɫ��,���ߴ�����̬��SNP��λ��λ��;������ΪȾɫ�峤��,����1 M�Ĵ�С�Ի�������л��֡���ɫԽ�����SNP�����Խ��,��ɫԽ�������SNP��Ǽ��зֲ�������
Fig. 1The distribution of polymorphic SNP in 17 chromosomes
Every yellow band indicated one chromosome, and black line indicated the position of SNP. The abscissa is the length of the chromosome, and the genome was divided by every 1M. The darker position represented more SNPs, and the darker regions showed the centralized distribution area of SNPs
2.3 ����SNP��ǵ�ƻ����ֲ����Ե��ϵ����
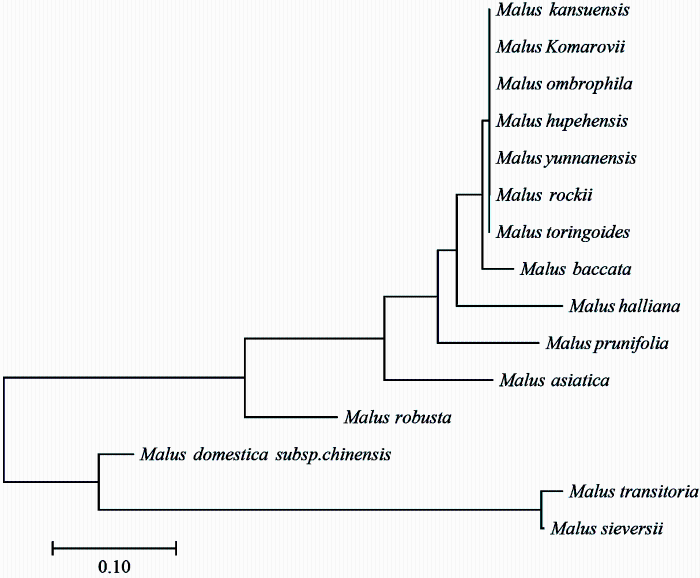
��ÿ������Ϊһ����Ⱥ,����ÿ����Ⱥ��SNP�����MEGA7����ƻ�������ּ���Ŵ����루��2����ƻ����ֲ�������ּ���Ŵ�����Ϊ0��1.000,���л�Ҷ�������Ҷ���ġ�����ɽ���ӡ���غ��ġ��������ġ������ġ�¤�����ĺ�ɽ髺��ļ���Ŵ������Ϊ1.000;��Ҷ������������ġ���غ��ġ������ġ�¤�����ġ�����ɽ���Ӻ�ɽ髺��ļ���Ŵ������Ϊ0.000;����ɽ�������غ��ġ��������ġ������ġ�¤�����ĺ�ɽ髺��ļ���Ŵ������Ϊ0.000;��غ�����������ġ�������,¤�����ĺ�ɽ髺��ļ���Ŵ������Ϊ0.000,��������������ġ�¤�����ĺ�ɽ髺��ļ���Ŵ������Ϊ0.000;��������¤�����ĺ�ɽ髺���,¤�����ĺ�ɽ髺��ļ���Ŵ������Ϊ0.000�����ּ��Ŵ�������15���ֵ�ϵͳ��������ͼ2��,15�������Է�Ϊ4����Ⱥ,��Ⱥ��Ϊ¤�����ġ�ɽ髺��ġ���غ��ġ������ġ��������ġ�����ɽ���Ӻͱ�Ҷ����,��Ⱥ��Ϊɽ����,��Ⱥ��Ϊ��˿���ġ���ӡ�����Ͱ��⺣��,��Ⱥ��Ϊ�й�ƻ�����½�Ұƻ���ͻ�Ҷ���ġ�Table 2
��2
��2����SNP��ƻ����ֲ��15���ּ���Ŵ�����
Table 2
| 1 | 2 | 3 | 4 | 5 | 6 | 7 | 8 | 9 | 10 | 11 | 12 | 13 | 14 | 15 | |
|---|---|---|---|---|---|---|---|---|---|---|---|---|---|---|---|
| 1 | 0.000 | ||||||||||||||
| 2 | 0.030 | 0.000 | |||||||||||||
| 3 | 0.970 | 1.000 | 0.000 | ||||||||||||
| 4 | 0.600 | 0.606 | 0.394 | 0.000 | |||||||||||
| 5 | 0.030 | 0.000 | 1.000 | 0.606 | 0.000 | ||||||||||
| 6 | 0.030 | 0.000 | 1.000 | 0.606 | 0.000 | 0.000 | |||||||||
| 7 | 0.030 | 0.000 | 1.000 | 0.606 | 0.000 | 0.000 | 0.000 | ||||||||
| 8 | 0.187 | 0.167 | 0.833 | 0.571 | 0.167 | 0.167 | 0.167 | 0.000 | |||||||
| 9 | 0.030 | 0.000 | 1.000 | 0.606 | 0.000 | 0.000 | 0.000 | 0.167 | 0.000 | ||||||
| 10 | 0.953 | 0.981 | 0.019 | 0.398 | 0.981 | 0.981 | 0.981 | 0.821 | 0.981 | 0.000 | |||||
| 11 | 0.143 | 0.120 | 0.880 | 0.581 | 0.120 | 0.120 | 0.120 | 0.247 | 0.120 | 0.866 | 0.000 | ||||
| 12 | 0.030 | 0.000 | 1.000 | 0.606 | 0.000 | 0.000 | 0.000 | 0.167 | 0.000 | 0.981 | 0.120 | 0.000 | |||
| 13 | 0.134 | 0.111 | 0.889 | 0.582 | 0.111 | 0.111 | 0.111 | 0.241 | 0.111 | 0.874 | 0.204 | 0.111 | 0.000 | ||
| 14 | 0.279 | 0.265 | 0.735 | 0.550 | 0.265 | 0.265 | 0.265 | 0.343 | 0.265 | 0.727 | 0.321 | 0.265 | 0.317 | 0.000 | |
| 15 | 0.030 | 0.000 | 1.000 | 0.606 | 0.000 | 0.000 | 0.000 | 0.167 | 0.000 | 0.981 | 0.120 | 0.000 | 0.111 | 0.265 | 0.000 |
�´��ڴ�|����CSV
ͼ2
 �´��ڴ�|����ԭͼZIP|����PPT
ͼ2����SNPλ���ƻ����15���ֵĽ�����
Fig. 2Polygenetic tree of 15 species of Malus Mill. based on SNP
2.4 ����SNP��ǵ�ƻ����ֲ����Ŵ��ṹ����
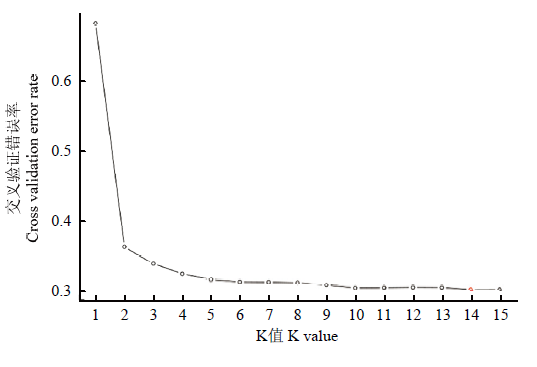
Ⱥ���Ŵ��ṹ�����ܹ���ø����Ѫͳ��Դ���������Ϣ,���Ŵ���ϵ������һ����Ҫ�ֶΡ�����Admixture����,����427��ƻ����ֲ�����ʻ��ڶ�̬��SNP���Ŵ��ṹ���ֱ����427�����ʵķ�Ⱥ����Kֵ��Ϊ1��15��ͼ3��,���о��ࡣ���ݽ�����֤������,��K=5��ʱ��,������֤�����������Խ���,Ӧ��Ϊȷ����Ⱥ����һ���ؼ���,����ȷ�����й���ƻ����ֲ��ķ�Ⱥ��Ϊ5,������5�����ܵ�ԭʼ���ȡ����Ž�һ���ķֻ�,��K=14ʱ,������֤��������С,���ȷ����ѷ�Ⱥ��Ϊ14,��ӳ����Щƻ����ֲ�����ʷֻ������������14�����ȡ���K=1��14��Ⱥ���Ŵ��ṹ������ͼ4��ͼ3
 �´��ڴ�|����ԭͼZIP|����PPT
ͼ3ÿ��Kֵ��Ӧ�Ľ�����֤������
Fig. 3Cross validation error rates corresponding to every K values
ͼ4
 �´��ڴ�|����ԭͼZIP|����PPT
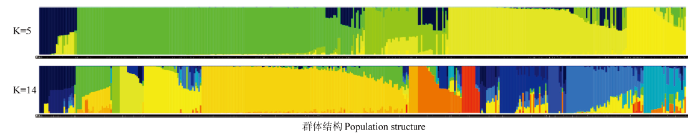
ͼ4427��15��ƻ����ֲ������Ⱥ���Ŵ��ṹ��K=5��K=14��
ÿ��������
Fig. 4The genetic structure of 427 accessions of 15 species of Malus Mill. (K=5 and K=14)
Each bar represents one accession, and the abscissa is the code of germplasms corresponding to each bar. One color represents one group, and the ordinate is Q value 0.00-1.00
��ȷ����Ⱥ��Ϊ5ʱ,��Ⱥ�����25������,��3�ݱ�Ҷ���ġ�3�ݴ�˿���ġ�1������ɽ���ӡ�1���½�Ұƻ����17��ɽ����,������7��ɽ���ӵ�QֵΪ1.000,��7��ɽ���Ӵ�������Ⱥ�Ļ���⣨��ɫ����⣩����Ⱥ�����190������,��1�ݰ��⺣�ġ�1�ݴ�˿���ġ�4�ݻ��졢5����ӡ�1��ɽ���ӡ�20���й�ƻ����158���½�Ұƻ��,������63���½�Ұƻ����1���й�ƻ�����½�����QֵΪ1.000,��63���½�Ұƻ����1���й�ƻ����������Ⱥ��Ļ���⣨��ɫ����⣩����Ⱥ�����55������,��3�ݰ��⺣�ġ�1�ݲ����ġ�2�ݴ�˿���ġ�1�ݵ�غ��ġ�12�ݻ��졢1�ݻ�Ҷ���ġ�4��¤�����ġ�16����ӡ�4��ɽ���ӡ�1��ɽ髺��ĺ�10���й�ƻ��,������1�ݰ��⺣�ġ�1�ݻ��졢1��ɽ���ӡ�1���й�ƻ����1����ӵ�QֵΪ1.000,��5�ݲ��ϴ����˸���Ⱥ�Ļ���⣨����ɫ����⣩����Ⱥ������119������,��2�ݰ��⺣�ġ�3�ݴ�˿���ġ�1�ݺ������ġ�2����ӡ�2���½�Ұƻ����2���й�ƻ����107��ɽ����,������26��ɽ���ӵ�QֵΪ1.000,26��ɽ���Ӵ����˸���Ⱥ�Ļ���⣨��ɫ����⣩����Ⱥ������39������,��28�ݰ��⺣�ġ�3�ݻ��졢2����ӡ�4��ɽ���Ӻ�1���й�ƻ��,����16�ݰ��⺣�ĺ�1����ӵ�QֵΪ1.000,��17�����ʴ����˸���Ⱥ�Ļ���⣨dz��ɫ����⣩��
��ȷ����Ⱥ��Ϊ14ʱ,��Ⱥ1����24������,��14�ݰ��⺣�ġ�3�ݻ��졢1����ӡ�1��ɽ���Ӻ�5���й�ƻ��,������3���й�ƻ������ƻ������QֵΪ0.9999,������˸���Ⱥ�Ļ���⣨����ɫ����⣩����Ⱥ2����37������,��1����ӡ�1���й�ƻ����35���½�Ұƻ��,������2���½�Ұƻ����QֵΪ0.9999,������˸���Ⱥ�Ļ���⣨��ɫ����⣩����Ⱥ3����5������,ȫ��Ϊɽ����,��ȫ��Ϊ���ɹ��ռ���ɽ����,��Qֵȫ��Ϊ0.9999,������˸���Ⱥ�Ļ���⣨dz��ɫ����⣩����Ⱥ4����16������,��10���й�ƻ����2�ݻ��졢2����ӡ�1�ݰ��⺣�ĺ�1�ݴ�˿����,������5���й�ƻ����2����ƻ����3�����ӣ���QֵΪ0.9999,������˸���Ⱥ�Ļ���⣨dz��ɫ����⣩����Ⱥ5����38������,��1���й�ƻ��,����ȫ��Ϊɽ����,������6��ɽ���ӵ�QֵΪ0.9999,��6��ɽ����ȫ��Ϊ���ɹ��ռ�����ɽ����,������˸���Ⱥ�Ļ���⣨��ɫ����⣩����Ⱥ6����124������,��4���й�ƻ����1��ɽ���Ӻ�2�������,����ȫ��Ϊ�½�Ұƻ��,����11���½�Ұƻ����QֵΪ0.9999,������˸���Ⱥ�Ļ���⣨���ɫ����⣩����Ⱥ7������6������,ȫ��Ϊ�½�Ұƻ��,��Qֵȫ��Ϊ0.9999,����ȺΪ���½�Ұƻ��ȫ����������Ⱥ������ɫ����⣩����Ⱥ8����28������,��2�ݻ��졢4��ɽ���ӡ�8���й�ƻ����3�ݴ�˿���ġ�8����Ӻ�3�ݰ��⺣��,������1���й�ƻ����1��ɽ���ӡ�1�ݻ��졢1����Ӻ�2�ݰ��⺣�ĵ�QֵΪ0.9999,������˸���Ⱥ����⣨��ɫ����⣩����Ⱥ9����12������,��4��¤�����ġ�1�ݵ�غ��ġ�1�ݲ����ġ�1��ɽ髺��ġ�1�ݻ�Ҷ���ġ�3�ݱ�Ҷ���ĺ�1�����,���г�3�ݱ�Ҷ�������9�����ʵ�Qֵȫ��Ϊ0.9999,�����˸���Ⱥ�Ļ���⣨��ɫ����⣩����Ⱥ10����13������,��4�ݰ��⺣�ĺ�9��ɽ����,����ռ�����ص�Ϊ����ɫ�����,��������ɫ����������,ȫ��Ϊ���ֻ������ӵ����ʡ���Ⱥ11����32������,��1������ɽ���ӡ�1�ݻ��졢1���й�ƻ����4�ݴ�˿���ġ�2���½�Ұƻ����23��ɽ����,������9��ɽ���Ӻ�1�ݴ�˿���ĵ�QֵΪ0.9999,9��ɽ������Դ�ں����������ɹ�,������˸���Ⱥ�Ļ���⣨��ɫ����⣩����Ⱥ12����12������,��1����Ӻ�11�ݰ��⺣�����,������7�ݰ��⺣�ĵ�QֵΪ0.9999,������˸���Ⱥ�Ļ���⣨dz��ɫ����⣩����Ⱥ13����51������,��1�ݴ�˿���ġ�1�ݺ������ġ�1�ݰ��⺣�ġ�1���½�Ұƻ����3�������,����ȫ��Ϊɽ����,������5��ɽ���ӵ�QֵΪ0.9999,������˸���Ⱥ�Ļ���⣨����ɫ����⣩����Ⱥ14����28������,��10�ݻ��졢9��ɽ���ӡ�3���й�ƻ����6��������,����2����ӡ�2�ݻ����1���й�ƻ����Qֵ��0.9999,������˸���Ⱥ�Ļ���⣨����ɫ����⣩��ֻ��һ����������һ����������Ⱥ����Ⱥ1����Ⱥ2����Ⱥ3����Ⱥ4����Ⱥ5����Ⱥ6����Ⱥ11����Ⱥ12����Ⱥ13,�����ֱַ�Ϊ�й�ƻ������ƻ�������½�Ұƻ����ɽ���ӣ����ɹţ����й�ƻ������ƻ�������ӣ���ɽ���ӣ����ɹţ����½�Ұƻ����ɽ���ӣ������������ɹţ������⺣�ġ�ɽ���ӣ�����������
3 ����
SNP����ͨ���ɵ��������������滻����СƬ�εIJ����ȱʧ����[38],�������е��������ת�������������ȱʧ�Լ�СƬ�εIJ���ȱʧ��InDel�����������SNP����ֱ�������ڱ�����,λ�ڻ���ķDZ�����,��ȴ�ܹ�����Ⱥ�����Ŵ������������ϵ,����Ϊ�Ŵ���Ƕ�Ӧ���ڶ�ֲ���Ⱥ���Ŵ���ϵ�ͽ����о�[39,40]���ڶ�ֲ���о����������Ӧ��,�����Ӭ��С��[41]�ȶ����Լ����Ͻ�[42]��ˮ��[43]��С��[44]��ֲ�SLAF�������ķ�չ�ٽ���SNP����ڶ���ֲ���������Դ������ϵͳ�������Ŵ������Լ���״���������е��о�,��������[45]��С��[46]����[47]������[48]����[49]������[50]�ȡ����о���SLAF����Ļ���֮�Ͽ�����46 460����̬�Ե�SNP���,������15��ƻ����ֲ�����Ե��ϵ���Ŵ��ṹ,̽�ֲ�ͬ�ּ�����ڵ�ϵͳ�ݻ���ϵ��������Ⱥ���Ŵ������ϵͳ���������Լ�Ⱥ���Ŵ��ṹ����������,15��ƻ����ֲ���Ϊ4����������Ⱥ,�����ּ��Ŵ��������ϵͳ��������ʱ,��Ҷ�������½�Ұƻ�����Ŵ�����ֻ��0.019,��Ⱥ���Ŵ��ṹ�ķ����������ƫ��,�п����ǹ��Ե�15������������Ϊ��Ⱥ����ʱ,����Ⱥ�ڸ�����������ϴ���ɵķ����������ƫ�
ƻ����ֲ����Ŵ��ṹ������,��K=5��K=14���ַ�Ⱥ�����,¤�����ġ���Ҷ���ġ���Ҷ���ġ���غ��ġ������ĺ�ɽ髺��ľ���ͬһ��Ⱥ��,������Դ�ͱ������ơ�6��Ұ������,��ɽ髺�����Ҫ�ֲ����й�����ʡ����ɽ����,����5�������й������ϵ�������Ұ���ֲ���¤�����ġ���Ҷ���ġ���Ҷ���ĺ�ɽ髺���ҶƬ�����ѿ�,ֻ���ѿ̵���dz��һ����6��ƻ����ֲ���Ұ���ֿ��ܾ������Ƶ���Դ��,�����ݻ����������ַֻ���
��K=5ʱ,��Ⱥ2����Ⱥ3���й�ƻ���о���������ɽ���Ӵ����Ĵ�����⣨��ɫ����⣩����,������Ⱥ�и���1���й�ƻ�����ʾ��и���Ⱥ�Ĵ������,��Ⱥ3���й�ƻ�����м��������½�Ұƻ��������,���⺣�ľ��д��Ļ����,�����Ŵ��ṹ�е����ñ�ͻ�Գ������½�Ұƻ����ɽ���Ӷ��бȽϴ��Ļ����,�й�ƻ���Ļ���ȫ�������½�Ұƻ��,����ɽ���ӻ���ļ���,���������ֵĹ�ϵ���С�
��K=14ʱ��Ⱥ���Ŵ��ṹ��������,�й�ԭ��ƻ����ֲ����9���Ƚϴ���ͬԴ�����,������2��Ϊ�й�ƻ����ͬԴ�����,2��Ϊ�½�Ұƻ����ͬԴ�����,3��Ϊɽ���ӵ�ͬԴ�����,�й�ƻ���еIJ�����ƻ�������ӡ��½�Ұƻ�������ɹźͺ�������ɽ���ӡ����⺣�Ĵ����˽�Ϊԭʼ�Ļ�����Դ�������й�ƻ�������������½�Ұƻ����ɽ���ӵĻ���,�ٴ�֤�������й�ƻ������Դ�ݻ����������½�Ұƻ����ɽ���ӵIJ���,����DUAN��[51]�Ľ���һ�¡����й�ƻ���л���һ������ƻ������Ҫָ��ƻ�������ӿ��Զ���������Ⱥ�����,�������в�û���½�Ұƻ���IJ���,��������Ⱥ��ɽ�����Լ�ƻ����ֲ��������ֻ��졢��ӺͰ��⺣��������ء����졢��ӺͰ��⺣����ɽ���ӵ���Ե��ϵ����,��ƻ����ֲ������Ұ����֮�����Ե��ϵҲ�������½�Ұƻ������Ե��ϵ������������ũ[3]������,�й�ƻ����Դ���½�Ұƻ��,���й��н�2 000���������ʷ,����Ϊ������ƻ������Malus domestica Borkh.�������й�֮ǰ���й�������,�롰����ƻ�������Ų�ͬ����Դ���ݻ����̡������������������ԭ��,һ�ǰ���CAO��[52]������,�����������SNP��̬�Ե�Ѹ�ٽ��͡����ƻ����ֲ���������й�ƻ����Դ���½�Ұƻ��,�ڴ��½�Ұƻ�����й�ƻ�����ݻ�������,������Ϊ������ʹSNP��̬��Ѹ�ٽ���,ȡ����֮�����������λ�������ƻ���������ֶ�����ɵ�Ӱ��;�����й�ƻ���в������ͱ�������Ҳ��һ����Դ��,����Դ�ݻ��������½�Ұƻ�����ܲ�����ء��˴ι��Ե��й�ƻ���������Դ���й��Ļ�������,��Դ�ڷ������ԡ���������ɽ�»���ũ��Ժ,���½�Ұƻ��ԭʼ���зֲ��������Զ����ʹ�����������ȶ��½�Ұƻ�����й�ƻ����ѱ��������һ��Ӱ��,Ҳ������ʹ�½�Ұƻ�������ڲ��ֹ��Ե��й�ƻ���м�����ȫ��ʧ�����,�й�ƻ�����½�Ұƻ������Դ�ݻ���ϵ�д��ڽ�һ�����������Ų������ķ�չ,ȫ�����ز���ɱ��Ľ���,ȫ�����鷶Χ��ȱʧ��SNP����ھ�Ϊ����о��ṩ�����֤�ݡ�
4 ����
����SLAF���������ھ�ȫ�������46 460����̬��SNP���,��427��15���й�ԭ��ƻ����ֲ�����ں��ּ����Ե��ϵ���Ŵ��ṹ�����о���15��ƻ����ֲ���Ϊ4����������Ⱥ,һ��ɽ������Ⱥ,�����½�Ұƻ���������й�ƻ����Ⱥ,���DZ�Ҷ���ġ���Ҷ���ġ�¤�����ġ�ɽ髺��ġ���غ��ĺͲ�������Ⱥ,����4��ƻ����ֲ���������й�ƻ�������⺣�ġ�����������Ⱥ���й�ԭ��ƻ����ֲ���������й�ƻ���в������ʵ���Դ�ݻ�������ɽ���Ӻ��½�Ұƻ���IJ���,�й�ƻ�������������ֵ���Ե��ϵ����,�����½�Ұƻ������Դ�ݻ���ϵ�д���һ���������ο����� ԭ��˳��
������ȵ���
������������
�����ڿ�Ӱ������
[��������: 1]
[��������: 1]
[��������: 1]
[��������: 1]
[��������: 2]
[��������: 2]
[��������: 1]
[��������: 1]
[��������: 1]
URL [��������: 1]

Adiantum reniforme var. sinense is an economically important plant species endemic to China. It is only found in a few regions of the Chongqing Municipal Region. For decades, its distribution has been shrinking as a result of over-exploitation, which has caused endangerment of this species. To assist in efforts to effectively conserve this species, we investigated the genetic variation of six natural populations using isoelectric focusing in thin-layer polyacrylamide slab gels. Fourteen loci of five enzyme systems were detected, of which seven were polymorphic. The mean number of effective alleles per locus (Ae) = 1.778, the percentage of polymorphic loci (P) = 0.441, the mean expected heterozygosity (He)= 0.199�� and the mean observed heterozygosity (Ho)= 0.235. The results revealed that low levels of genetic diversity existed within the natural populations of A. reniforme var. sinense in comparison with other species of ferns. Only 1.49% of the genetic variation occurred among populations whereas 98.51% existed within populations, suggesting a very low genetic divergence among the populations. The equilibrium state of the populations was measured using Hardy-Weinberg equilibrium and the Fixation Index (F). The results showed that a mixed mating system was possibly the main heterogamy of this species, and its endangerment was caused by over��exploitation and habitat loss.
URL [��������: 1]
Adiantum reniforme var. sinense is an economically important plant species endemic to China. It is only found in a few regions of the Chongqing Municipal Region. For decades, its distribution has been shrinking as a result of over-exploitation, which has caused endangerment of this species. To assist in efforts to effectively conserve this species, we investigated the genetic variation of six natural populations using isoelectric focusing in thin-layer polyacrylamide slab gels. Fourteen loci of five enzyme systems were detected, of which seven were polymorphic. The mean number of effective alleles per locus (Ae) = 1.778, the percentage of polymorphic loci (P) = 0.441, the mean expected heterozygosity (He)= 0.199�� and the mean observed heterozygosity (Ho)= 0.235. The results revealed that low levels of genetic diversity existed within the natural populations of A. reniforme var. sinense in comparison with other species of ferns. Only 1.49% of the genetic variation occurred among populations whereas 98.51% existed within populations, suggesting a very low genetic divergence among the populations. The equilibrium state of the populations was measured using Hardy-Weinberg equilibrium and the Fixation Index (F). The results showed that a mixed mating system was possibly the main heterogamy of this species, and its endangerment was caused by over��exploitation and habitat loss.
[��������: 1]
[��������: 1]
[��������: 1]
[��������: 1]
[D].
[��������: 1]
[D].
[��������: 1]
[��������: 1]
[��������: 1]
[��������: 1]
[��������: 1]
[��������: 1]
[��������: 1]
DOI:10.1038/hdy.2008.35URLPMID:18461083 [��������: 1]
The last two decades have witnessed a remarkable activity in the development and use of molecular markers both in animal and plant systems. This activity started with low-throughput restriction fragment length polymorphisms and culminated in recent years with single nucleotide polymorphisms (SNPs), which are abundant and uniformly distributed. Although the latter became the markers of choice for many, their discovery needed previous sequence information. However, with the availability of microarrays, SNP platforms have been developed, which allow genotyping of thousands of markers in parallel. Besides SNPs, some other novel marker systems, including single feature polymorphisms, diversity array technology and restriction site-associated DNA markers, have also been developed, where array-based assays have been utilized to provide for the desired ultra-high throughput and low cost. These microarray-based markers are the markers of choice for the future and are already being used for construction of high-density maps, quantitative trait loci (QTL) mapping (including expression QTLs) and genetic diversity analysis with a limited expense in terms of time and money. In this study, we briefly describe the characteristics of these array-based marker systems and review the work that has already been done involving development and use of these markers, not only in simple eukaryotes like yeast, but also in a variety of seed plants with simple or complex genomes.
URLPMID:18721872 [��������: 1]
DOI:10.1007/s11295-011-0380-8URL [��������: 1]
[��������: 1]
[��������: 1]
URLPMID:26437648 [��������: 1]
[D].
[��������: 1]
[D].
[��������: 1]
[D].
[��������: 1]
[D].
[��������: 1]
[��������: 3]
URLPMID:28581499 [��������: 1]
URL [��������: 1]
[��������: 1]
[��������: 1]
[��������: 1]
[��������: 1]
[��������: 1]
[��������: 1]
[��������: 1]
[��������: 1]
[��������: 1]
[��������: 1]
[D].
[��������: 1]
[D].
[��������: 1]
URLPMID:19451168 [��������: 1]
URLPMID:20644199 [��������: 1]
DOI:10.1093/bioinformatics/btp352URLPMID:19505943 [��������: 1]
SUMMARY: The Sequence Alignment/Map (SAM) format is a generic alignment format for storing read alignments against reference sequences, supporting short and long reads (up to 128 Mbp) produced by different sequencing platforms. It is flexible in style, compact in size, efficient in random access and is the format in which alignments from the 1000 Genomes Project are released. SAMtools implements various utilities for post-processing alignments in the SAM format, such as indexing, variant caller and alignment viewer, and thus provides universal tools for processing read alignments. AVAILABILITY: http://samtools.sourceforge.net.
[��������: 1]
[��������: 1]
URLPMID:3447015 [��������: 1]
URLPMID:19648217 [��������: 1]
URL [��������: 1]
Single nucleotide polymorphisms (SNPs) are an abundant form of DNA variation which have a frequency of 1% or more throughout the genomes. SNPs consist of a single nucleotide base alteration including transition and transversion. They are stable and reliable mutation and are frequently referred to as bi-allelic makers. SNPs can be used conveniently for large-scale and high throughput genome analysis, in particular combining DNA chips and microarrays techniques. Therefore, SNPs provide a novel molecular marker system potentially useful for a wide range of biological disciplines. Here we briefly introduce the history and developments of SNP techniques, including its basic concept, its discovery and screening. We also discuss its applications in different research areas such as genetic mapping in mode animals and plants, DNA fingerprinting and its application in variety identification, species origin and relationship, linkage disequilibrium and associate analysis, and its application in population genetics. We anticipate that SNP markers will contribute greatly to the studies on population genetics, molecular breeding as well as evolutionary biology.
URLPMID:9582121 [��������: 1]
URLPMID:11733746 [��������: 1]
DOI:10.1073/pnas.0130101100URL [��������: 1]
URLPMID:12068090 [��������: 1]
DOI:10.1101/gr.2479404URLPMID:15342564 [��������: 1]
Dense coverage of the rice genome with polymorphic DNA markers is an invaluable tool for DNA marker-assisted breeding, positional cloning, and a wide range of evolutionary studies. We have aligned drafts of two rice subspecies, indica and japonica, and analyzed levels and patterns of genetic diversity. After filtering multiple copy and low quality sequence, 408,898 candidate DNA polymorphisms (SNPs/INDELs) were discerned between the two subspecies. These filters have the consequence that our data set includes only a subset of the available SNPs (in particular excluding large numbers of SNPs that may occur between repetitive DNA alleles) but increase the likelihood that this subset is useful: Direct sequencing suggests that 79.8% +/- 7.5% of the in silico SNPs are real. The SNP sample in our database is not randomly distributed across the genome. In fact, 566 rice genomic regions had unusually high (328 contigs/48.6 Mb/13.6% of genome) or low (237 contigs/64.7 Mb/18.1% of genome) polymorphism rates. Many SNP-poor regions were substantially longer than most SNP-rich regions, covering up to 4 Mb, and possibly reflecting introgression between the respective gene pools that may have occurred hundreds of years ago. Although 46.2% +/- 8.3% of the SNPs differentiate other pairs of japonica and indica genotypes, SNP rates in rice were not predictive of evolutionary rates for corresponding genes in another grass species, sorghum. The data set is freely available at http://www.plantgenome.uga.edu/snp.
DOI:10.1139/g03-027URLPMID:12834059 [��������: 1]
Single-nucleotide polymorphisms (SNPs) represent a new form of functional marker, particularly when they are derived from expressed sequence tags (ESTs). A bioinformatics strategy was developed to discover SNPs within a large wheat EST database and to demonstrate the utility of SNPs in genetic mapping and genetic diversity applications. A collection of > 90000 wheat ESTs was assembled into contiguous sequences (contigs), and 45 random contigs were then visually inspected to identify primer pairs capable of amplifying specific alleles. We estimate that homoeologue sequence variants occurred 1 in 24 bp and the frequency of SNPs between wheat genotypes was 1 SNP/540 bp (theta = 0.0069). Furthermore, we estimate that one diagnostic SNP test can be developed from every contig with 10-60 EST members. Thus, EST databases are an abundant source of SNP markers. Polymorphism information content for SNPs ranged from 0.04 to 0.50 and ESTs could be mapped into a framework of microsatellite markers using segregating populations. The results showed that SNPs in wheat can be discovered in ESTs, validated, and be applied to conventional genetic studies.
DOI:10.3864/j.issn.0578-1752.2018.04.003URL [��������: 1]
��Objective�� Understanding the genetic diversity and population structure of representative maize accessions are of importance in breeding practice for the guidance and reference. ��Method��A total of 344 maize inbred lines were selected, including American heterotic group, local germplasm, New germplasm used in maize breeding in China in recent years which were broadly representative. These lines were genotyped by 3 072 SNP markers which were developed by Maize Research Center, BAAFS to reveal the genetic diversity and population structure. ��Result��For 3 072 high-quality SNPs, the gene diversity averaged 0.442, ranging from 0.028 to 0.646, and the PIC averaged 0.344, ranging from 0.028 to 0.570. The result of population structure based on a model-based method indicated that these 344 lines could be divided into eight groups, including Lüda red cob, Huangzaosi improved lines, Iodent, Lancaster, P group, Improved Reid group, Reid and X group. The seven groups above were well-known, and the X group was selected from the populations constructed from X1132X. Among the eight groups, the Fst ranged from 0.319 to 0.512, and the genetic distance ranged from 0.229 to 0.514. AMOVA results indicated that 38.6% of the total genetic variation occurred among groups, 58.1% within groups and 3.3% within lines. PCA results showed that X group had higher genetic differentiation with Huangzaosi improved lines and Lancaster, but lower with Iodent. The genetic diversity of subpopulations indicated that with the increase of breeding years, the average of genetic diversity in each subpopulation was decreased, and among them, X group had the highest genetic diversity. Further analysis showed that the genetic diversity of core accessions in American heterotic group and local germplasm were higher decreased compared with that in P group and Improved Reid group. However, the genetic diversity of core accessions in X group was no decreased, which indicated that the core accessions of X group still maintained higher genetic diversity and had potential application in breeding.��Discussion��X group was different from the other seven known groups, which can be defined as an independent group. Furthermore, X group had further genetic relationship with Huangzaosi improved lines which indicated the strong heterosis pattern of "X group × Huangzaosi improved lines" had application potential.
DOI:10.3724/SP.J.1006.2013.00727URL [��������: 1]
The 1E and 7E chromosomes of Thinopyrum elongatum carry important resistance genes to wheat Fusarium head blight. Mapping and utilization of these resistance genes require numerous molecular markers specific to the 1E or 7E chromosome. In this study, we developed 368 specific fragments of Thinopyrum elongatum 1E chromosome using SLAF-seq technique, and randomly selected 80 fragments to design specific primers. Finally, 20 1E-specific, 2 genome-specific, and 26 other specific molecular markers were obtained, with the efficiency up to 60%. All the newly developed markers could amplify the specific bands in different lines derived from wheat–Th. elongatum progenies. According to the cosegregation of the specific markers and elite traits, some markers detected could be closely linked to the genes corresponding to target traits.
DOI:10.1111/pbr.12144URL [��������: 1]
Lacking of reference genome sequence for the development of stable molecular markers for specific chromosomes (intervals) remains to be a challenge in cotton, which was a necessary step in fine mapping of gene (QTL). In this study, the feasibility of development of single-nucleotide polymorphism (SNP) markers between CS-B14Sh (a substitution line for short arm of Chromosome 14) and TM-1 (the recurrent parent) was explored using next-generation sequencing (NGS) based on reduced representation libraries (RRLs). High-quality genome sequences, representing about 7.1%, 8.8% and 10.4% of the tetraploid cotton genome, were generated for TM-1, 3-79 (the donor parent) and CS-B14Sh, respectively. A total of 397 putative SNP markers were detected between CS-B14Sh and TM-1, and most (358) of them were also detected between TM-1 and 3-79. Allele-specific PCR method was used for validation of 40 SNP markers, and 27 of them showed polymorphism between TM-1 and CS-B14Sh, and a linkage group comprising of 25 SNP markers and five SSR markers was constructed. The order of SNP markers agreed well with the position of them on Chr05 of D genome, which further approved the truth of SNPs detected. The results suggested that the development of SNP markers in specific genome region using NGS was efficient in substitution or near-isogenic lines.
DOI:10.1186/1471-2164-16-1URL [��������: 1]
DOI:10.1111/nph.13626URLPMID:26479264 [��������: 1]
Present-day soybeans consist of elite cultivars and landraces (Glycine max, fully domesticated (FD)), annual wild type (Glycine soja, nondomesticated (ND)), and semi-wild type (semi-domesticated (SD)). FD soybean originated in China, although the details of its domestication history remain obscure. More than 500 diverse soybean accessions were sequenced using specific-locus amplified fragment sequencing (SLAF-seq) to address fundamental questions regarding soybean domestication. In total, 64,141 single nucleotide polymorphisms (SNPs) with minor allele frequencies (MAFs) > 0.05 were found among the 512 tested accessions. The results indicated that the SD group is not a hybrid between the FD and ND groups. The initial domestication region was pinpointed to central China (demarcated by the Great Wall to the north and the Qinling Mountains to the south). A total of 800 highly differentiated genetic regions and > 140 selective sweeps were identified, and these were three- and twofold more likely, respectively, to encompass a known quantitative trait locus (QTL) than the rest of the soybean genome. Forty-three potential quantitative trait nucleotides (QTNs; including 15 distinct traits) were identified by genome-wide association mapping. The results of the present study should be beneficial for soybean improvement and provide insight into the genetic architecture of traits of agronomic importance.
[��������: 1]
[��������: 1]
DOI:10.1038/s41467-017-00336-7URL [��������: 1]
DOI:10.1186/s13059-014-0415-1URLPMID:25079967 [��������: 1]
BACKGROUND: Recently, many studies utilizing next generation sequencing have investigated plant evolution and domestication in annual crops. Peach, Prunus persica, is a typical perennial fruit crop that has ornamental and edible varieties. Unlike other fruit crops, cultivated peach includes a large number of phenotypes but few polymorphisms. In this study, we explore the genetic basis of domestication in peach and the influence of humans on its evolution. RESULTS: We perform large-scale resequencing of 10 wild and 74 cultivated peach varieties, including 9 ornamental, 23 breeding, and 42 landrace lines. We identify 4.6 million SNPs, a large number of which could explain the phenotypic variation in cultivated peach. Population analysis shows a single domestication event, the speciation of P. persica from wild peach. Ornamental and edible peach both belong to P. persica, along with another geographically separated subgroup, Prunus ferganensis. CONCLUSIONS: Our analyses enhance our knowledge of the domestication history of perennial fruit crops, and the dataset we generated could be useful for future research on comparative population genomics.
