 ,1, 代旭冉1, 刘宏伟1, 杨丽1, 买春艳2, 于立强3, 于广军3, 张宏军,1,*, 李洪杰,1,*, 周阳,1,*
Relationship between the allelic variations at the Ppo-A1 and Ppo-D1 loci and pre-harvest sprouting resistance in wheat
HUANG Yi-Wen,1, DAI Xu-Ran1, LIU Hong-Wei1, YANG Li1, MAI Chun-Yan2, YU Li-Qiang3, YU Guang-Jun3, ZHANG Hong-Jun,1,*, LI Hong-Jie,1,*, ZHOU Yang,1,*通讯作者: * 张宏军, E-mail:zhanghongjun01@caas.cn;李洪杰, E-mail:lihongjie@caas.cn;周阳, E-mail:zhouyang@caas.cn
收稿日期:2020-11-20接受日期:2021-03-19网络出版日期:2021-04-01
| 基金资助: |
Corresponding authors: * E-mail:zhanghongjun01@caas.cn;E-mail:lihongjie@caas.cn;E-mail:zhouyang@caas.cn
Received:2020-11-20Accepted:2021-03-19Published online:2021-04-01
| Fund supported: |
作者简介 About authors
E-mail:18838916683@163.com

摘要
Ppo-A1和Ppo-D1是控制小麦多酚氧化酶(polyphenol oxidase, PPO)活性的关键基因。有报道PPO活性与穗发芽抗性有关, 但Ppo-A1和Ppo-D1位点不同等位变异对穗发芽抗性的影响尚不明确。本研究利用248份我国主栽小麦品种3年发芽指数, 结合Ppo-A1和Ppo-D1位点等位变异分型结果, 研究两个位点不同等位变异及其等位变异组合与穗发芽抗性的关系。结果表明, 发芽指数主要受年份、Ppo-A1位点和Ppo-A1 × Ppo-D1互作共同影响。在Ppo-A1位点, 携带低PPO活性等位变异Ppo-A1b的小麦品种发芽指数显著低于携带高PPO活性等位变异Ppo-A1a的品种, 平均发芽指数相差5.22%; 相反, 在Ppo-D1位点携带低PPO活性等位变异Ppo-D1a品种的发芽指数高于携带高PPO活性等位变异Ppo-D1b的品种, 但差异不显著。在4种等位变异组合中, Ppo-A1bPpo-D1b组合类型品种的发芽指数最低。上述Ppo-A1位点等位变异与穗发芽抗性的关系在轮选13 × 济麦20 F2及F2:3分离群体中得到验证。PPO活性和Ppo-A1相对表达量均与发芽指数呈显著正相关。本研究表明, Ppo-A1b等位变异的分子标记可以有效地用于穗发芽抗性辅助选择。
关键词:
Abstract
Ppo-A1 and Ppo-D1 are the major genes that control the activity of polyphenol oxidase (PPO) in wheat. It has been reported that the activity of polyphenol oxidase affects pre-harvest sprouting (PHS) resistance, but the effect of different alleles/allelic combinations at the Ppo-A1 and Ppo-D1 loci on PHS resistance remains unclear. The current study was carried out to elucidate the effects based on the germination index obtained from 248 Chinese wheat cultivars in a three-year trial in combination with genotypic data at the Ppo-A1 and Ppo-D1 loci. Analysis of variation for the Ppo-A1 and Ppo-D1 loci showed that year, Ppo-A1 locus and Ppo-A1 × Ppo-D1 interaction had significant effects on germination index. At locus Ppo-A1, germination index of cultivars carrying the allele Ppo-A1b of low PPO activity was 5.22% lower than that carrying the allele Ppo-A1a of high PPO activity on average. In contrast, the cultivars carrying the allele Ppo-D1a of low PPO activity had higher germination index than that carrying the allele Ppo-D1b of high PPO activity at locus Ppo-D1, but no significant differences between two alleles. Among the four allelic combinations, the cultivars with the Ppo-A1bPpo-D1b had the lowest germination index. The relationship between the alleles at locus Ppo-A1 and PHS resistance had been verified in the Lunxuan 13 × Jimai 20 F2 and F2:3 segregation populations. There were significantly positive correlations between PPO activity / relative expression level of Ppo-A1 gene and germination index. This study suggests that functional markers of allele Ppo-A1b can be effectively applied in marker-assisted selection for PHS resistance.
Keywords:
PDF (3424KB)元数据多维度评价相关文章导出EndNote|Ris|Bibtex收藏本文
本文引用格式
黄义文, 代旭冉, 刘宏伟, 杨丽, 买春艳, 于立强, 于广军, 张宏军, 李洪杰, 周阳. 小麦多酚氧化酶基因Ppo-A1和Ppo-D1位点等位变异与穗发芽抗性的关系. 作物学报, 2021, 47(11): 2080-2090 DOI:10.3724/SP.J.1006.2021.01089
HUANG Yi-Wen, DAI Xu-Ran, LIU Hong-Wei, YANG Li, MAI Chun-Yan, YU Li-Qiang, YU Guang-Jun, ZHANG Hong-Jun, LI Hong-Jie, ZHOU Yang.
中国是世界上最大的小麦生产国, 约占全球总产量的17% [1]。穗发芽是限制小麦产量和品质的重要自然灾害之一, 在小麦主产国频繁发生[2]。穗发芽可导致小麦价格降低20%~50%, 全球每年因穗发芽损失高达10亿美元[3]。我国83%的小麦种植地区受到不同程度的穗发芽影响[4]。近年来, 收获期间的极端天气导致穗发芽频发, 例如2013、2015和2016年小麦主产区黄淮冬麦区和长江中下游冬麦区穗发芽大面积发生, 对小麦生产造成严重影响[5]。因此, 提高品种的穗发芽抗性成为我国小麦主产区的重要育种目标。
小麦穗发芽抗性是由多基因控制的复杂数量性状[6,7], 受环境因素影响大, 分子标记辅助选择能够提高小麦抗穗发芽育种的选择效率。目前, 已经定位了42个与穗发芽抗性相关的QTL[3,8]。其中, 位于第二、三部分同源群染色体和4A染色体上的6个穗发芽抗性基因TaSdr[9]、TaMFT-3A [10]、Tamyb10[11]、TaDFR[12]、TaVp1[13]和TaMKK3-A[14]已经被克隆并开发出相应的功能标记。Lin等[15]利用含有TaMFT-3A和TaMKK3-A抗性等位变异的小麦品种Tutoumai分别与AUS1408和NW97S186杂交并回交构建BC2F2:3群体, 发现TaMFT-3A基因在不同的环境下能够降低发芽率8.3%~29.0%; TaMKK3-A基因可降低发芽率6.7%~27.6%; 2个基因的聚合体可使发芽率降低9.0%~49.2%。
多酚物质的减少或缺失导致无原花色素大麦突变体休眠期缩短、吸水性增强, 从而加重穗发芽发生[16]。在小黑麦休眠种子中酚类物质含量较高, 而在发芽的种子中明显较低, 表明酚类物质能够抑制穗发芽的发生[17]。此外, 在甜樱桃[18]、苜蓿[19]和藏红花[20]等植物上也证实穗发芽抗性与酚类物质含量呈显著正相关。小麦PPO可以催化酚类的羟基转化为醌或者催化多酚类变为氧化醌[21]。醌类物质因其较强的电化学性质而发生的自动氧化反应, 是导致小麦面粉食品加工储藏过程中发生褐变的主要原因[22]。有研究发现PPO活性与小麦穗发芽抗性有关, 并提出PPO活性可作为穗发芽抗性筛选的指标[23,24], 但这需要更多品种和遗传群体验证, 加之PPO活性的测定耗时耗力, 因而这个指标难于用于育种后代规模化选择。
控制小麦PPO活性基因主要包括位于2AL和2DL染色体上的Ppo-A1和Ppo-D1[25,26]。Ppo-A1基因内含子191 bp的插入缺失(InDel)与PPO活性密切相关, STS标记PPO18可用来检测高、低PPO活性等位变异Ppo-A1a和Ppo-A1b[25]。针对Ppo-D1基因开发的一对显性互补STS标记PPO29和PPO16, 可分别检测高、低PPO活性等位变异Ppo-D1b和Ppo-D1a[26]。这3个功能标记可用于Ppo-A1和Ppo-D1位点不同PPO活性等位变异的检测。本研究的目的是阐明这2个位点不同等位变异与穗发芽抗性关系, 为开展育种后代穗发芽抗性的分子标记辅助选择提供理论和技术支持。
1 材料与方法
1.1 供试材料
供试材料为248份1971—2020年小麦主栽品种, 其中包括北部麦区品种13份、黄淮冬麦区品种204份、长江中下游冬麦区品种17份和西南冬麦区品种14份。利用穗发芽敏感品种轮选13 (Ppo-A1aPpo- A1a基因型)做为母本, 抗穗发芽品种济麦20 (Ppo- A1bPpo-A1b基因型)做为父本, 构建轮选13 × 济麦20 F2和F2:3群体, 共计266个家系, 用于验证Ppo- A1位点不同等位变异与穗发芽抗性关系。1.2 田间试验
2017—2018年、2018—2019年和2019—2020年小麦生长季, 在中国农业科学院作物科学研究所新乡试验站(35°31′N, 113°85′E)开展田间试验。小麦主栽品种和轮选13 × 济麦20群体F2:3家系每个材料种植1行, 行长2 m, 行距20 cm, 株距5 cm; 轮选13 × 济麦20群体F2单株种植采用2 m行长, 行距20 cm, 株距10 cm。播种前, 施用复合肥折合纯N 200 kg hm-2, P2O5 191 kg hm-2和K2O 41 kg hm-2 [27]。其他田间管理按照当地大田生产管理进行。1.3 穗发芽抗性表型评价
2018、2019和2020年连续3年对主栽小麦品种穗发芽抗性进行表型鉴定。采用籽粒发芽指数法鉴定穗发芽抗性, 发芽指数越高, 穗发芽抗性越差[28]。在生理成熟期(开花后约35 d, 穗茎变黄), 每个材料收获30个穗子。室温(25℃)自然风干4 d, 手工脱粒后放入-20℃冰柜中保存, 统一进行表型评价。发芽指数鉴定设3次重复, 每次重复50粒种子。种子用5%的NaClO消毒15 min, 蒸馏水冲洗3次。在无菌培养皿中垫上两张灭菌滤纸并加入适量的蒸馏水, 将消毒后的种子摆放在培养皿中, 种子腹沟朝下。在25℃的条件下培养7 d。每天统计发芽数, 并挑出发芽的种子。发芽指数(germination index, GI)计算公式如下: GI (%) = [(7×n1+6×n2+5×n3+4×n4+ 3×n5+ 2×n6+n7)/7×N]×100%, 其中n1、n2、n3……n7分别代表第1、2、3……7 d的发芽数, N为总粒数[9]。2019年和2020年, 采用相同方法对轮选13 × 济麦20群体F2和F2:3代进行穗发芽抗性鉴定, 3次实验重复。在生理成熟期, F2代分单株收获、脱粒、风干后进行表型鉴定; F2:3代每个家系随机取20个穗子混脱, 风干后进行穗发芽抗性评价。1.4 PPO活性基因不同等位变异分子检测
主栽品种每个材料取10粒种子放在培养皿中, 取室温生长5日龄叶片, 利用DNA快速提取试剂盒(北京天根生化科技有限公司, 北京)提取小麦基因组DNA。在分蘖期, 轮选13 × 济麦20群体F2代分单株挂牌取叶片进行DNA提取。F2:3代家系分系取穗进行穗发芽抗性鉴定, 其基因型直接用对应的F2单株基因型代替。利用PPO18、PPO16和PPO29引物检测Ppo-A1和Ppo-D1位点不同等位变异, 扩增片段大小和退火温度见表1。PCR扩增在赛默飞世尔SimpliAmp PCR仪(ThermoFisher Scientific, USA)上进行, 反应体系为10 μL, 包括1 μL DNA模板(50~100 ng μL-1), 5 μL 2× Taq PCR Master Mix, 正反引物各1 μL (10 μmol L-1)和2 μL ddH2O。PCR扩增程序为94℃预变性5 min, 94℃变性30 s, 60℃退火30 s, 72℃延伸1 min, 35个循环, 72℃后延伸10 min。利用1.5%的琼脂糖凝胶电泳分离扩增产物, GeneFinder (Bio-V, 中国福建)染色后用Bio-Rad Gel Doc XR+凝胶成像系统扫描, 分析基因型。Table 1
表1
表1Ppo-A1和Ppo-D1位点不同等位变异检测的功能标记信息
Table 1
| 位点 Locus | 标记 Marker | 引物序列 Primer sequence (5′-3′) | 等位基因 Allele | 扩增片段 Amplified fragment (bp) | 退火温度 Annealing temperature (℃) | 参考文献 Reference |
|---|---|---|---|---|---|---|
| Ppo-A1 | PPO18 | F: AACTGCTGGCTCTTCTTCCCA | Ppo-A1a | 685 | 60 | [25] |
| R: AAGAAGTTGCCCATGTCCGC | Ppo-A1b | 876 | ||||
| Ppo-D1 | PPO16 | F: TGCTGACCGACCTTGACTCC | Ppo-D1a | 713 | 60 | [26] |
| R: CTCGTCACCGTCACCCGTAT | ||||||
| PPO29 | F: TGAAGCTGCCGGTCATCTAC | Ppo-D1b | 490 | |||
| R: AAGTTGCCCATGTCCTCGCC |
新窗口打开|下载CSV
1.5 籽粒PPO活性测定
根据Ppo-A1和Ppo-D1位点等位变异四种组合类型, 每种组合选择10个品种进行PPO活性测定, 共计40个品种。同时, 根据Ppo-A1位点等位变异差异, 在轮选13 × 济麦20 F2:3群体中各选取20个株系进行PPO活性测定。两次实验重复。小麦籽粒PPO活性测定参照Anderson和Morris [29]的方法。每个材料挑选15粒饱满、无病、大小均匀一致的成熟种子用蒸馏水清洗2次, 拭去表面水分, 称重后置于50 mL离心管中, 然后加入配好的L-DOPA/ MOPS反应缓冲液(50 mmol L-1的MOPS缓冲液, pH 6.5; 10 mmol L-1 L-DOPA溶液, 吐温20) 4.5 mL; 在振荡器上振荡30 min, 结束后立即放至冰上结束反应。以L-DOPA/MOPS反应缓冲液作为空白对照, 利用SPECORD 200紫外可见分光光度计(Analytik Jena AG, Jena, Germany)测定475 nm的吸光值A。PPO活性公式如下: PPO酶活值(A475nmmin-1g-1× 10³)= A/(30 min × 15粒种子克数) × 103。1.6 RNA提取及qRT-PCR分析
用于PPO活性测定的材料同时用于Ppo-A1和Ppo-D1基因的qRT-PCR分析。籽粒总RNA提取及纯化采用种子果实RNA提取试剂盒(北京金百特生物技术有限公司, 北京)。利用HiFi-MMLV cDNA第一链合成试剂盒(北京康为世纪生物科技有限公司, 北京)进行RNA反转录, 反应体系为20 μL, 包括 4 μL dNTPs Mix, 2 μL Primer Mix, 2 μL RNA模板(200~300 ng μL?1), 4 μL 5 × RT buffer, 2 μL (0.1 mol L?1) DTT, 1 μL (200 U μL?1) HiFi-MMLV和7 μL RNAase-free H2O。反转录反应程序为42℃孵育30~50 min, 85℃孵育5 min, 反应结束后, 置于冰上冷却。qRT-qPCR扩增在CFX Touch实时荧光定量PCR仪(Bio-Rad, Hercules, USA)上进行, 反应体系为20 μL, 包括10 μL 2 × Universal SYBR Green Fast qPCR Mix (武汉爱博泰克生物科技有限公司, 湖北武汉), 4 μL cDNA模板(25 ng μL?1), 正反向引物各0.4 μL (10 μmol L?1), 5.2 μL Nuclease-free H2O。引物序列见表2。反应程序为95℃预变性3 min, 95℃变性5 s, 60℃延伸30 s, 40个循环。Actin基因作为内参基因, 采用2-ΔΔCT方法[30]计算Ppo-A1和Ppo-D1基因相对表达量。设置3次重复。Table 2
表2
表2qRT-PCR分析引物
Table 2
| 基因 Gene | 上游引物序列 Forward primer sequence (5′-3′) | 下游引物序列 Reverse primer sequence (5′-3′) |
|---|---|---|
| Ppo-A1 | GCAACTGCCAAACGCCCGAGC | CAGCACGAAGTCGGTGATGCC |
| Ppo-D1 | CCGGACCTTGAGATCCAGGTG. | GAAGGTGTCGTCGCCGATGAG |
| Actin | GTTTCCTGGAATTGCTGATCGCAT | CATTATTTCATACAGCAGGCAAGC |
新窗口打开|下载CSV
1.7 统计分析
利用Microsoft Excel 2019数据分析工具对发芽指数表型数据进行分析。利用SAS v9.2软件(SAS Institute, Cary, NC, USA)进行方差分析和相关分析。通过SPSS16.0软件(International Business Machines Corporation, Armonk, New York, USA)对Ppo-A1和Ppo-D1位点不同等位变异间发芽指数进行差异显著性t检验和不同等位变异组合发芽指数、PPO活性以及基因相对表达量多重比较分析(LSD法)。采用下列公式计算广义遗传力(h2): h2 = σ2g/(σ2g + σ2gy/y + σ2ε/ry), 其中, σ2g、σ2gy、σ2ε、r和y分别表示基因型、基因型 × 年份间互作、重复和年份[31]。2 结果与分析
2.1 穗发芽抗性表型分析
248份小麦品种3年发芽指数方差分析发现, 基因型、年份及基因型与年份间互作均方显著(P < 0.01), 表明发芽指数受三者共同影响(表3)。发芽指数广义遗传率为0.95。年份间供试品种发芽指数呈极显著正相关, 相关系数为0.69~0.80 (P < 0.01) (图1)。由表4可见, 小麦品种间发芽指数差异显著。供试品种3年平均发芽指数为46.70%, 变幅为11.55%~88.70%, 变异系数为36.41%。不同年份间发芽指数存在差异。2019年平均发芽指数最高为58.39%, 变幅为17.14%~92.19%, 变异系数为30.10%; 2020年平均发芽指数最低为34.21%, 变幅为2.95%~88.71%, 变异系数为55.59%。不同种皮颜色品种间发芽指数同样存在显著差异, 红粒品种发芽指数(36.15%)明显低于白粒品种(48.19%)。发芽指数较低的白粒品种有洛旱11 (13.84%)、丰产3号(16.38%)和百农3217 (16.96%), 红粒品种有扬麦20 (11.56%)、扬麦15 (14.53%)和扬麦16 (15.68%)。Table 3
表3
表32018-2020年248份小麦品种发芽指数方差分析
Table 3
| 变异来源Source of variation | 自由度DF | 均方Mean square |
|---|---|---|
| 基因型 Genotypes (G) | 247 | 0.26** |
| 年份 Years (Y) | 2 | 10.91** |
| 基因型 × 年份互作G × Y interaction | 494 | 0.03** |
| 重复 Replications | 2 | 0.04 |
| 误差 Error | 1486 | 0.01 |
新窗口打开|下载CSV
图1
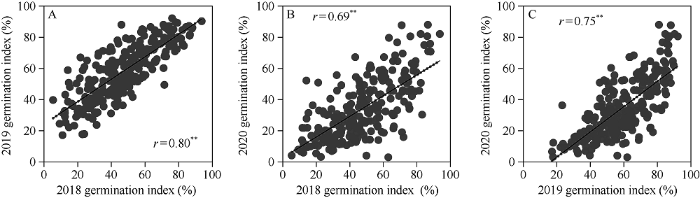 新窗口打开|下载原图ZIP|生成PPT
图1小麦品种年份间发芽指数相关分析
**表示在P < 0.01水平下差异显著。
Fig. 1Correlation analysis of germination index between years in the Chinese wheat cultivars examined
**Significance at P < 0.01.
Table 4
表4
表4248份小麦品种和轮选13 × 济麦20群体平均发芽指数、标准差、变幅和变异系数
Table 4
| 品种/群体 Cultivar/population | 年份 Year | 均值±标准差 Mean ± SD | 变幅 Range | 变异系数 Coefficient of variation |
|---|---|---|---|---|
| 248份小麦品种 | 2018 | 47.46 ± 19.48 | 5.33-93.71 | 40.97 |
| 248 wheat cultivars | 2019 | 58.39 ± 17.61 | 17.14-92.19 | 30.10 |
| 2020 | 34.21 ± 19.05 | 2.95-88.71 | 55.59 | |
| 平均 Mean | 46.70 ± 17.03 | 11.55-88.70 | 36.41 | |
| 轮选13 × 济麦20群体 | 2019 (F2) | 59.49 ± 16.59 | 18.10-90.76 | 27.88 |
| Lunxuan 13 × Jimai 20 population | 2020 (F2:3) | 46.94 ± 13.22 | 19.14-79.53 | 28.18 |
新窗口打开|下载CSV
亲本轮选13平均发芽指数(81.68%)显著高于济麦20 (28.68%) (P < 0.05) (图2)。2019年轮选13 × 济麦20群体F2平均发芽指数为59.49%, 变幅为18.10%~90.76%, 变异系数为27.88%; 2020年F2:3平均发芽指数为46.94%, 变幅为19.14%~79.53%, 变异系数为28.18%。
图2
 新窗口打开|下载原图ZIP|生成PPT
图2亲本轮选13 (A)和济麦20 (B)穗发芽抗性比较(发芽3 d)
Fig. 2Comparison of pre-harvest sprouting resistance between parents Lunxuan 13 (A) and Jimai 20 (B) after germination for three days
2.2 Ppo-A1和Ppo-D1位点不同等位变异检测
利用PPO18、PPO16和PPO29标记检测248份小麦品种Ppo-A1和Ppo-D1位点的不同等位变异。在Ppo-A1位点, PPO18标记在洛旱7号、新麦20和淮麦20等113份小麦品种中扩增出685 bp片段, 表明这些品种携带高PPO活性等位变异Ppo-A1a; 京411、山农20和石4185等135份小麦品种中扩增出876 bp片段, 表明这些品种携带低PPO活性等位变异Ppo-A1b (图3-A)。在Ppo-D1位点, PPO16标记在石麦12、山农20和新麦20等129份小麦品种中扩增出713 bp片段, 表明这些品种携带低PPO活性等位变异Ppo-D1a; PPO29标记在京411、洛旱7号和石4185等119份小麦品种中扩增出490 bp片段, 表明这些品种携带高PPO活性等位变异Ppo-D1b (图3-B)。所有供试品种在2个位点没有发现杂合基因型。图3
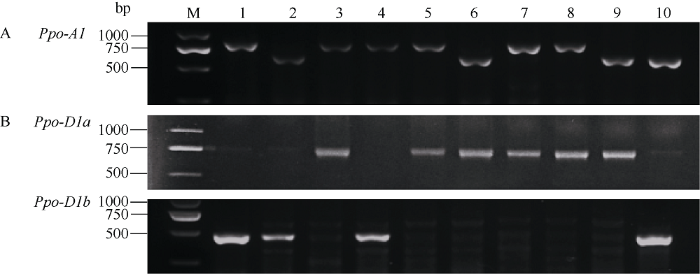 新窗口打开|下载原图ZIP|生成PPT
图3分子标记PPO18、PPO16和PPO29检测部分小麦品种Ppo-A1 (A)和Ppo-D1 (B)位点的不同等位变异
M: DNA ladder 2000; 1: 京411; 2: 洛旱7号; 3: 山农20; 4: 石4185; 5: 石麦12; 6: 新麦20; 7: 开麦20; 8: 许农5号; 9: 淮麦20; 10: 邢麦13。
Fig. 3Detection of alleles at the Ppo-A1 and Ppo-D1 loci in selected wheat cultivars using markers PPO18, PPO16, and PPO29
M: marker DNA ladder 2000; 1: Jing 411; 2: Luohan 7; 3: Shannong 20; 4: Shi 4185; 5: Shimai 12; 6: Xinmai 20; 7: Kaimai 20; 8: Xunong 5; 9: Huaimai 20; 10: Xingmai 13.
2.3 Ppo-A1和Ppo-D1位点不同等位变异与穗发芽抗性关系
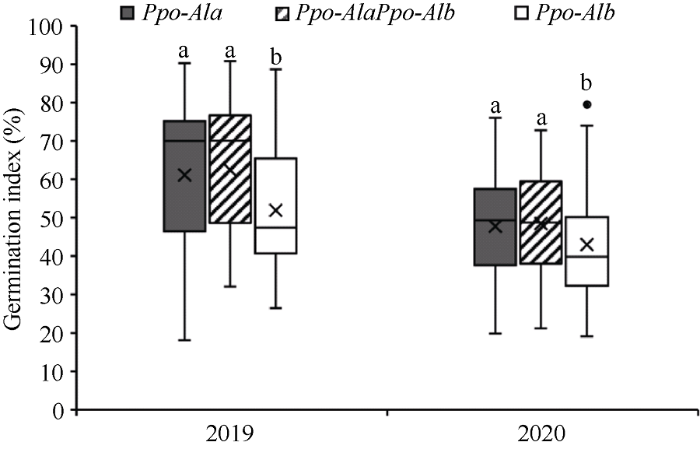
248份小麦品种Ppo-A1和Ppo-D1位点3年发芽指数方差分析发现, 发芽指数受年份、Ppo-A1位点以及Ppo-A1 × Ppo-D1互作共同影响(表5)。在Ppo-A1位点, 携带Ppo-A1b等位变异品种(135份)发芽指数显著低于携带Ppo-A1a等位变异品种(113份) (P < 0.01)。2018年、2019年和2020年, Ppo-A1b品种比Ppo-A1a品种发芽指数分别降低3.90%、6.33%和5.43%, 3年平均降低5.22% (图4-A)。相反, 在Ppo-D1位点携带低多酚氧化酶等位变异Ppo-D1a品种(129份)一致表现比携带高多酚氧化酶等位变异Ppo-D1b品种(119份)更高的发芽指数, 但两种等位变异品种间发芽指数差异不显著。在2018年、2019年、2020年以及3年平均分别高1.6%、1.4%、1.5%和1.5% (图4-B)。Table 5
表5
表5248份小麦品种Ppo-A1和Ppo-D1位点3年发芽指数方差分析
Table 5
| 变异来源 Source of variation | 自由度 DF | 均方 Mean square |
|---|---|---|
| 年份 Years (Y) | 2 | 3.543** |
| Ppo-A1 | 1 | 0.512** |
| Ppo-D1 | 1 | 0.009 |
| Ppo-A1 × Ppo-D1互作Ppo-A1 × Ppo-D1 interaction | 1 | 0.173* |
| Ppo-A1 × 年份互作 Ppo-A1 × Y interaction | 2 | 0.010 |
| Ppo-D1 × 年份互作 Ppo-D1 × Y interaction | 2 | 0.001 |
| Ppo-A1 × Ppo-D1 × 年份互作 Ppo-A1 × Ppo-D1 × Y interaction | 2 | 0.010 |
| 误差 Error | 732 | 0.035 |
新窗口打开|下载CSV
图4
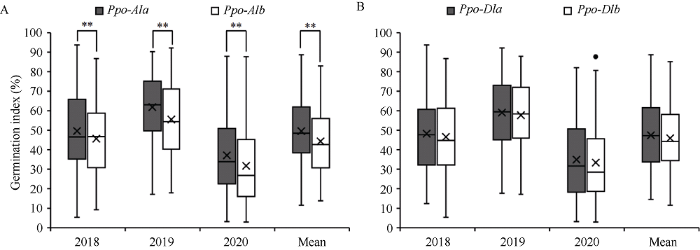 新窗口打开|下载原图ZIP|生成PPT
图4小麦品种Ppo-A1 (A)和Ppo-D1 (B)位点不同等位变异间发芽指数比较
**表示在P < 0.01水平下差异显著。圆点: 极端值。
Fig. 4Comparison of germination index between alleles at the Ppo-A1 (A) and Ppo-D1 (B) loci in the wheat cultivars examined
** represents significant at P < 0.01. Dot: outlier.
2.4 Ppo-A1和Ppo-D1位点不同等位变异组合与穗发芽抗性关系
方差分析发现Ppo-A1 × Ppo-D1互作均方显著, 表明2个位点共同影响穗发芽抗性。4种等位变异组合发芽指数比较分析发现, 不同等位变异组合品种间存在差异。其中, Ppo-A1位点低PPO活性等位变异Ppo-A1b和Ppo-D1位点高PPO活性等位变异Ppo-D1b组合品种Ppo-A1bPpo-D1b (71份)平均发芽指数最低, 为42.52%; 其次为两个低PPO活性等位变异组合品种Ppo-A1bPpo-D1a (64份), 平均发芽指数为46.30%; 两个高PPO活性等位变异组合Ppo- A1aPpo-D1b (48份)发芽指数最高, 平均为50.90% (图5)。4种组合品种中, Ppo-A1bPpo-D1b与Ppo- A1aPpo-D1b相比, 2018年、2019年、2020年和3年平均发芽指数分别降低5.88%、9.19% (P < 0.01)、10.10% (P < 0.01)和8.39% (P < 0.01); Ppo-A1bPpo- D1b与Ppo-A1aPpo-D1a相比, 2018年、2019年、2020年和3年平均发芽指数分别降低4.95%、6.88% (P < 0.01)、6.16%和5.99% (P < 0.01)。其他等位变异组合间发芽指数无显著差异。图5
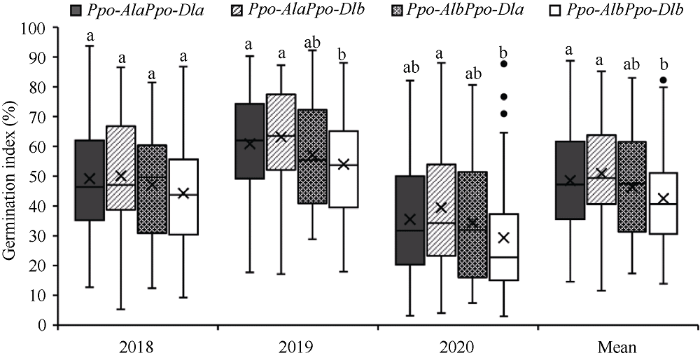 新窗口打开|下载原图ZIP|生成PPT
图5小麦品种Ppo-A1和Ppo-D1位点不同等位变异组合间发芽指数比较
不同字母表示等位变异间发芽指数在0.01水平显著。圆点: 极端值。
Fig. 5Comparison of germination index among allelic combinations at the Ppo-A1 and Ppo-D1 loci in the wheat cultivars examined
Different letters indicate significance at P < 0.01 in germination index between alleles. Dot: outlier.
2.5 轮选13 × 济麦20遗传群体Ppo-A1位点不同等位变异间穗发芽抗性比较
利用PPO18标记分析, 轮选13 × 济麦20 F2群体检测出80株纯合Ppo-A1a基因型(Ppo-A1aPpo- A1a), 64株纯合Ppo-A1b基因型(Ppo-A1bPpo-A1b), 122株是杂合基因型(Ppo-A1aPpo-A1b)。根据F2和F2:3表型, Ppo-A1bPpo-A1b基因型发芽指数显著低于杂合型和Ppo-A1aPpo-A1a基因型(P < 0.01)。与Ppo- A1aPpo-A1a基因型相比, Ppo-A1bPpo-A1b基因型发芽指数在2019年和2020年分别降低9.17% (P < 0.01)和4.77% (P < 0.01); 与杂合型相比, Ppo-A1bPpo- A1b基因型发芽指数在2019年和2020年分别下降10.44% (P < 0.01)和5.48% (P < 0.01) (图6)。Ppo- A1aPpo-A1a基因型与杂合型间发芽指数差异不显著。图6
 新窗口打开|下载原图ZIP|生成PPT
图6轮选13 × 济麦20群体Ppo-A1位点不同等位变异间发芽指数比较
不同字母表示等位变异间发芽指数在0.01水平显著。
Fig. 6Comparison of germination index among genotypes at the Ppo-A1 locus in the Lunxuan 13 × Jimai 20 population
Different letters indicate significant difference at P < 0.01 in germination index between alleles.
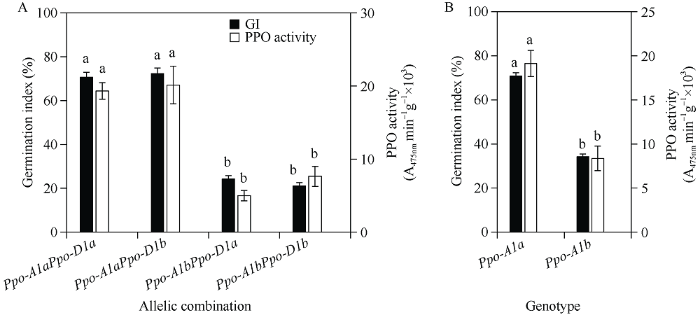
2.6 不同基因型PPO活性以及Ppo-A1和Ppo-D1基因表达分析
4种等位变异组合品种Ppo-A1aPpo-D1a、Ppo- A1aPpo-D1b、Ppo-A1bPpo-D1a和Ppo-A1bPpo- D1b的平均PPO活性分别为19.32、20.13、5.00和4.33 (A475nmmin-1g-1×10³)。其中, 组合Ppo- A1bPpo-D1a和Ppo-A1bPpo-D1b的PPO活性和发芽指数显著低于Ppo-A1aPpo-D1a和Ppo-A1aPpo- D1b组合(P < 0.01) (图7-A)。在轮选13 × 济麦20 F2:3群体中, 基因型Ppo-A1aPpo-A1a和Ppo- A1bPpo-A1b平均PPO活性分别为19.33和9.62 (A475nmmin-1g-1×10³), 两种基因型间在PPO活性和发芽指数上同样存在极显著差异(P < 0.01) (图7-B)。相关分析发现, 40个等位变异组合品种PPO活性与发芽指数呈极显著正相关(r = 0.80, P < 0.01), 并且在F2:3群体中40个家系PPO活性与发芽指数同样呈现极显著正相关(r = 0.74, P < 0.01)。qRT-PCR分析发现, 在低发芽指数Ppo-A1bPpo- D1a和Ppo-A1bPpo-D1b组合品种中Ppo-A1基因相对表达量要低于高发芽指数的Ppo-A1aPpo- D1a和Ppo-A1aPpo-D1b组合品种(图8-A), 相比之下, Ppo-D1基因表达量无明显差异(图8-B)。在轮选13 × 济麦20 F2:3群体中, 两种不同基因型间Ppo-A1基因相对表达量存在显著差异(图8-C)。图7
 新窗口打开|下载原图ZIP|生成PPT
图7不同基因型品种(A)和轮选13 × 济麦20群体F2:3株系(B) PPO活性比较
不同字母表示基因型间发芽指数或者PPO活性在0.01水平显著。
Fig. 7Comparison of PPO activity among wheat cultivars (A)/F2:3 lines (B) in the Lunxuan 13 × Jimai 20 population with different genotypes
Different letters indicate significant difference at P < 0.01 in germination index (GI) / PPO activity among genotypes.
图8
 新窗口打开|下载原图ZIP|生成PPT
图8不同基因型品种(A和B)和轮选13 × 济麦20群体F2:3株系(C) Ppo-A1和Ppo-D1基因实时定量表达分析
不同字母表示基因型间发芽指数或者基因相对表达水平在0.01水平显著。
Fig. 8Quantitative real time-PCR expression analysis of Ppo-A1 and Ppo-D1 genes in wheat cultivars (A and B) and F2:3 lines (C) in the Lunxuan 13 × Jimai 20 population
Different letters indicate significant difference at P < 0.01 in germination index (GI) / relative expression level among genotypes.
3 讨论
本研究发现, 供试小麦品种间发芽指数存在较大差异。其中, 丰产3号、百农3217和洛旱11等白粒品种以及扬麦20、扬麦15和扬麦16等红粒品种发芽指数较低, 表明这些品种具有很好的穗发芽抗性, 而且它们大部分曾经是各自生态区主推的小麦品种, 具有优良的农艺性状, 可作为抗穗发芽育种的亲本。不同麦区品种穗发芽抗性存在显著差异, 其中, 长江中下游冬麦区供试的17个品种抗穗发芽能力整体较强。可能原因一是这个麦区是穗发芽高发区, 自然选择和育种的有目的选择使品种的穗发芽抗性较强; 二是这些品种大部分是红粒品种, 一般红粒品种比白粒品种的穗发芽抗性更强[8]。本研究通过对248份主栽品种Ppo-A1和Ppo- D1位点等位变异与穗发芽抗性关系分析表明, 携带低PPO活性等位变异Ppo-A1b的小麦品种发芽指数显著低于携带高PPO活性等位变异Ppo-A1a的品种。利用轮选13 × 济麦20组合F2和F2:3分离群体验证得出相同的结论。在Ppo-D1位点, 两种等位变异间穗发芽抗性差异不显著。张立平等[33]利用中优9507 × CA9632 DH群体在染色体2AL和2DL上发现了2个控制小麦PPO活性主效QTL, 分别解释表型变异37.9%~50.0%和25.0%~29.1%, 说明Ppo-D1位点对PPO活性的效应小于Ppo-A1位点。携带Ppo-A1a的品种PPO活性(单位为A475nm min-1g-1×10³)为40.5, 携带Ppo-A1b的品种PPO活性为20.6, 两者相差19.9; 携带Ppo-D1a的品种PPO活性为27.5, 携带Ppo-D1b的品种PPO活性为34.5, 两者相差7.0 [26]。在某些遗传背景下, Ppo-D1位点不同等位变异之间PPO活性无差异或呈现相反的表型, 即含有Ppo-D1a等位变异却表现高PPO活性[32]。通过对40个主栽品种PPO活性测定发现, 携带Ppo-D1a等位变异的品种为12.18, Ppo-D1b等位变异的品种为13.91, 两者间无显著差异。由此可见, Ppo-D1位点效应较小, 并且不同等位变异间PPO活性无明显差异, 可能是导致该位点不同等位变异间穗发芽抗性差异不显著的主要原因。
Nilthong等[32]发现, Ppo-A1位点杂合基因型PPO活性介于两种纯合基因型之间, 尽管略高于双亲的平均值, 但明显低于纯合Ppo-A1a基因型。在轮选13 × 济麦20群体中, 纯合高PPO活性等位变异Ppo-A1a基因型和杂合基因型材料的发芽指数相近, 而且均显著高于纯合低PPO活性等位变异Ppo-A1b基因型, 由此可见, 杂合基因型发芽指数明显偏离中亲值, 具体原因有待进一步研究。但值得注意的是在轮选13 × 济麦20 F2和F2:3群体中杂合基因型均表现出与纯合高PPO活性Ppo-A1a基因型相近的高发芽指数, 高PPO活性Ppo-A1a基因表现出显性效应。
方差分析发现, Ppo-A1 × Ppo-D1互作均方显著, 表明两个位点共同影响穗发芽抗性, 但4种等位变异组合发芽指数比较分析发现, 2个低PPO活性等位变异组合品种Ppo-A1bPpo-D1a (64份, 46.30%)的发芽指数并非最低, 而是组合Ppo-A1bPpo-D1b (71份, 42.52%)的发芽指数最低, 且分别低于携带等位变异Ppo-A1b (44.31%)和Ppo-D1b (45.90%)品种在单个位点的发芽指数; 加之在单个位点, 等位变异Ppo- A1b和Ppo-D1b相对于同一位点另一个等位变异具有更好的穗发芽抗性。由此可见, Ppo-A1bPpo-D1b组合具有更低的发芽指数可能是等位变异Ppo-A1b和Ppo-D1b的累加效应造成的结果。
降低PPO活性是重要的小麦品质育种目标, 根据Ppo-A1b优良等位基因开发的功能标记已经用于低PPO活性材料筛选[34]。本研究表明, Ppo-A1b功能标记可以同时用于穗发芽抗性的选择, 为选育优质、抗穗发芽品种提供了重要信息。抗穗发芽基因的分子标记辅助选择技术在许多国家的小麦育种中广泛应用[15,35], 选择同时具有抗穗发芽基因和低PPO活性基因可能是提高穗发芽抗性的重要育种途径之一。
4 结论
我国小麦育成品种间发芽指数变异较大。Ppo- A1和Ppo-D1位点发芽指数受年份、Ppo-A1位点以及Ppo-A1 × Ppo-D1互作共同影响。Ppo-A1位点不同等位变异间穗发芽抗性差异显著; Ppo-D1位点等位变异间发芽指数没有显著差异。4种等位变异组合品种中, 具有Ppo-A1bPpo-D1b的品种发芽指数最低(42.52%), Ppo-A1bPpo-D1a组合次之(46.30%)。轮选13 × 济麦20遗传群体研究结果进一步证明低PPO活性等位变异Ppo-A1b与穗发芽抗性显著相关, 这个等位变异分子标记可用于穗发芽抗性育种的分子标记辅助选择。参考文献 原文顺序
文献年度倒序
文中引用次数倒序
被引期刊影响因子
DOIURL [本文引用: 1]
DOIURL [本文引用: 1]
DOIURL [本文引用: 2]
DOIURL [本文引用: 1]
DOIURL [本文引用: 1]
DOIURL [本文引用: 1]
DOIURL [本文引用: 1]
DOIURL [本文引用: 2]
DOIURL [本文引用: 2]
DOIURL [本文引用: 1]
DOIURL [本文引用: 1]
[本文引用: 1]
DOIURL [本文引用: 1]
DOIURL [本文引用: 1]
DOIURL [本文引用: 2]
[本文引用: 1]
[本文引用: 1]
DOIURL [本文引用: 1]
[本文引用: 1]
[本文引用: 1]
[本文引用: 1]
[本文引用: 1]
[本文引用: 1]
DOIURL [本文引用: 1]
DOIURL [本文引用: 1]
[本文引用: 1]
[本文引用: 1]
[本文引用: 1]
[本文引用: 1]
DOIURL [本文引用: 3]
PMID [本文引用: 4]

Polyphenol oxidase (PPO) activity is highly related to the undesirable browning of wheat-based end products, especially Asian noodles. Characterization of PPO genes and the development of their functional markers are of great importance for marker-assisted selection in wheat breeding. In the present study, complete genomic DNA sequences of two PPO genes, one each located on chromosomes 2A and 2D and their allelic variants were characterized by means of in silico cloning and experimental validation. Sequences were aligned at both DNA and protein levels. Two haplotypes on chromosome 2D showed 95.2% sequence identity at the DNA level, indicating much more sequence diversity than those on chromosome 2A with 99.6% sequence identity. Both of the PPO genes on chromosomes 2A and 2D contain an open reading frame (ORF) of 1,731 bp, encoding a PPO precursor peptide of 577 amino acids with a predicted molecular mass of approximately 64 kD. Two complementary dominant STS markers, PPO16 and PPO29, were developed based on the PPO gene haplotypes located on chromosome 2D; they amplify a 713-bp fragment in cultivars with low PPO activity and a 490-bp fragment in those with high PPO activity, respectively. The two markers were mapped on chromosome 2DL using a doubled haploid population derived from the cross Zhongyou 9507/CA9632, and a set of nullisomic-tetrasomic lines and ditelosomic line 2DS of Chinese Spring. QTL analysis indicated that the PPO gene co-segregated with the two STS markers and was closely linked to SSR marker Xwmc41 on chromosome 2DL, explaining from 9.6 to 24.4% of the phenotypic variance for PPO activity across three environments. In order to simultaneously detect PPO loci on chromosomes 2A and 2D, a multiplexed marker combination PPO33/PPO16 was developed and yielded distinguishable DNA patterns in a number of cultivars. The STS marker PPO33 for the PPO gene on chromosome 2A was developed from the same gene sequences as PPO18 that we reported previously, and can amplify a 481-bp and a 290-bp fragment from cultivars with low and high PPO activity, respectively. A total of 217 Chinese wheat cultivars and advanced lines were used to validate the association between the polymorphic fragments and grain PPO activity. The results showed that the marker combination PPO33/PPO16 is efficient and reliable for evaluating PPO activity and can be used in wheat breeding programs aimed for noodle and other end product quality improvement.
[本文引用: 1]
[本文引用: 1]
DOIPMID [本文引用: 1]
Preharvest sprouting (PHS), the germination of grain on the mother plant under cool and wet conditions, is a recurring problem for wheat farmers worldwide. alpha-amylase enzyme produced during PHS degrades starch resulting in baked good with poor end-use quality. The Hagberg-Perten Falling Number (FN) test is used to measure this problem in the wheat industry, and determines how much a farmer's wheat is discounted for PHS damage. PHS tolerance is associated with higher grain dormancy. Thus, breeding programs use germination-based assays such as the spike-wetting test to measure PHS susceptibility. Association mapping identified loci associated with PHS tolerance in U.S. Pacific Northwest germplasm based both on FN and on spike-wetting test data. The study was performed using a panel of 469 white winter wheat cultivars and elite breeding lines grown in six Washington state environments, and genotyped for 15,229 polymorphic markers using the 90k SNP Illumina iSelect array. Marker-trait associations were identified using the FarmCPU R package. Principal component analysis was directly and a kinship matrix was indirectly used to account for population structure. Nine loci were associated with FN and 34 loci associated with PHS based on sprouting scores. None of the QFN. wsu loci were detected in multiple environments, whereas six of the 34 QPHS. wsu loci were detected in two of the five environments. There was no overlap between the QTN detected based on FN and PHS, and there was little correlation between the two traits. However, both traits appear to be PHS-related since 19 of the 34 QPHS. wsu loci and four of the nine QFN. wsu loci co-localized with previously published dormancy and PHS QTL. Identification of these loci will lead to a better understanding of the genetic architecture of PHS and will help with the future development of genomic selection models.
DOIURL [本文引用: 1]
PMID [本文引用: 1]
The two most commonly used methods to analyze data from real-time, quantitative PCR experiments are absolute quantification and relative quantification. Absolute quantification determines the input copy number, usually by relating the PCR signal to a standard curve. Relative quantification relates the PCR signal of the target transcript in a treatment group to that of another sample such as an untreated control. The 2(-Delta Delta C(T)) method is a convenient way to analyze the relative changes in gene expression from real-time quantitative PCR experiments. The purpose of this report is to present the derivation, assumptions, and applications of the 2(-Delta Delta C(T)) method. In addition, we present the derivation and applications of two variations of the 2(-Delta Delta C(T)) method that may be useful in the analysis of real-time, quantitative PCR data.Copyright 2001 Elsevier Science (USA).
[本文引用: 1]
[本文引用: 2]
[本文引用: 2]
DOIURL [本文引用: 1]
[本文引用: 1]
[本文引用: 1]
DOIURL [本文引用: 1]
