 ,, 徐先超, 徐昱斐, 王秀成, 于海燕, 冯贝贝, 邢光南,*南京农业大学大豆研究所 / 国家大豆改良中心 / 农业农村部大豆生物学与遗传育种重点实验室(综合) / 作物遗传与种质创新国家重点实验室/江苏省现代作物生产协同创新中心, 江苏南京 210095
Utilization of dynamic transcriptomics analysis for candidate gene mining of 100-seed weight in soybean
ZENG Jian,, XU Xian-Chao, XU Yu-Fei, WANG Xiu-Cheng, YU Hai-Yan, FENG Bei-Bei, XING Guang-Nan,*Soybean Research Institute, Nanjing Agricultural University / National Center for Soybean Improvement / Key Laboratory for Biology and Genetic Improvement of Soybean (General), Ministry of Agriculture and Rural Affairs / National Key Laboratory for Crop Genetic and Germplasm Enhancement / Jiangsu Collaborative Innovation Center for Modern Crop Production, Nanjing 210095, Jiangsu, China通讯作者: * 邢光南, E-mail:xinggn@njau.edu.cn
收稿日期:2020-11-20接受日期:2021-03-19网络出版日期:2021-04-01
| 基金资助: |
Corresponding authors: * E-mail:xinggn@njau.edu.cn
Received:2020-11-20Accepted:2021-03-19Published online:2021-04-01
| Fund supported: |
作者简介 About authors
E-mail:2019101129@njau.edu.cn

摘要
百粒重是影响大豆产量的重要农艺性状, 揭示其分子基础发掘关键候选基因对大豆改良具有重要意义。本研究通过对12个大豆品种籽粒发育3个时期共36个样本的转录组数据进行加权基因共表达网络分析(weighted gene co-expression network analysis, WGCNA), 得到20个基因共表达模块, 与百粒重及4个粒形性状关联后发现green模块与表型最为相关, 之后根据Gene Significance (GS)值和Eigengene Connectivity (kME)值筛选出13个green模块内的核心基因(hub gene); 然后对2组百粒重存在极显著差异的大豆品种的籽粒发育3个时期分别进行基因差异表达分析发现大豆在籽粒发育前中期可能通过MAPK信号通路调节百粒重大小; 之后对其进行SNPs/InDels挖掘并根据Gene Ontology (GO)注释发现green模块内的Glyma.14G043900和Glyma.15G217400由于SNP变异造成同义以及非同义突变, 且存在调控基因表达相关的GO Terms以及锌指结构域, 表明它们可能通过调控hub基因和差异表达基因调控大豆百粒重及粒形性状。Glyma.15G217400位于已报道的4个百粒重QTL中, 而Glyma.14G043900位于已报道的一个籽粒蛋白含量及一个油脂含量QTL中。通过比对大豆公共数据库发现这2个基因的百粒重增效等位变异受到人工选择, 其频率从野生大豆到地方品种再到育成品种的过程中逐渐升高。这些结果为进一步发掘大豆百粒重候选基因及其表达调控机制提供了新思路。
关键词:
Abstract
100-seed weight of soybean is an important agronomic trait that affects yield, and it is of great significance to reveal its molecular basis and discover key candidate genes for soybean improvement breeding. In this study, weighted gene co-expression network analysis (WGCNA) was performed on the transcriptome data of 36 samples from 12 soybean varieties at three stages of seed development, and 20 gene co-expression modules were obtained. After correlating with 100-seed weight and four-seed shape traits, the green module was found to be most correlated with the phenotypes. Then 13 hub genes of green module were screened based on the Gene Significance (GS) and Eigengene Connectivity (kME) value. Gene differential expression of two groups of soybean varieties with extremely significant differences in 100-seed weight showed that the MAPK signaling pathway in the early and mid-term of seed development might regulate the 100-seed weight in soybean. According to SNPs/InDels calling and Gene Ontology (GO) annotation, Glyma.14G043900 and Glyma.15G217400 in the green module caused synonymous and non-synonymous coding mutations due to SNP mutations, and there were GO Terms and zinc finger domains related to gene expression regulation. These results suggested that they might regulate the 100-seed weight and seed shape of soybeans by regulating the hub gene and differentially expressed genes. Furthermore, Glyma.15G217400 was located in four reported QTLs of 100-seed weight, while Glyma.14G043900 was located in a reported seed protein content QTL and an oil content QTL. Compared with soybean public database, the increasing 100-seed weight alleles of the two genes were artificially selected and their frequency was gradually increased from wild accessions to landraces, resulting in the improved cultivars. These results provide new ideas for further discovering 100-seed weight candidate gene in soybean and its expression regulation mechanism.
Keywords:
PDF (1170KB)元数据多维度评价相关文章导出EndNote|Ris|Bibtex收藏本文
本文引用格式
曾健, 徐先超, 徐昱斐, 王秀成, 于海燕, 冯贝贝, 邢光南. 利用动态转录组学挖掘大豆百粒重候选基因. 作物学报, 2021, 47(11): 2121-2133 DOI:10.3724/SP.J.1006.2021.04249
ZENG Jian, XU Xian-Chao, XU Yu-Fei, WANG Xiu-Cheng, YU Hai-Yan, FENG Bei-Bei, XING Guang-Nan.
百粒重是影响大豆产量的重要性状, 遗传育种家常利用连锁定位和关联定位的方法从基因组水平解析大豆百粒重的遗传机制, 如Lu等[1]利用栽培大豆和野生大豆构建的重组自交系群体进行全基因组重测序及数量性状位点(quantitative trait locus, QTL)定位, 从野生大豆中克隆了1个控制大豆百粒重的基因PP2C-1; Li等[2]通过对大豆籽粒百粒重、粒长和粒宽的全基因组关联分析(genome-wide association study, GWAS)发现了1个新的控制籽粒大小的位点SW9-1。由于大豆百粒重性状具有复杂的遗传基础, 由多位点控制, 且在不同种植条件下表型变异大, 使得挖掘百粒重相关的基因比较困难。
随着测序技术的发展与测序成本的降低, 越来越多的基因组学、转录组学以及代谢组学方法被用来进行复杂生物学问题的研究, 其中以转录过程作为研究对象是最先发展且应用最广的组学技术, 如物种鉴定、种质资源挖掘、遗传多样性分析以及植物系统分类等方面[3]。然而, 随着越来越多的RNA测序(RNA sequencing, RNA-seq)数据被公布, 如何处理如此海量的数据, 挖掘出有用的信息成为了研究人员新的研究目标。RNA-seq最常用于分析2组样本间的差异表达基因(differential expression gene, DEG), 但是传统的成对比较不能有效反映所有样本的整体动态特性[4]。面对这个问题, 网络研究的方法脱颖而出, 如基因调控网络、蛋白调控网络和代谢网络等[5]。在基因调控网络中, 应用比较广泛的是加权基因共表达网络(weighted gene co-expression network analysis, WGCNA) [5]。加权基因共表达网络分析可以有效地利用大量转录组数据将全基因组的基因分类为不同的基因共表达模块, 然后进一步研究共表达模块与性状之间的相关性。该方法特别适合研究处于不同发育阶段的多个样品[6,7], 是研究多样本、大数据的高效方法。例如, Yang等[8]利用5个时期的大豆转录组数据构建加权基因共表达网络, 成功鉴定出一批与大豆油脂合成相关的基因。Lu等[9]利用栽培及野生大豆共40个转录组数据进行WGCNA, 鉴定出了1个限制赤霉素合成的基因GmGA20OX, 它调控大豆籽粒重量及大小。
通过RNA-seq数据不仅能检测基因表达量, 还可以检测基因的等位变异。等位变异常被用做分子标记研究复杂生物学问题。例如传统的GWAS基于全基因组重测序技术获取数以百万计位点的等位变异作为分子标记, 将其与表型关联从而鉴定与表型相关的基因座。GWAS是研究复杂表型遗传基础的有效手段, 但其总成本十分昂贵[10]。因而之后出现了简化测序技术, 如基因组测序之前用限制酶处理以及外显子组测序等[11]。RNA-seq也是降低基因组复杂性的一种经济有效的方法[11]。虽然基于RNA- seq的SNPs/InDels挖掘只能检测来自转录区域的变异信息, 但是大多数的来自转录区域的SNPs/InDels才是直接影响功能的变异[10,11]。并且基于RNA-seq挖掘特定区域(如转录区域)的SNPs/InDels能提供非常高深度的变异信息, 还能检测到高表达基因中低频的变异[10,11]。
随着大豆泛基因组公布[12], 为大豆育种提供了许多新的生物信息学资源。本研究利用泛基因组中公布的籽粒发育转录组数据, 结合品种间百粒重存在极显著差异的12个大豆品种的百粒重以及粒形数据, 通过转录组数据从WGCNA、基因差异表达分析以及SNPs/InDels挖掘3个方面分析这些品种不同时期的基因表达差异及其序列差异, 探索大豆百粒重基因表达调控机制, 以期挖掘出大豆百粒重特异相关模块、候选基因及其等位变异, 为进一步研究大豆百粒重及其他重要农艺性状分子机制提供新的思路。
1 材料与方法
1.1 供试材料及表型数据获取
供试大豆材料为晋豆23、邯豆5号、克山1号、齐黄34、丰地黄、铜山天鹅蛋、莒选23、Amsoy、东农50、十胜长叶、豫豆22和铁丰18, 以上材料由中国农业科学院作物科学研究所提供。试验于2018年6月15日和2019年6月17日在安徽省马鞍山市当涂县南京农业大学皖江基地(118°37′22″E, 31°33′4″N)进行, 行播, 每个品种2行, 行距50 cm, 行长2 m, 试验地四周种3行保护行。常规田间管理, 这12份品种在当涂县夏播都能正常成熟, 且熟期差异不太大, 2年分别为83~101 d和94~112 d。大豆品种成熟后, 每个品种随机选10个单株, 单株收获, 脱粒, 分单株测量籽粒性状。采用籽粒图像采集和计算机软件处理的方法[13]对籽粒粒形进行测定并计数粒数。丁琦等[13]使用良田高拍仪在LED背光板上对大豆籽粒图像进行采集, 基于分水岭和统计矩开发了测量大豆籽粒粒形的软件, 可获得粒数、粒长、粒宽、粒周长和粒面积等数据。用电子天平称其重量, 精确到千分之一, 用公式百粒重=粒重/粒数×100计算出百粒重。运用Excel 2010对获取的数据进行整理, 用SAS 9.4软件对2年数据进行联合方差分析和Duncan’s多重比较。
1.2 转录组数据的获取与加权基因共表达网络分析
大豆不同时期籽粒组织转录组数据来自Biological Project Library (BioProject,图1
 新窗口打开|下载原图ZIP|生成PPT
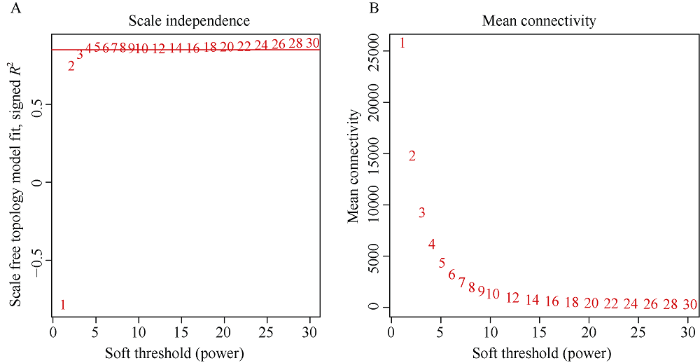
图1软阈值β的确定
A图纵坐标是无尺度网络模型指数, 红线代表R2=0.85。B图纵坐标每一个软阈值对应的平均连接度。图A和图B的横坐标均代表软阈值β。
Fig. 1Determination of soft threshold β
The ordinate represents the index of scale free network model in figure A, the red line represents that R2 is equal to 0.85. The ordinate represents the average link degree of each soft threshold in figure B. The abscissa in both figures A and B represent the soft threshold β.
1.3 基因差异表达分析
根据Duncan’s多重比较结果, 选择百粒重存在极显著差异的2组大豆品种, 分别对籽粒发育3个时期进行基因差异表达分析, 其中2年平均百粒重小于12 g的小粒品种组包括东农50、Amsoy和莒选23, 2年平均百粒重大于18 g的大粒品种组包括邯豆5号、晋豆23和克山1号。经HISAT2、StringTie和DESeq2处理得到DEGs, Padj<0.05, |log2 (Fold Change)| >1, Fold Change代表基因差异表达倍数。使用R中的clusterProfiler包计算Kyoto Encyclopedia of Genes and Genomes (KEGG)富集及结果可视化。1.4 SNPs/InDels挖掘
选择百粒重存在极显著差异的小粒品种东农50、Amsoy、莒选23与大粒品种邯豆5号、晋豆23、克山1号进行SNPs/InDels挖掘。参考Engström等[19]的建议, 首先使用STAR v2.5.3a[20]将reads比对到参考基因组Williams 82 v2.0上。SAMtools v1.6[21]软件构建索引, Picard Toolkit v2.22.0 (Table 1
表1
表1SNPs/InDels过滤标准
Table 1
| SNPs过滤标准 SNPs filter standards | InDels过滤标准 InDels filter standards |
|---|---|
| QualByDepth (QD) > 2.0 | QualByDepth (QD) > 2.0 |
| RMSMappingQuality (MQ) > 40.0 | — |
| FisherStrand (FS) < 60.0 | FisherStrand (FS) < 200.0 |
| StrandOddsRatio (SOR) < 3.0 | StrandOddsRatio (SOR) < 10.0 |
| MappingQualityRankSumTest (MQRankSum) > -12.5 | MappingQualityRankSumTest (MQRankSum) > -12.5 |
| ReadPosRankSumTest (ReadPosRankSum) > -8.0 | ReadPosRankSumTest (ReadPosRankSum) > -8.0 |
新窗口打开|下载CSV
1.5 驯化与选择
从SoyBase下载Davoud等[26]发布的1007份大豆(包含育成品种895份和地方品种112份)的重测序等位变异数据, 以及45份野生豆重测序数据(2 结果与分析
2.1 大豆品种间百粒重的变异
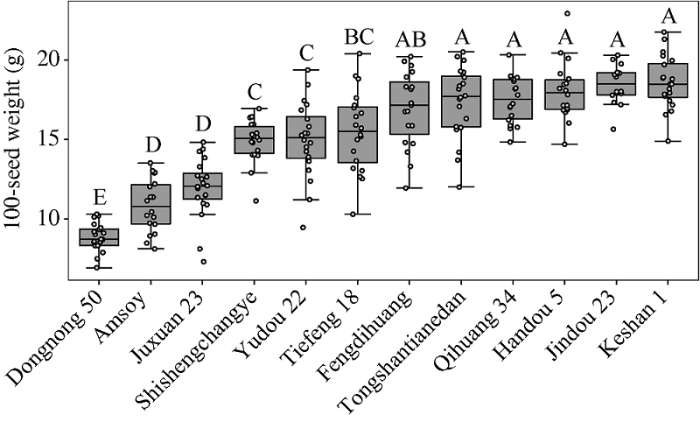
根据12个大豆品种百粒重的箱型图(图2)发现, 东农50、Amsoy、莒选23、十胜长叶、豫豆22和铁丰18为百粒重较小的品种; 丰地黄、铜山天鹅蛋、齐黄34、邯豆5号、晋豆23和克山1号为百粒重较大的品种。通过Duncan’s多重比较发现, 当P=0.01时, 东农50、Amsoy、莒选23和邯豆5号、晋豆23、克山1号的百粒重间存在极显著差异, 可分成小籽粒和大籽粒2组大豆品种。图2
 新窗口打开|下载原图ZIP|生成PPT
图212个大豆品种百粒重的箱型图
横坐标代
Fig. 2Box diagram of 100-seed weight of 12 soybean varieties
The abscissa represents 12 soybean varieties, and the ordinate represents the 100-seed weight. One point represents one observation. Soybean varieties with different uppercase letters are significantly different in 100-seed weight at P = 0.01 by Duncan’s new multiple-range test.
2.2 大豆籽粒发育的加权基因共表达网络分析
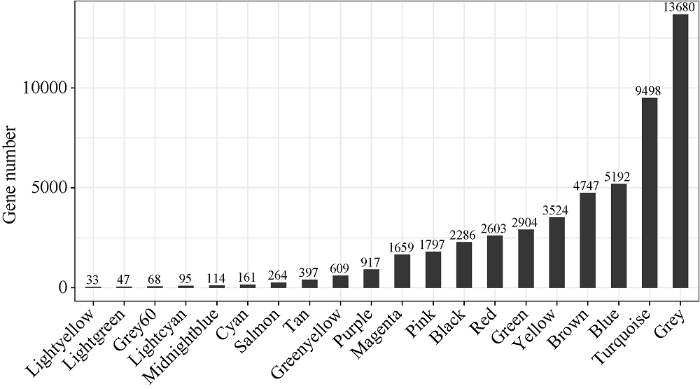
基于12个大豆品种3个籽粒发育时期共36个样本的转录组数据进行表达量分析, 获得50,595个基因的标准化表达矩阵。构建加权基因共表达网络后获得20个模块(图3), 模块内基因数量为33 (lightyellow)到13,680 (grey)个, 其中grey模块代表未分配到任何其他模块的基因。该模块内可能包含大量调控植物基本生命活动所必需的管家基因, 不随着时间和品种变化, 因而未能分配到其他共表达模块。图3
 新窗口打开|下载原图ZIP|生成PPT
图3模块内基因数目柱状图
横轴代表模块, 纵轴代表模块内基因数目。
Fig. 3Histogram of the number of genes in modules
The abscissa represents the module and the ordinate represents the number of genes in the module.
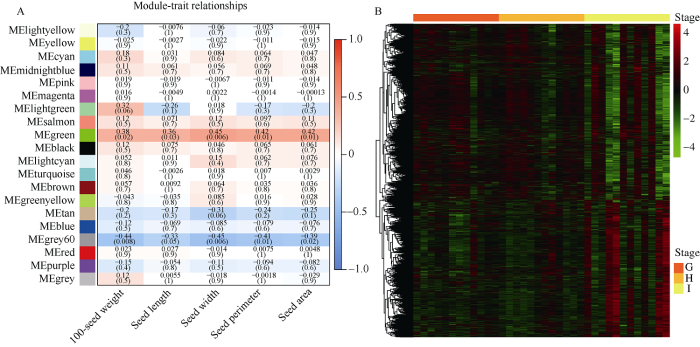
通过百粒重及粒形相关性状与模块的关联发现, green模块与5个籽粒性状均有显著关联(P<0.05) (图4-A)。根据聚类热图, green模块内2904个基因可以分为2类, 当第一类的基因在大豆发育过程中高表达时, 另一类别则显示出较低的表达, 反之亦然(图4-B), 这可能暗示green模块内基因的正负调节关系。
图4
 新窗口打开|下载原图ZIP|生成PPT
图4模块与性状关联热图(A)及green模块内2904个基因的表达量热图(B)
A图中横轴表示百粒重及粒形性状, 纵轴表示每一个模块的特征向量; 红色的格子代表性状与模块具有正相关性, 蓝色的格子代表性状与模块具有负相关性。B: green模块内2904个基因在12个大豆品种3个时期表达量行标准化后绘制。G、H和I分别为籽粒发育前期、中期和后期。
Fig. 4Heat map of module-trait relationships (A) and gene expression count of 2904 genes in green module (B)
The horizontal axis represents 100-seed weight and seed shape traits, and each column represents the co-expression module in the figure A; red color of each box represents the positive correlation between module and trait, blue color of each box represents the negative relationships between module and trait. B: 2904 genes in the green module are mapped after normalization of the expression levels by row of 12 soybean varieties in three stages. G, H, and I represent the early stage, the middle stage, and the later stage of seed development, respectively.
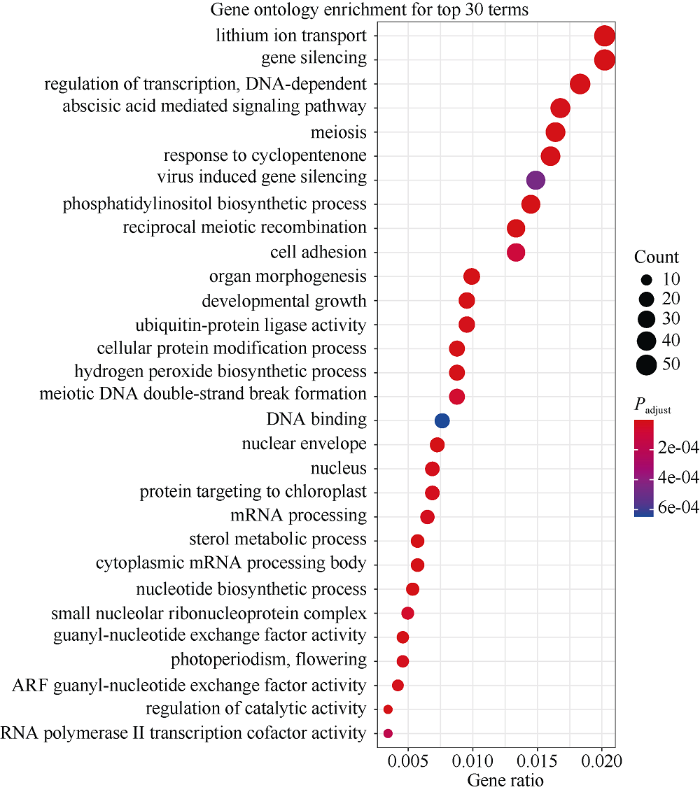
GO富集结果显示, green模块内显著富集到与发育相关的生物功能, 如脱落酸介导的信号通路(GO:0002679)、器官形态发生(GO:0010089)以及发育性生长(GO:0007346)等。并且发现green模块内显著富集的基因大多与基因沉默、转录和转录调控(包括依赖DNA的转录调控、mRNA加工、DNA结合、胞质mRNA加工体和RNA聚合酶II转录辅因子活性等)以及细胞蛋白的降解修饰等相关(图5), 这可能暗示这些GO Terms在大豆籽粒生长发育过程中发挥了重要作用。
图5
 新窗口打开|下载原图ZIP|生成PPT
图5green模块内2904个基因的GO富集
横坐标(每列)代表富集基因占输入基因比例, 纵坐标(每行)代表GO Terms。点的大小代表富集的基因个数, 点的颜色代表经费舍尔精确测验矫正后的Padjust值。
Fig. 5GO enrichment of 2904 genes in green module
The abscissa (each column) represents the proportion of enriched genes to input genes, and the ordinate (each row) corresponds to GO Terms. The size of the dot represents the number of enriched genes, and the color of the dot represents the corrected Padjust value by the Fisher exact test.
2.3 不同百粒重大豆品种组间籽粒发育时期的基因差异表达
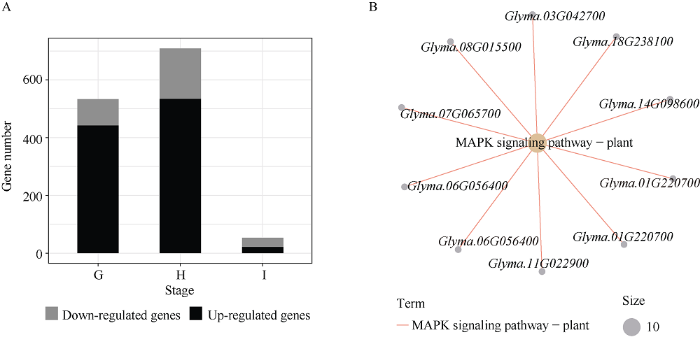
通过对2组百粒重存在极显著差异的大豆品种分3个时期进行基因差异表达分析发现, 差异表达基因集中在籽粒发育前期和中期, 籽粒发育后期基因差异表达数目明显减少。其中前期G有533个基因差异表达, 相比大百粒重组品种, 小百粒重品种组中442个基因上调, 91个基因下调; 中期H有709个基因差异表达, 小百粒重组中534个基因上调, 175个基因下调; 后期I有53个基因差异表达, 小百粒重组中21个基因上调, 32个基因下调(图6-A)。3个时期中上调基因共961个, 下调基因共284个, 上调基因没有显著富集到任何KEGG通路, 而下调基因仅显著富集到植物MAPK信号通路(图6-B)。图6
 新窗口打开|下载原图ZIP|生成PPT
图6百粒重存在极显著差异的2组大豆品种籽粒发育不同时期基因的表达差异(A)及小粒品种下调基因的MAPK信号通路富集图(B)
G、H和I分别代表籽粒发育前期、中期和后期。Down-regulated genes代表小粒品种中下调的基因, Up-regulated genes代表小粒品种中上调的基因。
Fig. 6Gene expression differences in different stages of seed development between two panels of soybean varieties with extremely significant differences in 100-seed weight (A) and KEGG pathway enrichment map of down-regulated genes in small 100-seed weight varieties (B)
G, H, and I represent the early stage, the middle stage, and the later stage of seed development, respectively. Down-regulated genes represent down-regulated genes in small 100-seed weight varieties, and up-regulated genes represent up-regulated genes in small 100-seed weight varieties.
2.4 与大豆百粒重相关的核心基因和差异表达基因
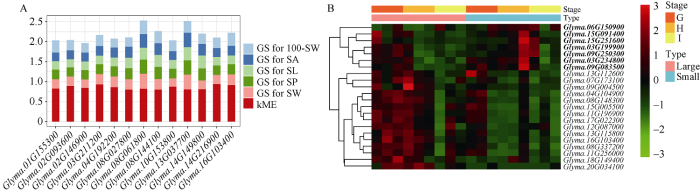
根据基因与5个性状的GS值(大于0.2)和与green模块的kME值(大于0.8), 共筛选到green模块内的13个hub基因(图7-A)。同时, green模块内存在22个DEGs, 通过聚类热图发现, 这22个DEGs在百粒重存在极显著差异的2组大豆品种中的表达模式分为2种。第1种包含7个DEGs, 其在小粒品种籽粒发育中期显著上调表达(图7-B)。第2种包含15个DEGs, 它们在大粒品种籽粒发育的前中期显著上调表达(图7-B)。其中Glyma.16G103400同时属于hub基因和DEGs。图7
 新窗口打开|下载原图ZIP|生成PPT
图7green模块内hub基因GS值和kME值的柱形图(A)及不同百粒重大豆品种组间差异表达基因的表达量聚类热图(B)
100-SW: 百粒重; SA: 籽粒面积; SL: 籽粒长度; SP: 籽粒周长; SW: 籽粒宽度。G、H和I分别代表籽粒发育前期、中期和后期。Large和Small分别代表P = 0.01差异极显著的大粒大豆和小粒大豆品种组。图B中加粗的基因代表第1种表达模式的基因。
Fig. 7Histogram of GS and kME value of hub gene in green module (A) and cluster heat map of differentially expressed genes among soybean varieties with different 100-seed weight (B)
100-SW: 100-seed weight; SA: seed area; SL: seed length; SP: seed perimeter; SW: seed width. G, H, and I represent the early stage, the middle stage, and the later stage of seed development, respectively. Large and Small represent large soybean varieties and small soybean varieties panel at P = 0.01, respectively. Gene in bold represents the first expression pattern in figure B.
2.5 不同百粒重大豆品种组间SNPs/InDels挖掘
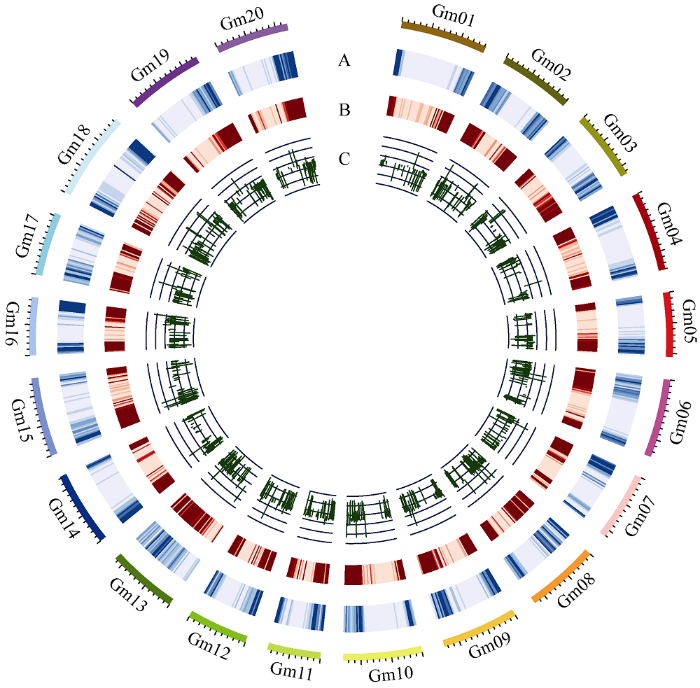
为进一步揭示green模块内基因表达调控机制, 用百粒重差异极显著的2组大豆品种进行SNPs/ InDels挖掘, 共检测到52,395个SNPs和6713个InDels, 且发现DEGs与SNPs/InDels大致位于染色体相同区域(图8)。其中SNPs主要分布于基因外显子区域, 但大多造成同义突变, InDels主要分布于基因上下游区域(表2)。在大粒和小粒2组大豆品种的组间共发现10个非同义突变SNPs位于green模块的10个基因内(表3)。图8
 新窗口打开|下载原图ZIP|生成PPT
图8SNPs/InDels及DEGs在大豆染色体的分布图
A: SNPs密度; B: InDels密度; C: log2 (Fold Change) of DEGs, 内圈为在小粒品种组中显著上调基因, 外圈为下调基因。
Fig. 8Distribution map of SNPs/InDels and DEGs on soybean chromosomes
A: SNPs density; B: InDels density; C: log2 (Fold Change) of DEGs. The inner circle represents significantly up-regulated genes in small 100-seed weight varieties, and the outer circle represents significantly down-regulated genes in small 100-seed weight varieties.
Table 2
表2
表2SNPs/InDels分布区域
Table 2
| 变异位置 Variation region | SNPs | InDels | ||
|---|---|---|---|---|
| 数目 Count | 比例 Percentage (%) | 数目 Count | 比例 Percentage (%) | |
| DOWNSTREAM | 41,636 | 23.67 | 5788 | 26.22 |
| EXON | 72,950 | 41.48 | 3028 | 13.72 |
| INTERGENIC | 2100 | 1.19 | 424 | 1.92 |
| INTRON | 8576 | 4.88 | 1625 | 7.36 |
| SPLICE_SITE_ACCEPTOR | 31 | 0.02 | 11 | 0.05 |
| SPLICE_SITE_DONOR | 31 | 0.02 | 12 | 0.05 |
| SPLICE_SITE_REGION | 334 | 0.19 | 69 | 0.31 |
| TRANSCRIPT | — | — | 1 | 0.01 |
| UPSTREAM | 29,780 | 16.93 | 4128 | 18.70 |
| UTR_3_PRIME | 14,683 | 8.35 | 4400 | 19.94 |
| UTR_5_PRIME | 5749 | 3.27 | 2586 | 11.72 |
新窗口打开|下载CSV
Table 3
表3
表3Green模块内在大粒和小粒品种组间存在非同义SNP突变的10个基因
Table 3
| 基因 Gene | 染色体 Chromosome | 位置 Position | 小粒品种组等位变异 Allele of small 100-SW | 大粒品种组等位变异 Allele of large 100-SW |
|---|---|---|---|---|
| Glyma.02G139500 | Gm02 | 14480344 | G | A |
| Glyma.02G140100 | Gm02 | 14531600 | T | C |
| Glyma.06G179600 | Gm06 | 15246959 | A | G |
| Glyma.07G018200 | Gm07 | 1456246 | A | G |
| Glyma.12G057100 | Gm12 | 4156207 | T | C |
| Glyma.14G043900 | Gm14 | 3335050 | T | C |
| Glyma.15G217400 | Gm15 | 35930038 | A | T |
| Glyma.17G071400 | Gm17 | 5580413 | A | G |
| Glyma.17G076400 | Gm17 | 5974992 | C | T |
| Glyma.18G237000 | Gm18 | 52573168 | T | C |
新窗口打开|下载CSV
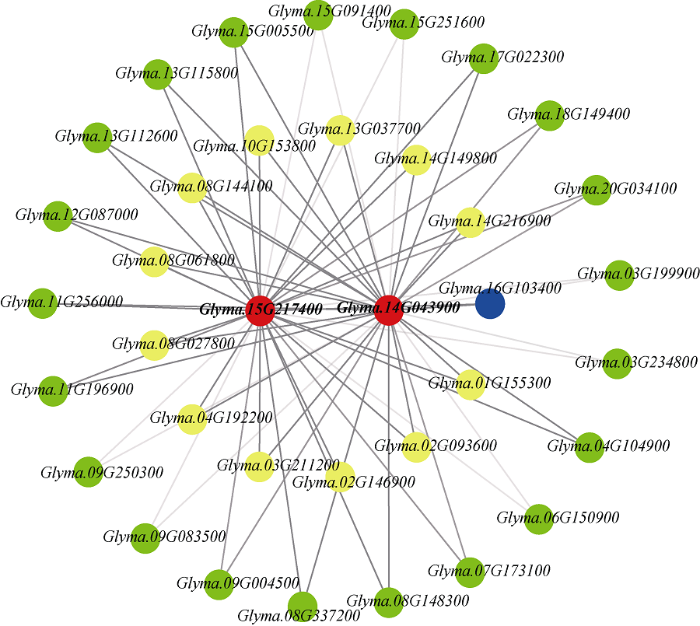
根据GO注释发现, 其中Glyma.14G043900与转录调控相关, Glyma.15G217400与3°UTR介导的mRNA稳定调控相关(表4), 并且Glyma.14G043900和Glyma.15G217400内均存在锌指结构域。Glyma.14G043900内非同义突变发生在锌指结构域外部, 可能会影响该基因的转录, 而Glyma. 15G217400内非同义突变发生在锌指结构域内部, 可能对该基因功能造成影响。基于基因共表达网络关系发现, green模块内的13个hub基因和22个DEGs与这2个基因存在共表达关系(图9)。其中, 13个hub基因及在大粒品种籽粒发育前中期显著上调表达的15个DEGs与这2个基因间weight大于0.1, 而在小粒品种籽粒发育中期显著上调表达的7个DEGs与这2个基因的weight值小于0.1但大于0.01。基于Glyma.14G043900和Glyma.15G217400的GO注释, 及其在2组大豆品种间的非同义突变, 及其与hub基因和DEGs的共表达关系, 推测其可能是控制大豆百粒重的候选基因。
Table 4
表4
表4候选基因Glyma.14G043900和Glyma.15G217400的GO注释
Table 4
| 基因 Gene | GO编号 GO ID | GO类型 GO type | 注释描述 Annotation description |
|---|---|---|---|
| Glyma.14G043900 | GO:0006355 | 生物过程 Biological process | 以DNA为模板的转录调控 Regulation of transcription, DNA-templated |
| GO:0008270 | 分子功能 Molecular function | 锌离子结合 Zinc ion binding | |
| Glyma.15G217400 | GO:0061158 | 生物过程 Biological process | 3'端非翻译区介导的mRNA失稳 3'-UTR-mediated mRNA destabilization |
| GO:0005829 | 细胞组分 Cellular component | 胞质溶胶 Cytosol | |
| GO:0003730 | 分子功能 Molecular function | mRNA 3'端非翻译区结合 mRNA 3'-UTR binding | |
| GO:0046872 | 分子功能 Molecular function | 金属离子结合 Metal ion binding |
新窗口打开|下载CSV
图9
 新窗口打开|下载原图ZIP|生成PPT
图9green模块内候选基因、hub基因以及差异表达基因的共表达网络
红色点代表候选基因, 黄色点代表hub基因, 绿色点代表DEGs, 蓝色点代表既是DEGs同时又是hub基因。线的颜色深浅代表基因间的weight值大小。黑色的线代表基因间的weight大于0.1, 灰色线代表基因间的weight小于0.1但大于0.01。
Fig. 9Co-expression network of candidate genes, hub genes, and differentially expressed genes in the green module
Red dots represent candidate genes, yellow dots represent hub genes, green dots represent DEGs, and blue dot represents both DEG and hub gene. The color of the line represents the weight value between genes. Black line represents the weight between genes greater than 0.1, and gray line represents the weight less than 0.1 but greater than 0.01.
2.6 候选基因的驯化和人工选择
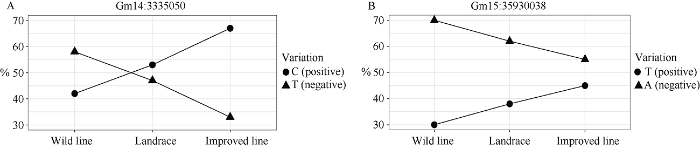
通过比对公共数据库的1052份大豆SNP变异信息发现, green模块中的Glyma.14G043900内Gm14:3335050和Glyma.15G217400内Gm15: 35930038存在非同义SNP变异(表3), 其中Gm14: 3335050位点的百粒重增效等位变异(C)频率从野生大豆42%到地方品种57%再到育成品种67%的过程中明显上升(图10)。Gm15:35930038位点的百粒重增效等位变异(T)频率从野生大豆30%到地方品种38%再到育成品种45%的过程中也持续上升。图10
 新窗口打开|下载原图ZIP|生成PPT
图10不同大豆类型中Glyma.14G043900和Glyma.15G217400非同义SNP突变等位变异的频率变化
圆点代表百粒重的增效等位变异, 而三角形代表百粒重的减效等位变异。
Fig. 10Allele percentage line chart of two non-synonymous_coding SNP mutant of Glyma.14G043900 and Glyma.15G217400 in different soybean types
The dots represent the positive effect alleles of 100-seed weight, and the triangles represent the negative effect alleles of 100-seed weight.
并且Glyma.14G043900内Gm14:3335660还存在同义突变, 其对应的百粒重增效等位变异(T)频率从野生大豆45%增加到地方品种100%和育成品种99%。Glyma.15G217400内Gm15:35914738、Gm15: 35914891及Gm15:35920369三个位点也存在同义突变, 其中Gm15:35914738信息在野生大豆中未查询到, 但其增效等位变异(C)频率从地方品种的10%增加到育成品种20%, Gm15:35914891位点的百粒重增效等位变异(T)频率从野生大豆10%增加到地方品种14%和育成品种19%, Gm15:35920369位点的百粒重增效等位变异(T)频率从野生大豆10%增加到地方品种15%和育成品种22%。从野生大豆到地方品种再到育成品种的非同义和同义SNP等位变异频率变化都说明这2个基因受到了明显的驯化和人工选择, 特别是Glyma.14G043900。
3 讨论
3.1 大豆百粒重及籽粒性状的加权基因共表达网络分析
通过构建加权基因共表达网络获得了20个基因共表达模块, 将百粒重及粒形性状与共表达模块关联, 发现green模块与这5个性状都显著相关(P<0.05)。由于green模块内基因的共表达且与5个籽粒性状密切相关, 因此green模块内显著富集的GO Terms可能与粒重及粒形密切相关。在这些GO Terms中, 脱落酸信号通路(GO:0002679)介导种子成熟过程, 成熟后期休眠诱导取决于强脱落酸信号, 且在拟南芥中脱落酸信号通路还通过HAIKU途径调节胚乳发育来控制种子大小[27,28]。此外, 几种转录调节因子已被确定为植物种子大小控制的重要因素, 包括转录因子、转录共激活因子和参与染色质修饰的调控因子[27], 如APETALA2型转录因子SMALL ORGAN SIZE1 (SMOS1)调控水稻籽粒大小[27,29]; WRKY家族转录因子WRKY15a的表达水平与野生大豆和栽培大豆的种子大小变化相关[27,30]。加权基因共表达网络模块中, 代表基因和性状相关性的GS值以及基因和模块相关性的kME值可以有效筛选hub基因[8]。本研究根据GS值和kME值确定了与5个籽粒性状高度相关的13个hub基因, 它们大多与转录、调控、蛋白质结合、氧化还原酶活性和生长素激活的信号通路等GO Terms相关, 并且已有研究表明这些GO Terms在调控种子大小过程起到重要作用[27,31-32]。由于材料的遗传背景不同以及种植条件等因素, 影响大豆百粒重的基因PP2C-1[1]和GmGA20OX[9]未分类到green模块。3.2 不同百粒重大豆品种组间基因差异表达分析
3个不同熟期大豆品种的干物质积累都呈S型曲线变化, 籽粒形成期干物质始终是增长的, 都是在前期增长速率较快, 大部分干物质是在发育初期所积累[33]。本研究选取种子发育阶段的3个不同时期包含了影响大豆百粒重的关键时期, 百粒重存在极显著差异的大豆品种组间籽粒的差异表达基因主要集中在籽粒发育前中期, 说明前中期是大豆籽粒发育积累营养物质的主要时期。在KEGG富集中, 小百粒重品种组中的上调基因没有富集到显著的KEGG通路, 下调基因仅在植物中MAPK信号通路显著富集。有研究表明MAPK信号通路在拟南芥和水稻种子形成过程对种子大小中起重要作用[27,31]。例如在水稻中, OsMKKK10、OsMKK4和OsMAPK6充当级联调节谷物大小[34]。KEGG富集结果表明, MAPK信号通路可能也在大豆籽粒发育中调控籽粒大小。3.3 大豆百粒重的候选基因
本研究基于2组百粒重存在极显著差异的大豆品种发现, 10个green模块中存在非同义突变的基因。根据GO注释, 10个基因中, Glyma.14G043900存在依赖DNA的转录调控GO Term (GO:0006355), 说明该基因发生的非同义突变可能造成转录调控功能受到影响; Glyma.15G217400存在3°UTR介导使mRNA不稳定的GO Term (GO:0061158), 说明该基因可能与UTR介导的基因表达调控过程相关[35]。且Glyma.15G217400位于已经报道的控制粒重的4个QTL中(SoyBase编号为Seed weight 2-3[36]、Seed weight 6-1[37]、Seed weight 32-2[38]和Seed weight 49- 11[39]), 而Glyma.14G043900虽然没有位于粒重及粒形性状QTL中, 但它位于一个籽粒油脂含量QTL (SoyBase编号为Seed oil 45-6[40])以及蛋白含量QTL (SoyBase编号为Seed protein 45-1[40])中。在green模块的共表达网络中, Glyma.14G043900和Glyma. 15G217400与13个hub基因及green模块中第2种表达模式的15个DEGs (即在大粒品种组中显著上调表达的DEGs)存在强共表达, 这暗示了它们之间的表达调控关系。并且根据已公布的1052份大豆SNP变异数据发现, Glyma.14G043900和Glyma. 15G217400对应的非同义突变位点Gm14:3335050和Gm15:35930038以及同义突变位点Gm14: 3335660、Gm15:35914891和Gm15: 35920369中, 百粒重增效等位变异从野生大豆到地方品种, 再到育成品种的过程中整体呈现上升趋势, 可能暗示这2个位点的等位变异频率受到了人为的驯化和人工改良选择。百粒重是影响大豆产量的重要性状, 本研究发掘出的百粒重候选基因可用于预测大豆百粒重, SNP可用于开发KASP标记, 从而为选育适合不同用途的大豆品种如小粒豆芽专用品种和大粒菜用大豆品种提供依据与标记。4 结论
利用WGCNA、基因差异表达分析及SNPs/ InDels挖掘, 共发现36个基因可能参与调控大豆百粒重。其中Glyma.14G043900和Glyma.15G217400在大粒和小粒品种组间存在同义及非同义突变, 可能通过调控hub基因以及DEGs调控大豆百粒重及粒形相关性状, 且这2个基因受到了驯化和人工改良选择, 因而可能是大豆百粒重的重要候选基因。本研究结果可为后续解析大豆百粒重发育及调控机制提供重要的试验数据和理论基础。参考文献 原文顺序
文献年度倒序
文中引用次数倒序
被引期刊影响因子
DOIURL [本文引用: 2]
DOIURL [本文引用: 1]
[本文引用: 1]
[本文引用: 1]
DOIURL [本文引用: 1]
[本文引用: 2]
[本文引用: 2]
PMID [本文引用: 1]

Flowers are reproductive organs and precursors to fruits and seeds. While the basic tenets of the ABCE model of flower development are conserved in angiosperms, different flowering plants exhibit different and sometimes unique characteristics. A distinct feature of strawberry (Fragaria spp.) flowers is the development of several hundreds of individual apocarpous (unfused) carpels. These individual carpels are arranged in a spiral pattern on the subtending stem tip, the receptacle. Therefore, the receptacle is an integral part of the strawberry flower and is of significant agronomic importance, being the precursor to strawberry fruit. Taking advantage of next-generation sequencing and laser capture microdissection, we generated different tissue- and stage-transcriptomic profiling of woodland strawberry (Fragaria vesca) flower development. Using pairwise comparisons and weighted gene coexpression network analysis, we identified modules of coexpressed genes and hub genes of tissue-specific networks. Of particular importance is the discovery of a developing receptacle-specific module exhibiting similar molecular features to those of young floral meristems. The strawberry homologs of a number of meristem regulators, including LOST MERISTEM and WUSCHEL, are identified as hub genes operating in the developing receptacle network. Furthermore, almost 25% of the F-box genes in the genome are transiently induced in developing anthers at the meiosis stage, indicating active protein degradation. Together, this work provides important insights into the molecular networks underlying strawberry's unique reproductive developmental processes. This extensive floral transcriptome data set is publicly available and can be readily queried at the project Web site, serving as an important genomic resource for the plant biology research community.© 2014 American Society of Plant Biologists. All Rights Reserved.
DOIURL [本文引用: 1]
DOIURL [本文引用: 2]
DOIURL [本文引用: 2]
[本文引用: 3]
DOIPMID [本文引用: 4]
BackgroudPopulus nigra is a major tree species of ecological and economic importance for which several initiatives have been set up to create genomic resources. In order to access the large number of Single Nucleotide Polymorphisms (SNPs) typically needed to carry out a genome scan, the present study aimed at evaluating RNA sequencing as a tool to discover and type SNPs in genes within natural populations of P. nigra.ResultsWe have devised a bioinformatics pipeline to call and type SNPs from RNAseq reads and applied it to P. nigra transcriptomic data. The accuracy of the resulting RNAseq-based SNP calling and typing has been evaluated by (i) comparing their position and alleles to those previously reported in candidate genes, (ii) assessing their genotyping accuracy with respect to a previously available SNP chip and (iii) evaluating their inter-annual repeatability. We found that a combination of several callers yields a good compromise between the number of variants type and the accuracy of genotyping. We further used the resulting genotypic data to carry out basic genetic analyses whose results confirm the quality of the RNAseq-based SNP dataset.ConclusionsWe demonstrated the potential and accuracy of RNAseq as an efficient way to genotype SNPs in P. nigra. These results open prospects towards the use of this technology for quantitative and population genomics studies.
DOIURL [本文引用: 2]
[本文引用: 2]
[本文引用: 2]
DOIURL [本文引用: 1]
PMID [本文引用: 1]
In comparative high-throughput sequencing assays, a fundamental task is the analysis of count data, such as read counts per gene in RNA-seq, for evidence of systematic changes across experimental conditions. Small replicate numbers, discreteness, large dynamic range and the presence of outliers require a suitable statistical approach. We present DESeq2, a method for differential analysis of count data, using shrinkage estimation for dispersions and fold changes to improve stability and interpretability of estimates. This enables a more quantitative analysis focused on the strength rather than the mere presence of differential expression. The DESeq2 package is available at http://www.bioconductor.org/packages/release/bioc/html/DESeq2.html webcite.
DOIURL [本文引用: 1]
DOIURL [本文引用: 1]
DOIURL [本文引用: 1]
DOIPMID [本文引用: 1]
High-throughput RNA sequencing is an increasingly accessible method for studying gene structure and activity on a genome-wide scale. A critical step in RNA-seq data analysis is the alignment of partial transcript reads to a reference genome sequence. To assess the performance of current mapping software, we invited developers of RNA-seq aligners to process four large human and mouse RNA-seq data sets. In total, we compared 26 mapping protocols based on 11 programs and pipelines and found major performance differences between methods on numerous benchmarks, including alignment yield, basewise accuracy, mismatch and gap placement, exon junction discovery and suitability of alignments for transcript reconstruction. We observed concordant results on real and simulated RNA-seq data, confirming the relevance of the metrics employed. Future developments in RNA-seq alignment methods would benefit from improved placement of multimapped reads, balanced utilization of existing gene annotation and a reduced false discovery rate for splice junctions.
DOIPMID [本文引用: 1]
Accurate alignment of high-throughput RNA-seq data is a challenging and yet unsolved problem because of the non-contiguous transcript structure, relatively short read lengths and constantly increasing throughput of the sequencing technologies. Currently available RNA-seq aligners suffer from high mapping error rates, low mapping speed, read length limitation and mapping biases.To align our large (>80 billon reads) ENCODE Transcriptome RNA-seq dataset, we developed the Spliced Transcripts Alignment to a Reference (STAR) software based on a previously undescribed RNA-seq alignment algorithm that uses sequential maximum mappable seed search in uncompressed suffix arrays followed by seed clustering and stitching procedure. STAR outperforms other aligners by a factor of >50 in mapping speed, aligning to the human genome 550 million 2 × 76 bp paired-end reads per hour on a modest 12-core server, while at the same time improving alignment sensitivity and precision. In addition to unbiased de novo detection of canonical junctions, STAR can discover non-canonical splices and chimeric (fusion) transcripts, and is also capable of mapping full-length RNA sequences. Using Roche 454 sequencing of reverse transcription polymerase chain reaction amplicons, we experimentally validated 1960 novel intergenic splice junctions with an 80-90% success rate, corroborating the high precision of the STAR mapping strategy.STAR is implemented as a standalone C++ code. STAR is free open source software distributed under GPLv3 license and can be downloaded from http://code.google.com/p/rna-star/.
DOIURL [本文引用: 1]
DOIURL [本文引用: 1]
DOIURL [本文引用: 1]
DOIPMID [本文引用: 1]
We describe a new computer program, SnpEff, for rapidly categorizing the effects of variants in genome sequences. Once a genome is sequenced, SnpEff annotates variants based on their genomic locations and predicts coding effects. Annotated genomic locations include intronic, untranslated region, upstream, downstream, splice site, or intergenic regions. Coding effects such as synonymous or non-synonymous amino acid replacement, start codon gains or losses, stop codon gains or losses, or frame shifts can be predicted. Here the use of SnpEff is illustrated by annotating ~356,660 candidate SNPs in ~117 Mb unique sequences, representing a substitution rate of ~1/305 nucleotides, between the Drosophila melanogaster w(1118); iso-2; iso-3 strain and the reference y(1); cn(1) bw(1) sp(1) strain. We show that ~15,842 SNPs are synonymous and ~4,467 SNPs are non-synonymous (N/S ~0.28). The remaining SNPs are in other categories, such as stop codon gains (38 SNPs), stop codon losses (8 SNPs), and start codon gains (297 SNPs) in the 5'UTR. We found, as expected, that the SNP frequency is proportional to the recombination frequency (i.e., highest in the middle of chromosome arms). We also found that start-gain or stop-lost SNPs in Drosophila melanogaster often result in additions of N-terminal or C-terminal amino acids that are conserved in other Drosophila species. It appears that the 5' and 3' UTRs are reservoirs for genetic variations that changes the termini of proteins during evolution of the Drosophila genus. As genome sequencing is becoming inexpensive and routine, SnpEff enables rapid analyses of whole-genome sequencing data to be performed by an individual laboratory.
DOIPMID [本文引用: 1]
We created a visualization tool called Circos to facilitate the identification and analysis of similarities and differences arising from comparisons of genomes. Our tool is effective in displaying variation in genome structure and, generally, any other kind of positional relationships between genomic intervals. Such data are routinely produced by sequence alignments, hybridization arrays, genome mapping, and genotyping studies. Circos uses a circular ideogram layout to facilitate the display of relationships between pairs of positions by the use of ribbons, which encode the position, size, and orientation of related genomic elements. Circos is capable of displaying data as scatter, line, and histogram plots, heat maps, tiles, connectors, and text. Bitmap or vector images can be created from GFF-style data inputs and hierarchical configuration files, which can be easily generated by automated tools, making Circos suitable for rapid deployment in data analysis and reporting pipelines.
DOIURL [本文引用: 1]
DOIURL [本文引用: 6]
DOIURL [本文引用: 1]
DOIPMID [本文引用: 1]
The organ size of flowering plants is determined by two post-embryonic developmental events: cell proliferation and cell expansion. In this study, we identified a new rice loss-of-function mutant, small organ size1 (smos1), that decreases the final size of various organs due to decreased cell size and abnormal microtubule orientation. SMOS1 encodes an unusual APETALA2 (AP2)-type transcription factor with an imperfect AP2 domain, and its product belongs to the basal AINTEGUMENTA (ANT) lineage, including WRINKLED1 (WRI1) and ADAP. SMOS1 expression was induced by exogenous auxin treatment, and the auxin response element (AuxRE) of the SMOS1 promoter acts as a cis-motif through interaction with auxin response factor (ARF). Furthermore, a functional fluorophore-tagged SMOS1 was localized to the nucleus, supporting the role of SMOS1 as a transcriptional regulator for organ size control. Microarray analysis showed that the smos1 mutation represses expression of several genes involved in microtubule-based movement and DNA replication. Among the down-regulated genes, we demonstrated by gel-shift and chromatin immunoprecipitation (ChIP) experiments that OsPHI-1, which is involved in cell expansion, is a target of SMOS1. SMOS1 homologs in early-diverged land plants partially rescued the smos1 phenotype of rice. We propose that SMOS1 acts as an auxin-dependent regulator for cell expansion during organ size control, and that its function is conserved among land plants.
DOIURL [本文引用: 1]
DOIURL [本文引用: 2]
DOIURL [本文引用: 1]
[本文引用: 1]
[本文引用: 1]
DOIURL [本文引用: 1]
DOIPMID [本文引用: 1]
Throughout their lives, plants sense many developmental and environmental stimuli, and activation of optimal responses against these stimuli requires extensive transcriptional reprogramming. To facilitate this activation, plant mRNA contains untranslated regions (UTRs) that significantly increase the coding capacity of the genome by producing multiple mRNA variants from the same gene. In this review we compare UTRs of arabidopsis (Arabidopsis thaliana) and rice (Oryza sativum) at the genome scale to highlight their complexity in crop plants. We discuss different modes of UTR-based regulation with emphasis on genes that regulate multiple plant processes, including flowering, stress responses, and nutrient homeostasis. We demonstrate functional specificity in genes with variable UTR length and propose future research directions.Copyright © 2017 Elsevier Ltd. All rights reserved.
DOIPMID [本文引用: 1]
Seed weight (SW) is a component of soybean, Glycine max (L.) Merr., seed yield, as well as an important trait for food-type soybeans. Two soybean populations, 120 F4-derived lines of 'Young'xPI416937 (Pop1) and 111 F2-derived lines of PI97100x'Coker 237' (Pop2), were mapped with RFLP makers to identify quantitative trait loci (QTLs) conditioning SW across environments and populations. The genetic map of Pop1 consisted of 155 loci covering 973 cM, whereas Pop2 involved 153 loci and covered 1600 cM of map distance. For Pop1, the phenotypic data were collected from Plains, GA., Windblow, N.C., and Plymouth, N.C., in 1994. For Pop2, data were collected from Athens, GA., in 1994 and 1995, and Blackville, S.C., in 1995. Based on single-factor analysis of variance (ANOVA), seven and nine independent loci were associated with SW in Pop1 and Pop2, respectively. Together the loci explained 73% of the variability in SW in Pop1 and 74% in Pop2. Transgressive segregation occurred among the progeny in both populations. The marker loci associated with SW were highly consistent across environments and years. Two QTLs on linkage group (LG) F and K were located at similar genomic regions in both populations. The high consistency of QTLs across environments indicates that effective marker-assisted selection is feasible for soybean SW.
DOIURL [本文引用: 1]
[本文引用: 1]
DOIPMID [本文引用: 1]
At harvest traits such as seed weight are the sum of development and responses to stresses over the growing season and particularly during the reproductive phase of growth. The aim here was to measure quantitative trait loci (QTL) underlying the seed weight from early development to drying post harvest. One hundred forty-three F(5) derived recombinant inbred lines (RILs) developed from the cross of soybean cultivars 'Charleston' and 'Dongnong 594' were used for the analysis of QTL underlying mean 100-seed weight at six different developmental stages. QTL x Environment interactions (QE) were analyzed by a mixed genetic mode based on 3 years' data. At an experiment-wise threshold of a=0.05 and by single-point analysis 94 QTL unaffected by QE underlay the mean seed weight at different developmental stages. Sixty-eight QTL affected by QE that also underlay mean seed weight were identified. From the 162 QTL 42 could be located on 12 linkage groups by composite interval mapping (LOD>2.0). The numbers, locations and types of the QTL and the genetic effects were different at each developmental stage. On linkage group C2 the distantly linked QTL swC2-1, swC2-2 and swC2-3 each affected mean seed weight throughout the different developmental stages. The DNA markers linked to the QTL possessed potential for use in marker-assisted selection for soybean seed size. The identification of QTL with genetic main effects and QE interaction effects suggested that such interactions might significantly alter seed weight during seed development.
DOIURL [本文引用: 2]
