 ,1,3,**, 张勇2,**, 苏伯鸿1,3,**, Lamlom F Sobhi3,4, 邱丽娟,3,*
Development of molecular markers and fine mapping of qBN-18 locus related to branch number in soybean (Glycine max L.)
WU Hai-Tao,1,3,**, ZHANG Yong2,**, SU Bo-Hong1,3,**, Lamlom F Sobhi3,4, QIU Li-Juan,3,*通讯作者:
收稿日期:2020-02-25接受日期:2020-06-2网络出版日期:2020-11-12
| 基金资助: |
Received:2020-02-25Accepted:2020-06-2Online:2020-11-12
| Fund supported: |
作者简介 About authors
吴海涛, E-mail:

摘要
关键词:
Abstract
Keywords:
PDF (1228KB)元数据多维度评价相关文章导出EndNote|Ris|Bibtex收藏本文
本文引用格式
吴海涛, 张勇, 苏伯鸿, Lamlom F Sobhi, 邱丽娟. 大豆分枝数相关分子标记开发及qBN-18位点精细定位[J]. 作物学报, 2020, 46(11): 1667-1677. doi:10.3724/SP.J.1006.2020.04043
WU Hai-Tao, ZHANG Yong, SU Bo-Hong, Lamlom F Sobhi, QIU Li-Juan.
大豆是世界重要的粮食和经济作物, 是人类植物脂肪和蛋白质的重要来源, 在日常膳食结构中占有重要地位。目前大豆和其他高产作物相比, 相对产量偏低, 提高大豆产量潜力是大豆育种的重要任务[1]。分枝数与大豆产量密切相关, 是构成大豆产量的重要因子[2]。分枝数影响植株结实数与群体通风透光状况, 进而影响植株对光能的利用, 还可以通过改善株型、调整大豆群体结构间接影响大豆产量[3,4]。同时, 大豆分枝发育对出苗不齐起到补偿作用, 分枝上种子产量的提高, 可以有效弥补单位土地面积主茎种子产量下降引起的损失, 从而补充了群体的产量[5,6]。因此发掘调控大豆分枝发育的相关基因对于培育高产大豆品种具有重要意义。
大豆分枝数由多基因调控, 分枝的发生受遗传因子、激素和环境等多种因素的影响[7]。迄今为止, 利用大豆的F2群体与重组自交系群体定位了数十个大豆分枝数相关QTL[8,9,10,11,12,13,14,15,16,17,18,19,20,21]。其中在SoyBase (https:// www.soybase.org)中已列出21个分枝数QTL[9,18-19,21]。这些QTL大多分布在10个染色体上, 包括4号、5号、6号、10号、11号、14号、15号、17号、18号和19号染色体。其中在不同世代中表现稳定的QTL有11个[13-14,16-17]。在不同环境中检测到2个稳定QTL [15]。虽然定位的大豆分枝数QTL比较多, 但分枝相关基因研究的报道较少, 谭冰等[22]通过Blastp分析183个植物分枝相关基因的氨基酸序列, 在大豆基因组中获得406个同源基因, 经过共定位分析有57个基因位于20个QTL区间内, 其中2个基因位于多次被检测到的QTL区间, 即COBL1的2个同源基因(Glyma04g32120.1和Glyma04g32130.1)定位在标记Satt294~Satt399之间。Sangrea等[21]对400份大豆品种进行全基因组关联分析(genome-wide association study, GWAS)分析, 并通过少分枝品种Jiyu 69和多分枝品种SS0404-T5-76杂交构建近等基因系群体进行精细定位, 将分枝数QTL (qBR6-1)精细定位到6号染色体的460 kb区间内, 包含13个候选基因, 结合表达分析和基因序列分析推测, GmBRC1 (Glyma.06G210600)可能是调控大豆分枝发育的候选基因。
本研究以前期定位在18号染色体的分枝数QTL新位点qBN-18为基础, 以构建的RIL群体和回交群体为材料, 通过鉴定F7:8群体基因型将qBN-18的定位区间由1.6 Mb缩小到113 kb, 并利用回交群体筛选交换单株将其精细定位在63.7 kb区间内。为大豆分枝数基因克隆、调控机制解析和分子标记选择奠定了基础。
1 材料与方法
1.1 定位群体构建及表型调查
在张霞等[20]以少分枝大豆品种垦丰19 (KF19)和多分枝大豆品种垦农24 (KN24)构建的F2群体基础上, 本研究通过单粒传培育出由606个家系组成的F7:8重组自交系。以KN24为轮回亲本, 与KN24和KF19的F1植株回交2次, 获得17个BC2F1单株, 自交获得BC2F2群体, 共1150个单株。同时, 以KF19为轮回亲本回交3次获得42个BC3F1单株, 自交获得BC3F2群体, 共1486个单株。在黑龙江省农业科学院克山分院试验站种植2个亲本、RIL群体和回交群体。行长3 m, 行距0.4 m, 株距0.1 m。田间按常规管理, 大豆植株成熟后, 去除边缘单株, 参照《大豆种质资源描述规范和数据标准》[23]考种。分枝数为每个植株主茎上的有效分枝数, 分枝上有2个或多个节, 收获时至少有1个成熟的种子荚。2018年与2019年亲本分别考种25株与35株。F7群体每行考种4个单株, F7:8群体每行考种8个单株。采集F7单株叶片, 干冰冷冻后保存在-80℃冰箱备用。1.2 大豆基因组DNA提取
利用改良的CTAB法提取大豆基因组DNA。取大约100 mg的大豆叶片或组织, 加入2.0 mL离心管中, 到每孔装有一颗5 mm钢珠, 在液氮中迅速冷冻, 放在高通量组织研磨机中打样30 s; 取出后每管加入600 μL CTAB溶液和5 μL RNase A (10 mg mL-1)并振荡混匀5 min; 65℃水浴锅中水浴1 h, 每隔10 min颠倒混匀1次; 水浴完成后加入600 μL酚/氯仿, 轻轻混匀10 min再室温静置10 min, 12,000×g离心10 min, 吸取上清; 加入等体积氯仿, 轻轻混匀10 min再室温静置10 min, 12,000×g离心10 min, 吸取上清; 加入等体积异丙醇, -20℃静置1 h或过夜; 再12,000×g离心10 min, 弃上清; 用75%乙醇洗涤2次, 12,000×g离心后弃上清并进行甩干, 用移液器吸除管底残留的乙醇; 风干20 min后加入100 μL灭菌的蒸馏水溶解DNA, 使用NanoDrop 2000/ 2000c超微量分光光度计和0.8%琼脂糖凝胶电泳检测样品DNA浓度和质量。1.3 分子标记的选择及分析
从SoyBase数据库(https://soybase.org/)中选择位于大豆18号染色体定位区间内的55对SSR标记, 由博迈德生物技术有限公司合成, 用KN24和KF19进行多态性引物筛选(表1)。PCR总反应体系为20 μL, 包括10×EasyTaq buffer 2.0 μL、2.5 mmol L-1 dNTPs 1.5 μL、无菌水12.3 μL、EasyTaq酶0.2 μL、引物(2 μmol L-1) 2.0 μL和DNA (70 ng μL-1) 2.0 μL。反应程序为95℃ 5 min; 95℃ 30 s, 55℃ 30 s, 72℃ 30 s, 34个循环; 72℃ 5 min, 4℃保存。用6%非变性聚丙烯酰胺凝胶电泳检测SSR标记的扩增产物。Table 1
表1
表1精细定位所用分子标记
Table 1
| 引物名称 Primer name | 物理位置 Physical position (bp) | 正向引物 Forward primer (5'-3') | 反向引物 Reverse primer (5'-3') |
|---|---|---|---|
| BARCSOYSSR_18_1777 | 54,744,147-54,744,204 | CGTTCTTGCATTAAAGGTGGA | AACTTCATTGAATTGACGGTGA |
| BARCSOYSSR_18_1791 | 54,975,880-54,975,949 | TGACCAGTCAATTGTTCATTCTTT | TTTACTCAACCATCTCCGCA |
| BARCSOYSSR_18_1797 | 55,076,726-55,076,764 | AAGCAAAGAGAACCAAAGCG | AAAACACGAAAAGGAAGGCA |
| BARCSOYSSR_18_1803 | 55,244,106-55,244,173 | TTTCGCACTCAATGTCCGTA | GTTTCCAAACCACATGGACC |
| BARCSOYSSR_18_1825 | 55,701,309-55,701,352 | GAATCCACCATCACCAAACC | CAATGGCAACCCAGTAAGGT |
| BARCSOYSSR_18_1827 | 55,714,562-55,714,637 | GCCCCACTCGATGAAATAAA | GCTTTGGCAGAAATTCAAGG |
| BARCSOYSSR_18_1831 | 55,763,781-55,763,814 | TGTTTTTGTTAAATCTTTTGTTTGG | TGTGTATGTTTGTGTGTGCACTT |
| BARCSOYSSR_18_1832 | 55,775,899-55,775,922 | AAAAGCTGAGAGCACAAGGC | CGTGCTTTTTCAGTCCCATT |
| BARCSOYSSR_18_1834 | 55,877,756-55,877,781 | TTGAAGAGGAGAGAAGAATGGTG | GGATGTGATTGTTAGAAAAGAAGAA |
| BARCSOYSSR_18_1841 | 55,990,705-55,990,750 | TGCACGAGGCCATTACATAG | TGAAGCGCATATGACTCAACTT |
| BARCSOYSSR_18_1847 | 56,075,087-56,075,116 | TGGTAGGAGTACTCTGAAGTCATTTTT | AGCGCTCAAATGAGATTCCT |
| BARCSOYSSR_18_1852 | 56,172,124-56,172,157 | TGTGTGCGTAAGGGAGATCA | CTACCAACCTCCGCATGTCT |
| BARCSOYSSR_18_1856 | 56,223,172-56,223,217 | TGGCCATATGCCTAGCTGAT | ATGGTGAGCAAACGTCATTG |
| BARCSOYSSR_18_1875 | 56,797,313-56,797,366 | TGAAAAAGAACGTGTTCAAAATG | CGAGTTTCATTCTCGGAAGC |
新窗口打开|下载CSV
1.4 InDel标记开发与鉴定
根据亲本定位区间随机测序发现, 55,882,277与55,946,270位点分别存在1个InDel标记, 从Phytozome (https://phytozome.jgi.doe.gov/pz/portal.html)下载含InDel变异位点的序列, 利用Primer3web (http://primer3.ut.ee/)网站分别设计包含InDel的标记BR69与BR77的引物(表2)。为检测2个标记的灵敏度, 用特异引物扩增12个不同浓度的KN24与KF19, DNA浓度分别为100、80、60、40、20、10、5、2、1、0.5、0.2、0.1 ng μL-1。PCR总反应体系为20 μL, 包括10×EasyTaq buffer 2.0 μL、2.5 mmol L-1 dNTPs 1.5 μL、无菌水12.3 μL、EasyTaq酶0.2 μL、引物(2 μmol L-1) 2.0 μL和DNA 2.0 μL。反应程序为95℃ 5 min; 95℃ 30 s, 54℃ 30 s, 72℃ 30 s, 36个循环; 72℃ 5 min, 4℃保存。用6%非变性聚丙烯酰胺凝胶电泳检测InDel标记的扩增产物。筛选最适DNA浓度用于鉴定RIL群体基因型。Table 2
表2
表2两个InDel标记的位置、引物序列及预期扩增片段长度
Table 2
| 引物名称 Primer name | 物理位置 Physical position (bp) | 正向引物 Forward primer (5'-3') | 反向引物 Reverse primer (5'-3') | 片段长度Product size (bp) | |
|---|---|---|---|---|---|
| 垦农24 Kennong 24 | 垦丰19 Kenfeng 19 | ||||
| BR69 | 55,882,229-55,882,378 | AGTTGACAGGAACTAAAGTC | GATAATTCAAGTAAATAGCGA | 156 | 15 |
| BR77 | 55,946,063-55,946,342 | TCTCTTTGTGTATGTCTTCTCC | TTGTTGCATCCAAATGAGAG | 268 | 280 |
新窗口打开|下载CSV
1.5 数据统计分析
利用Microsoft Excel 2016计算KF19与KN24分枝数的平均值与标准差, 利用SAS9.4软件进行单因素方差分析, 利用ggplot2 (R语言程序包)中的vioplot程序分析定位区间内InDel标记BR69与BR77各个基因型对应的分枝数分布。1.6 分枝数QTL定位及验证
利用软件QTL IciMapping V4.1[24]完备区间作图(inclusive composite interval mapping, ICIM)法对分枝数进行QTL定位, 经1000次排列确定LOD阈值, 当实际求得的LOD值大于LOD阈值时, 就认为该区段存在1个QTL。1.7 候选基因预测
根据定位区间物理位置查询SoyBase (https:// www.soybase.org/)获得基因注释。使用Phytozome v12.1获得的定位区间内基因的表达模式, 使用Sangerbox生成热图。2 结果与分析
2.1 KN24和KF19及其群体分枝数表型分析
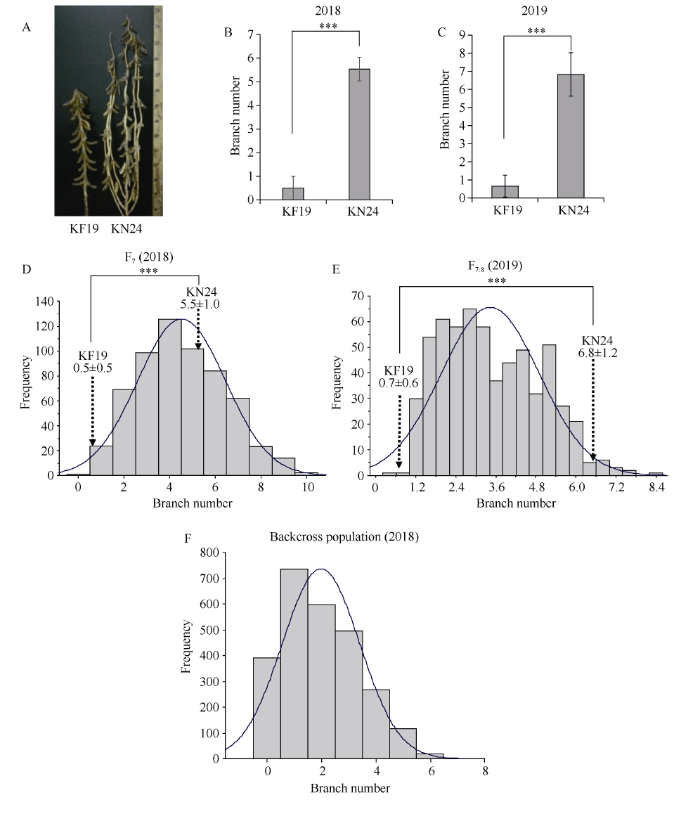
KF19为少分枝材料, KN24为多分枝材料(图1-A)。2018年和2019年KF19平均分枝数分别为0.5和0.7, KN24平均分枝数分别为5.5和6.8 (表3)。KF19和KN24的分枝数性状存在极显著差异, 并且在不同年份间表型稳定, 表明KF19和KN24分别为稳定的多分枝和少分枝品种, 适合作为大豆分枝数QTL定位群体的亲本。KF19×KN24的群体F7和F7:8均有606个株系, 分枝数的变异范围为0~10个, 多分枝特性存在超亲现象。F7、F7:8与回交群体F2 (KN24-BC2F2、KF19-BC3F2)的分枝数均呈连续性变异, 符合正态分布(图1)。表明分枝数性状是典型的多基因控制的数量性状。图1
 新窗口打开|下载原图ZIP|生成PPT
图1垦丰19、垦农24及群体分枝数鉴定
A: 亲本植株; B~C: 分别为2018年与2019年KN24与KF19分枝数表型; D~E: 分别为F7与F7:8分枝数频率分布直方图; F: 2018年回交群体F2分枝数频率分布直方图。垂直虚线表示两亲本表型的平均值和标准差。曲线代表密度图。***: P<0.001。
Fig. 1Identification of branch numbers in KF19, KN24 and the population
A: parent plant; B-C: KN24 and KF19 branch number phenotypes in 2018 and 2019, respectively; D-E: histogram of frequency distribution of F7 and F7:8 branch numbers, respectively; F: histogram of the frequency distribution of branch number F2 in the backcross population in 2018. Mean value and standard deviation of parental phenotypes are indicated by vertical dotted lines. Curve represents density plot. ***: P < 0.001.
Table 3
表3
表32018年、2019年KF19和KN24及其F7、F7:8群体的分枝数(BN)统计分析
Table 3
| 年份 Year | 分枝数的平均值±标准差 Mean±SD of BN | 群体的分枝数参数 Parameters of BN in populations | ||||
|---|---|---|---|---|---|---|
| KN24 | KF19 | 平均值±标准差 Mean±SD | 范围 Range | 偏度 Skewness | 峰度 Kurtosis | |
| 2018 | 5.5±1.0 | 0.5±0.5 | 4.5±1.9 | 0-10 | 0.2740 | -0.3887 |
| 2019 | 6.8±1.2 | 0.7±0.6 | 3.4±1.5 | 0-8 | 0.3390 | -0.5720 |
新窗口打开|下载CSV
2.2 用RIL群体精细定位分枝数相关QTL
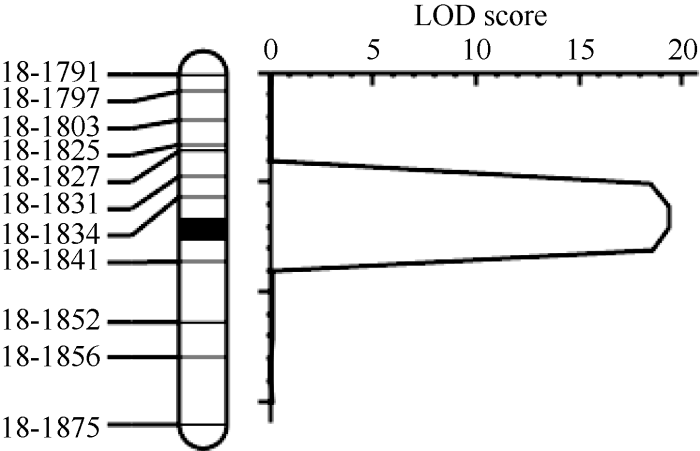
张霞等[20]利用垦丰19和垦农24杂交构建的F2群体定位到2个分枝数相关QTL, 分别位于6号和18号染色体上, 其中18号染色体QTL位点(qBN-18)介于标记BARCSOYSSR_18_1777和BARCSOYSSR_18_ 1858之间, 约1.6 Mb, 解释8.0%的遗传变异, 是一个新的QTL位点。为了精细定位qBN-18, 将垦丰19和垦农24的F2构建成1个由606个株系组成的F7:8重组自交系群体。在标记BARCSOYSSR_18_1777和BARCSOYSSR_18_1858之间选择55个SSR标记分析2个亲本发现, 多态性的SSR标记共有14个。根据物理位置选择均匀分布的11个SSR标记鉴定群体基因型, 利用QTL IciMapping 4.1软件绘制遗传连锁图谱并定位QTL (临界阈值LOD=2.5)(图2), 获得了一个LOD值为19.33的分枝数QTL (表4), 将qBN-18的定位区间由1.6 Mb缩小至113 kb, 位于标记BARCSOYSSR_18_1834与BARCSOYSSR_18_1841之间, 解释14.24%的遗传变异, 区间内包含14个基因。图2
 新窗口打开|下载原图ZIP|生成PPT
图2用垦丰19和垦农24构成的RIL群体在大豆18号染色体定位分枝数QTL qBN-18
Fig. 2Branch number QTL qBN-18 of soybean chromosome 18 was located by the RIL populations consisted of KF19 and KN24
Table 4
表4
表4KF19×KN24的F7:8群体中鉴定到的分枝数QTL
Table 4
| 群体 Population | 染色体 Chr. | 标记区间 Marker interval | 区间物理位置 Physical position of interval (bp, Wm82.a2.v1) | LOD值 LOD value | 表型变异率 PVE (%) | 加性效应 Additive effect |
|---|---|---|---|---|---|---|
| F7:8 | 18 | BARCSOYSSR_18_1834-BARCSOYSSR_18_1841 | 55,877,756-55,990,750 | 19.33 | 14.24 | 0.75 |
新窗口打开|下载CSV
2.3 InDel标记开发与鉴定
2.3.1 InDel标记开发与灵敏度检测 在定位区间内基因间隔区随机测定KF19与KN24 2个亲本序列, 在55,882,277与55,946,270位点分别发现1个InDel位点, 在两亲本间分别有6个、12个碱基的差异, 从Phytozome (https://phytozome.jgi.doe.gov/pz/portal. html)下载含InDel变异位点的序列, 利用Primer3web网站设计BR69与BR77的特异扩增引物(表2)。BR69位于基因Glyma.18G276900的上游, 其物理位置与标记BARCSOYSSR_18_1834相距4.5 kb, 与标记BARCSOYSSR_18_1841相距108.5 kb。BR77位于基因Glyma.18g277700的下游, 其物理位置与标记BARCSOYSSR_18_1834相距68.3 kb, 与标记BARCSOYSSR_18_1841相距44.7 kb。BR69与BR77相距63.7 kb。为了鉴定所开发的InDel标记的实用性, 设置了12个DNA浓度检测BR69与BR77的灵敏度。BR69在DNA≥2 ng的8个浓度时均可以扩增出两亲本目标条带, 且两亲本间差异明显。在DNA≤1 ng的4个浓度时两亲本均出现杂带, 特异性差。BR77在DNA≥5 ng的7个浓度时均可以扩增出两亲本目标条带, 且两亲本间差异明显, 在DNA≤2 ng的5个浓度时条带不清晰。表明BR69和BR77 2个标记在亲本DNA浓度为5~100 ng μL-1之间均扩增出清晰条带, 可用于群体基因型鉴定。
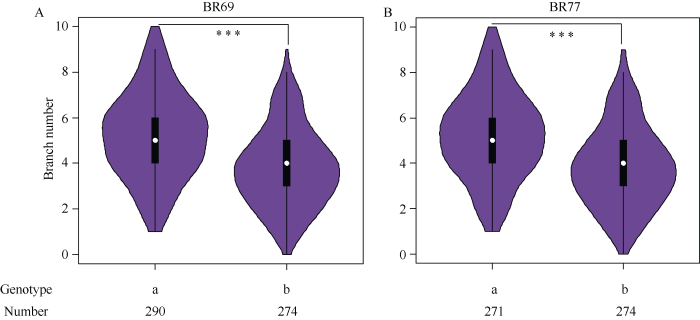
2.3.2 RIL群体基因型鉴定 用2个InDel标记BR69与BR77鉴定RIL群体基因型。在BR69位点, 多分枝基因型(aa)有290个株系, 平均分枝数为5.22; 少分枝基因型(bb)有274个株系, 平均分枝数为3.80。在BR77位点, 多分枝基因型(aa)有271个株系, 平均分枝数为5.22; 少分枝基因型(bb)有259个株系, 平均分枝数为3.85 (图3)。表明2个标记与分枝数紧密连锁, 可用于分枝数改良的标记辅助育种。
图3
 新窗口打开|下载原图ZIP|生成PPT
图3RIL群体中标记 BR69与BR77的基因型与表型相关性分析
A: BR69的基因型与表型相关性分析; B: BR77的基因型与表型相关性分析。图中横坐标为基因型, 多分枝记为a, 少分枝记为b, 纵坐标为分枝数。***P < 0.001。
Fig. 3Correlation analysis between genotype and phenotypic by BR69 and BR77 markers in RIL population
A: correlation analysis between genotype and phenotype of BR69; B: correlation analysis between genotype and phenotype of BR77. The abscissa is the genotype, the multiple branches are denoted as a, the few branches are denoted as b, and the vertical ordinate is the number of branches. ***P < 0.001.
2.4 利用回交群体验证定位结果
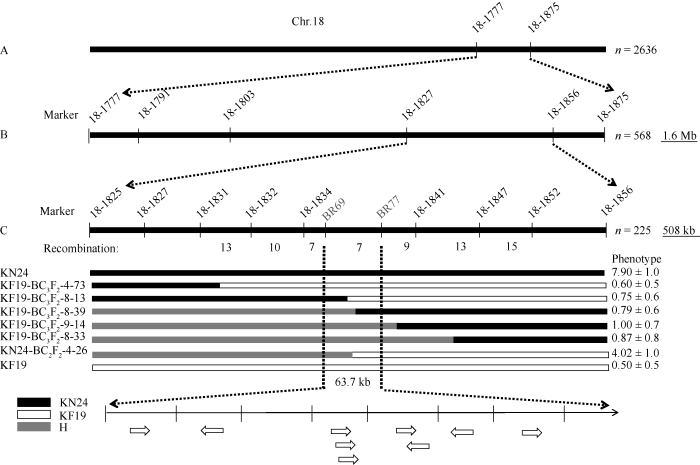
为了进一步验证和缩小定位区间, 分别以两亲本为轮回亲本构建了2个回交群体KN24-BC2F2与KF19-BC3F2, 用qBN-18两侧标记BARCSOYSSR_ 18_1777与BARCSOYSSR_18_1875鉴定1150株KN24-BC2F2与1486株KF19-BC3F2的基因型, 筛选出在2个标记间基因型不同的单株有568株。然后用4个SSR标记BARCSOYSSR_18_1791、BARCSOYSSR_ 18_1803、BARCSOYSSR_18_1827与BARCSOYSSR_ 18_1856鉴定2个标记之间的重组单株, 其中, 在BARCSOYSSR_18_1827与BARCSOYSSR_18_1856之间发生交换的单株有225个。然后用7个SSR标记BARCSOYSSR_ 18_1825、BARCSOYSSR_18_1831、BARCSOYSSR_ 18_1832、BARCSOYSSR_18_1834、BARCSOYSSR_ 18_1841、BARCSOYSSR_18_1847、BARCSOYSSR_ 18_1852与2个InDel标记BR69、BR77鉴定筛选出来的225个重组单株, 结合表型分析, 最终将qBN-18由BARCSOYSSR_18_1777与BARCSOYSSR_ 18_1875之间的1.6 Mb缩小到BR69与BR77之间, 约为63.7 kb (图4)。图4
 新窗口打开|下载原图ZIP|生成PPT
图4qBN-18位点的验证
A: 利用KF19-BC3F2的1486个单株和KN24-BC2F2的1150个单株鉴定了标记BARCSOYSSR_18_1777和BARCSOYSSR_18_1875之间的qBN-18位点; B: 利用BARCSOYSSR_18_1791、BARCSOYSSR_18_1803、BARCSOYSSR_18_1827与BARCSOYSSR_18_1856 4个标记鉴定BARCSOYSSR_18_1777和BARCSOYSSR_18_1875之间的568个重组单株; C: qBN-18位于标记BR69与标记BR77之间。H: 杂合基因型。
Fig. 4Validation of qBN-18 locus
A: qBN-18 loci between marker BARCSOYSSR_18_1777 and BARCSOYSSR_18_1875 was identified using 1486 individuals of KF19-BC3F2 and 1150 individuals of KN24-BC2F2; B: BARCSOYSSR_18_1791, BARCSOYSSR_18_1803, BARCSOYSSR_18_1827 and BARCSOYSSR_18_1856 were used to identify 568 recombinant strains between BARCSOYSSR_18_1777 and BARCSOYSSR_18_1875; C: qBN-18 is located between tag BR69 and tag BR77. H: heterozygous genotype.
2.5 候选基因预测
根据定位区间物理位置查询SoyBase (Table 5
表5
表5定位区间内基因的同源基因及基因注释
Table 5
| 基因 Gene | 同源基因 Homologous gene | 基因注释 Gene annotation |
|---|---|---|
| Glyma.18g276900 | AT5G11390.1 | WPP domain-interacting protein 1 |
| Glyma.18g277000 | AT3G02030.1 | Pentatricopeptide repeat (PPR) superfamily protein |
| Glyma.18g277100 | AT3G30530.1 | Basic leucine-zipper 42 |
| Glyma.18g277300 | AT3G02060.1 | 6-phosphogluconate dehydrogenase family protein |
| Glyma.18g277600 | AT4G25760.1 | Glutamine dumper 2 |
| Glyma.18g277700 | AT4G15733.1 | SCR-like 11 |
新窗口打开|下载CSV
图5
 新窗口打开|下载原图ZIP|生成PPT
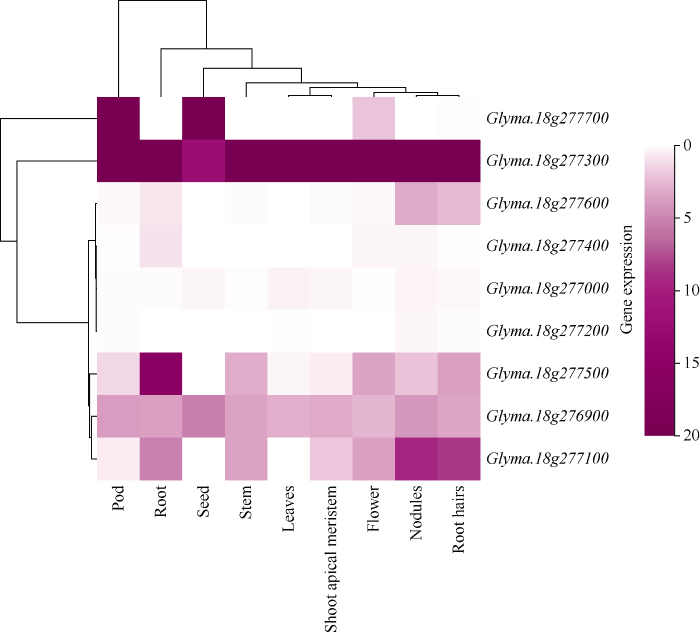
图5用Phytozome v12.1获得9个基因的表达谱
Fig. 5Expression profiles of nine genes by Phytozome v12.1
18g277300在豆荚、根、种子、茎、叶、茎顶端分生组织(shoot apical meristem, SAM)、花、节、根毛9个组织中均有表达。Glyma.18g277600在根、节、根毛中有表达。Glyma.1g277400在根中有表达。Glyma.1g277000与Glyma.18g277200在各组织中均无表达。Glyma.18g277500在豆荚、根、茎、花、节、根毛中有表达。Glyma.18g277100在根、茎、茎顶端分生组织、花、节、根毛中有表达。
植物的分枝是由茎顶端分生组织衍生出的腋生分生组织分化来的, 因此初步确定在茎顶端分生组织有表达的3个基因Glyma.18g276900、Glyma. 18g277100、Glyma.18g277300可能与分枝数相关。
3 讨论
3.1 RIL群体与回交群体共同定位的优势
QTL定位所用的群体有F2、重组自交系(recombinant inbred lines, RILs)、回交重组自交系(backcross inbred lines, BILs)或双单倍体系(double inbred lines, DHLs), 以及基于多个分子标记生成的连锁图谱[25]。由于QTL分析是建立在统计计算的基础上的, 即使使用大量的群体和许多遗传标记, 也很难确定单个QTL的精确位置, 因此, 精细定位需要其他群体[26]。F2群体为暂时性分离群体, 与RIL群体相比, 其株系内基因型还未达到纯合, 因此不能永久使用[27]。回交导入系是通过与一个亲本多代回交, 并结合系统的标记辅助选择(molecular marker-assisted selection, MAS)产生的。在独特的基因组背景下包含少量供体片段(或QTL)的导入, 有助于对目标QTL进行全面分析, 可以评估QTL在轮回亲本基因组背景下的作用[26]。而且回交群体家系间的遗传背景相似, 供体背景对目标性状QTL效应检测的影响较小, QTL检测更为准确[28]。目前大豆分枝数QTL定位所使用的群体多为F2与RIL群体[8,9,10,11,12,13,14,15,16,17,18,19,20,21]。本研究在利用F2群体进行初定位的基础上, 通过鉴定RIL群体基因型进行精细定位, 用2个回交群体验证定位结果, 经过多重验证, 定位结果可信度更高。3.2 大豆分枝数QTL精细定位
大豆分枝数是由多基因控制的数量性状[29], 不仅与产量关系密切, 同时也是影响大豆株型的重要因子, 定位并克隆分枝发育相关基因对培育高产大豆新品种具有重要意义。然而, 大豆分枝数的QTL定位研究尚处于起步阶段[22]。虽然已经定位的大豆分枝数QTL较多[8,9,10,11,12,13,14,15,16,17,18,19,20,21]。但精细定位仅有1例, Sangrea等[21]利用近等基因系将6号染色体上的分枝数位点qBR6-1精细定位到的460 kb区间内。本研究是在张霞等[20]定位分枝数的新QTL基础上, 用11个SSR标记鉴定KN24×KF19 F7:8, 将定位区间缩小到113 kb, 解释14.24%的遗传变异; 并用回交群体将定位区间进一步缩小至63.7 kb, 包含9个基因。该位点尚未见相关报道。因此, 本研究精细定位在18号染色体的大豆分枝数QTL qBN-18是迄今为止定位区间小、包含候选基因少的QTL, 为该位点的图位克隆提供了重要信息, 也为分子标记选择分枝数创造了条件。
3.3 大豆分枝数候选基因
植物的分枝是由茎顶端分生组织衍生出的腋生分生组织分化来的, 腋芽形成后可能发育形成分枝, 也可能一直保持休眠状态直到生长被激活[30]。腋芽的生长受基因、激素、发育状况和环境等多种因素的影响, 各因素的相互作用共同决定腋芽处于休眠状态还是继续发育[31]。植物的顶端优势会抑制侧芽的生长。由于生长素是在茎顶端合成的, 它被植物的下半部分所吸收, 抑制了分枝的生长, 所以去掉茎顶端后可以消除顶端优势, 促进一个或多个腋芽的生长[32]。考虑到茎顶端分生组织与分枝的发育有关, 用Phytozome v12.1获得的定位区间内9个基因的表达模式, 使用Sangerbox生成热图。其中有3个基因Glyma.18g276900、Glyma.18g277100、Glyma. 18g277300在茎顶端分生组织中有表达, 这些基因在本研究群体中的表达情况还有待检测。根据SoyBase (https://www.soybase.org/)提供的信息对区间内基因进行注释(表5), 其中Glyma. 18g276900是一个WPP蛋白家族基因, WPP蛋白家族表达的减少导致拟南芥根系有丝分裂活性降低, 导致根长缩短, 侧根数量减少[33]。Glyma.18g277100是一个bZIP (basic leucine zipper)家族基因。bZIP TFs是一个高度保守家族, 调节植物生长发育过程中的多种现象, 并参与胁迫反应和激素信号传导[34]。许多真核生物(包括酵母、动物和植物)的基因组已经鉴定或预测到了bZIP TFs家族成员[35,36,37]。在正常条件下, bZIP TFs参与各种生物过程。例如, 它们在器官和组织分化[38]、细胞伸长[39]和体细胞胚发生[40]中起重要作用。它们还在响应各种生物/非生物胁迫和信号(如激素和糖信号)方面发挥重要的调节作用, 如光反应[41]和渗透胁迫[42]。Glyma.18g277300是一个6-磷酸葡萄糖酸脱氢酶(6PGDH)蛋白家族基因。磷酸戊糖途径(PPP)对于植物代谢至关重要[43], 在PPP的氧化部分中, 葡萄糖-6-P脱氢酶(G6PDH)和6-磷酸葡萄糖酸脱氢酶(6PGDH)催化葡萄糖-6-P的不可逆氧化, 产生两分子NADPH和一分子CO2。Gertraud等[44]在玉米叶绿体中定位到了氧化戊糖磷酸途径中6-磷酸葡萄糖酸脱氢酶(6PGDH)功能缺失的2个等位基因, 这些突变导致胚乳种子表型粗糙, 胚乳油和胚乳淀粉减少。目前定位区间内的基因尚无与分枝数相关的报道, 因此候选基因的选择还有待于进一步的鉴定和验证。
4 结论
利用11个SSR标记鉴定到1个由606个株系组成的KF19×KN24F7:8 RIL群体基因型并构建遗传图谱, 在18号染色体精细定位到1个大豆分枝数相关QTL qBN-18, 位于标记BARCSOYSSR_18_1834与BARCSOYSSR_18_1841之间, 解释14.24%的遗传变异。通过开发BR69和BR77 2个InDel标记, 结合回交群体, 将qBN-18区间从113 kb缩小至63.7 kb。本研究结果为大豆分枝数的基因克隆及分子标记辅助育种创造了条件。参考文献 原文顺序
文献年度倒序
文中引用次数倒序
被引期刊影响因子
[本文引用: 1]
[本文引用: 1]
[本文引用: 1]
[本文引用: 1]
[本文引用: 1]
[本文引用: 1]
[本文引用: 1]
[本文引用: 1]
[本文引用: 1]
[本文引用: 1]
[本文引用: 1]
URLPMID:16325456 [本文引用: 1]
[本文引用: 3]
[本文引用: 3]
[本文引用: 4]
[本文引用: 4]
[本文引用: 3]
[本文引用: 3]
[本文引用: 3]
[本文引用: 3]
[本文引用: 3]
[本文引用: 3]
[本文引用: 4]
[本文引用: 4]
[本文引用: 4]
[本文引用: 4]
[本文引用: 4]
[本文引用: 4]
DOI:10.7505/j.issn.1007-9084.2014.05.003URL [本文引用: 4]

大豆产量相关性状大多为数量性状,受环境影响较大,因此研究大豆产量相关性状的遗传及其与自然环境的关系在大豆育种中具有重要意义。以Peking×7605组合分别在济南和南京衍生的重组自交系(RIL)群体JN(RN)P7和NJ(RN)P7为材料,用146对亲本间表现多态性的SSR引物在两个群体中进行扩增,并构建遗传图谱,对大豆株高、主茎分枝数、主茎节数、单株荚数和百粒重五个产量相关性状进行考察并进行QTL分析。JN(RN)P7群体两年共检测到控制五个性状的25个QTL,NJ(RN)P7群体中共定位44个相关QTL。在JN(RN)P7群体的标记BSC和标记satt372附近两年重复检测到两个相近的QTL,NJ(RN)P7群体中两年重复检测到位于相同位置或同一置信区间的QTL共有7个。大部分QTL定位于两个RIL群体的相同连锁群上,但位置不同,并且两个群体中能够稳定表达的QTL不同。两群体中共得到了69个QTL,大多数与前人报道相符合;而由同一杂交组合在不同生态环境异下衍生的两个RIL群体的QTL定位结果有所差异。
[本文引用: 4]
[本文引用: 4]
[本文引用: 4]
[本文引用: 4]
DOI:10.4238/2015.June.8.8URLPMID:26125811 [本文引用: 4]
Plant traits are important indices for regulating and controlling yield ability in soybean varieties. It is important to comprehensively study the quantitative trait locus (QTL) mapping for soybean plant traits, cloning related genes, and marker assistant breeding. In this study, 236 F2 generation plants and a derivative group were constructed by using Jiyu50 and Jinong18, obtained from Jilin Province. A total of 102 simple sequence repeat markers were used to construct a genetic linkage map. With 2 years of molecular and phenotypic data, QTL analyses and mapping were conducted for soybean maturity, plant height, main stem node, main stem branch, seed weight per plant, and more. Five main plant traits were analyzed via inclusive composite interval mapping using QTL IciMapping v2.2. Using one-dimensional scanning, a total of 30 QTLs were detected and distributed across 1 (A1), 4 (C2), and 12 (G). There were 9 linkage groups, including 16 major QTLs. Using two-dimensional scanning, 7 pairs of epistatic QTL interactions for maturity and plant height were detected in the soybean.
[本文引用: 6]
.
[本文引用: 6]
DOI:10.1007/s10681-017-2016-zURL [本文引用: 6]
[本文引用: 2]
[本文引用: 2]
[本文引用: 1]
[本文引用: 1]
DOI:10.1016/j.cj.2015.01.001URL [本文引用: 1]
DOI:10.1016/s1369-5266(00)00148-5URLPMID:11228435 [本文引用: 1]
Recent progress in plant genome analysis has made it possible to examine the naturally occurring allelic variation underlying complex traits. Many studies have described the genetic mapping of quantitative trait loci for several kinds of complex phenotypic traits. Some researchers have taken up the challenge of performing the molecular cloning of genes at these loci, and examples of cloning have recently been reported. Naturally occurring allelic variation could be a new resource for the functional analysis of plant genes.
DOI:10.1016/j.tplants.2006.05.008URLPMID:16769240 [本文引用: 2]
Many agronomically important traits are governed by several genes known as quantitative trait loci (QTLs). The identification of important, QTL-controlled agricultural traits has been difficult because of their complex inheritance; however, completion of the rice genomic sequence has facilitated the cloning of QTLs and their pyramiding for breeding. Because QTLs are derived from natural variation, the use of a wider range of variations such as that found in wild species is important. In addition, Introgression Lines (ILs) developed from wild species in combination with Marker Assisted Selection should facilitate efficient gene identification. This review describes recent developments in rice QTL analysis including mapping, cloning and pyramiding QTLs.
DOI:10.11963/1002-7807.lnnwhm.20190515URL [本文引用: 1]
【目的】鉴定出能够稳定表达的棉花抗黄萎病相关数量性状位点(Quantitative trait loci,QTLs)。【方法】以抗落叶型黄萎病棉花品种常抗棉和感黄萎病品种TM-1为亲本配制的111个重组自交系家系为作图群体,筛选出多态性简单序列重复(Simple sequence repeat,SSR)标记,并用于构建遗传图谱。用完备复合区间作图法对该群体在安阳大田、新疆重病地及病圃等多个环境下的黄萎病病情指数进行QTLs检测。【结果】构建了1张含有12个连锁群、40个标记、总长212.5 cM(厘摩)的遗传图谱。获得了6个与抗黄萎病基因相关的QTLs,对数优势比(Logarithm of the odd score,LOD)分布在2.51~5.55,贡献率最大为20.34%,最小为6.93%。其中,qVR-D05-1能够在安阳大田2015年7月15日和新疆南疆重病地2016年7月9日2个环境中检测到,贡献率分别为12.96%和20.34%。【结论】本研究得到的qVR-D05-1能够为定位出稳定的棉花抗黄萎病相关QTLs提供参考。
[本文引用: 1]
URLPMID:22869284 [本文引用: 1]
DOI:10.1111/tpj.12105URL [本文引用: 1]
The majority of agronomically important crop traits are quantitative, meaning that they are controlled by multiple genes each with a small effect (quantitative trait loci, QTLs). Mapping and isolation of QTLs is important for efficient crop breeding by marker-assisted selection (MAS) and for a better understanding of the molecular mechanisms underlying the traits. However, since it requires the development and selection of DNA markers for linkage analysis, QTL analysis has been time-consuming and labor-intensive. Here we report the rapid identification of plant QTLs by whole-genome resequencing of DNAs from two populations each composed of 2050 individuals showing extreme opposite trait values for a given phenotype in a segregating progeny. We propose to name this approach QTL-seq as applied to plant species. We applied QTL-seq to rice recombinant inbred lines and F2 populations and successfully identified QTLs for important agronomic traits, such as partial resistance to the fungal rice blast disease and seedling vigor. Simulation study showed that QTL-seq is able to detect QTLs over wide ranges of experimental variables, and the method can be generally applied in population genomics studies to rapidly identify genomic regions that underwent artificial or natural selective sweeps.
[本文引用: 1]
[本文引用: 1]
DOI:10.1016/j.tplants.2012.07.001URLPMID:22858267 [本文引用: 1]
Tillering (branching) is a major determinant of crop yield that is controlled by complex interactions between hormonal, developmental, and environmental factors. Historically, research on shoot branching has focused on eudicots, mainly due to the ease of manipulating branching by shoot decapitation and grafting in these species. These studies demonstrated hormonal control of branching. Recent studies in monocots have contributed to our knowledge of tillering/branching by identifying novel branching genes and regulatory mechanisms. A comparison of branching controls in eudicots and monocots reveals that the regulatory signals and genes are broadly conserved, but that there are differences in the detail.
URLPMID:16577553 [本文引用: 1]
DOI:10.1105/tpc.104.026740URLPMID:15548735 [本文引用: 1]
The nuclear envelope (NE) acts as a selective barrier to macromolecule trafficking between the nucleus and the cytoplasm and undergoes a complex reorganization during mitosis. Different eukaryotic kingdoms show specializations in NE function and composition. In contrast with vertebrates, the protein composition of the NE and the function of NE proteins are barely understood in plants. MFP1 attachment factor 1 (MAF1) is a plant-specific NE-associated protein first identified in tomato (Lycopersicon esculentum). Here, we demonstrate that two Arabidopsis thaliana MAF1 homologs, WPP1 and WPP2, are associated with the NE specifically in undifferentiated cells of the root tip. Reentry into cell cycle after callus induction from differentiated root segments reprograms their NE association. Based on green fluorescent protein fusions and immunogold labeling data, the proteins are associated with the outer NE and the nuclear pores in interphase cells and with the immature cell plate during cytokinesis. RNA interference-based suppression of the Arabidopsis WPP family causes shorter primary roots, a reduced number of lateral roots, and reduced mitotic activity of the root meristem. Together, these data demonstrate the existence of regulated NE targeting in plants and identify a class of plant-specific NE proteins involved in mitotic activity.
DOI:10.3390/ijms20174103URL [本文引用: 1]
URLPMID:11118137 [本文引用: 1]
DOI:10.1016/s1360-1385(01)02223-3URLPMID:11906833 [本文引用: 1]
In plants, basic region/leucine zipper motif (bZIP) transcription factors regulate processes including pathogen defence, light and stress signalling, seed maturation and flower development. The Arabidopsis genome sequence contains 75 distinct members of the bZIP family, of which approximately 50 are not described in the literature. Using common domains, the AtbZIP family can be subdivided into ten groups. Here, we review the available data on bZIP functions in the context of subgroup membership and discuss the interacting proteins. This integration is essential for a complete functional characterization of bZIP transcription factors in plants, and to identify functional redundancies among AtbZIP factors.
DOI:10.1104/pp.107.112821URLPMID:18065552 [本文引用: 1]
The basic leucine (Leu) zipper (bZIP) proteins compose a family of transcriptional regulators present exclusively in eukaryotes. The bZIP proteins characteristically harbor a bZIP domain composed of two structural features: a DNA-binding basic region and the Leu zipper dimerization region. They have been shown to regulate diverse plant-specific phenomena, including seed maturation and germination, floral induction and development, and photomorphogenesis, and are also involved in stress and hormone signaling. We have identified 89 bZIP transcription factor-encoding genes in the rice (Oryza sativa) genome. Their chromosomal distribution and sequence analyses suggest that the bZIP transcription factor family has evolved via gene duplication. The phylogenetic relationship among rice bZIP domains as well as with bZIP domains from other plant bZIP factors suggests that homologous bZIP domains exist in plants. Similar intron/exon structural patterns were observed in the basic and hinge regions of their bZIP domains. Detailed sequence analysis has been done to identify additional conserved motifs outside the bZIP domain and to predict their DNA-binding site specificity as well as dimerization properties, which has helped classify them into different groups and subfamilies, respectively. Expression of bZIP transcription factor-encoding genes has been analyzed by full-length cDNA and expressed sequence tag-based expression profiling. This expression profiling was complemented by microarray analysis. The results indicate specific or coexpression patterns of rice bZIP transcription factors starting from floral transition to various stages of panicle and seed development. bZIP transcription factor-encoding genes in rice also displayed differential expression patterns in rice seedlings in response to abiotic stress and light irradiation. An effort has been made to link the structure and expression pattern of bZIP transcription factor-encoding genes in rice to their function, based on the information obtained from our analyses and earlier known results. This information will be important for functional characterization of bZIP transcription factors in rice.
[本文引用: 1]
DOI:10.1105/tpc.12.6.901URLPMID:10852936 [本文引用: 1]
Cell expansion, a developmental process regulated by both endogenous programs and environmental stimuli, is critically important for plant growth. Here, we report the isolation and characterization of RSG (for repression of shoot growth), a transcriptional activator with a basic leucine zipper (bZIP) domain. To examine the role of RSG in plant development, we generated transgenic tobacco plants expressing a dominant-negative form of RSG, which repressed the activity of full-length RSG. In transgenic plants, this expression severely inhibited stem internode growth, specifically cell elongation. These plants also had less endogenous amounts of the major active gibberellin (GA) in tobacco, GA(1). Applying GAs restored the dwarf phenotypes of transgenic tobacco plants that expressed the dominant-negative form of RSG. To investigate the function of RSG in the regulation of the endogenous amounts of GAs, we identified a target for RSG. RSG bound and activated the promoter of Arabidopsis GA3, one of the genes encoding enzymes involved in GA biosynthesis. Moreover, the dominant-negative form of RSG decreased expression of the GA3 homolog in transgenic tobacco plants. Our results show that RSG, a bZIP transcriptional activator, regulates the morphology of plants by controlling the endogenous amounts of GAs.
DOI:10.1111/j.1365-313X.2009.03948.xURLPMID:19519801 [本文引用: 1]
Seed dormancy is an important adaptive trait that enables seeds of many species to remain quiescent until conditions become favorable for germination. Abscisic acid (ABA) plays an important role in these developmental processes. Like dormancy and germination, the elongation of carrot somatic embryo radicles is retarded by sucrose concentrations at or above 6%, and normal growth resumes at sucrose concentrations below 3%. Using a yeast one-hybrid screening system, we isolated two bZIP-type transcription factors, CAREB1 and CAREB2, from a cDNA library prepared from carrot somatic embryos cultured in a high-sucrose medium. Both CAREB1 and CAREB2 were localized to the nucleus, and specifically bound to the ABA response element (ABRE) in the Dc3 promoter. Expression of CAREB2 was induced in seedlings by drought and exogenous ABA application; whereas expression of CAREB1 increased during late embryogenesis, and reduced dramatically when somatic embryos were treated with fluridone, an inhibitor of ABA synthesis. Overexpression of CAREB1 caused somatic embryos to develop slowly when cultured in low-sucrose medium, and retarded the elongation of the radicles. These results indicate that CAREB1 and CAREB2 have similar DNA-binding activities, but play different roles during carrot development. Our results indicate that CAREB1 functions as an important trans-acting factor in the ABA signal transduction pathway during carrot somatic embryogenesis.
URLPMID:14739338 [本文引用: 1]
DOI:10.1038/sj.emboj.7601206URLPMID:16810321 [本文引用: 1]
Proline metabolism has been implicated in plant responses to abiotic stresses. The Arabidopsis thaliana proline dehydrogenase (ProDH) is catalysing the first step in proline degradation. Transcriptional activation of ProDH by hypo-osmolarity is mediated by an ACTCAT cis element, a typical binding site of basic leucine zipper (bZIP) transcription factors. In this study, we demonstrate by gain-of-function and loss-of-function approaches, as well as chromatin immunoprecipitation (ChIP), that ProDH is a direct target gene of the group-S bZIP factor AtbZIP53. Dimerisation studies making use of yeast and Arabidopsis protoplast-based two-hybrid systems, as well as bimolecular fluorescence complementation (BiFC) reveal that AtbZIP53 does not preferentially form dimers with group-S bZIPs but strongly interacts with members of group-C. In particular, a synergistic interplay of AtbZIP53 and group-C AtbZIP10 was demonstrated by colocalisation studies, strong enhancement of ACTCAT-mediated transcription as well as complementation studies in atbzip53 atbzip10 T-DNA insertion lines. Heterodimer mediated activation of transcription has been found to operate independent of the DNA-binding properties and is described as a crucial mechanism to modulate transcription factor activity and function.
DOI:10.1016/s1369-5266(03)00039-6URLPMID:12753973 [本文引用: 1]
The oxidative pentose phosphate pathway is a major source of reducing power and metabolic intermediates for biosynthetic processes. Some, if not all, of the enzymes of the pathway are found in both the cytosol and plastids, although the precise distribution of their activities varies. The apparent absence of sections of the pathway from the cytosol potentially complicates metabolism. These complications are partly offset, however, by exchange of intermediates between the cytosol and the plastids through the activities of a family of plastid phosphate translocators. Molecular analysis is confirming the widespread presence of multiple genes encoding each of the enzymes of the oxidative pentose phosphate pathway. Differential expression of these isozymes may ensure that the kinetic properties of the activity that catalyses a specific reaction match the metabolic requirements of a particular tissue. This hypothesis can be tested thanks to recent developments in the application of 13C-steady-state labelling strategies. These strategies make it possible to quantify flux through metabolic networks and to discriminate between pathways of carbohydrate oxidation in the cytosol and plastids.
DOI:10.1093/jxb/ert082URLPMID:23530131 [本文引用: 1]
Plants have duplicate versions of the oxidative pentose phosphate pathway (oxPPP) enzymes with a subset localized to the chloroplast. The chloroplast oxPPP provides NADPH and pentose sugars for multiple metabolic pathways. This study identified two loss-of-function alleles of the Zea mays (maize) chloroplast-localized oxPPP enzyme 6-phosphogluconate dehydrogenase (6PGDH). These mutations caused a rough endosperm seed phenotype with reduced embryo oil and endosperm starch. Genetic translocation experiments showed that pgd3 has separate, essential roles in both endosperm and embryo development. Endosperm metabolite profiling experiments indicated that pgd3 shifts redox-related metabolites and increases reducing sugars similar to starch-biosynthetis mutants. Heavy isotope-labelling experiments indicates that carbon flux into starch is altered in pgd3 mutants. Labelling experiments with a loss of cytosolic 6PGDH did not affect flux into starch. These results support the known role for plastid-localized oxPPP in oil synthesis and argue that amyloplast-localized oxPPP reactions are integral to endosperm starch accumulation in maize kernels.
