1.National Laboratory on High Power Laser and Physics, Shanghai Institute of Optics and Fine Mechanics, Chinese Academy of Sciences, Shanghai 201800, China 2.Center of Materials Science and Optoelectronics Engineering, University of Chinese Academy of Sciences, Beijing 100049, China
Fund Project:Project supported by the National Natural Science Foundation of China (Grant Nos. 61827816, 11875308, 61675215), the Scientific Instrument Developing Project of the Chinese Academy of Sciences (Grant No. YJKYYQ20180024), and the Science and Technology Innovation Action Plan Project of Shanghai, China (Grant No. 19142202600)
Received Date:10 December 2020
Accepted Date:04 May 2021
Available Online:07 June 2021
Published Online:20 September 2021
Abstract:Temporal shearing interferometry is proposed to measure the temporal phase distribution of nanosecond laser pulses. In the proposed scheme, the pulse to be measured is divided into two pulses with a delay of hundreds of picoseconds in between, arbitrary one of the two pulses is added to by an appropriate amount of frequency shift, then is combined with the remaining pulse, thereby obtaining the temporal shearing interferogram that is recorded by a normal photodiode. The temporal phase distribution is calculated by an adaptive algorithm based on Fourier transform, and further the precise spectra of the measured pulse can also be calculated according to the Fourier relation between time domain and spectral domain. Based on the systematic analysis of the principle of the technology, the proposed technology is verified by numerical simulation. And the influence of the variable parameters including noise, relative delay, relative intensity on the measured error are systematically analyzed in the simulation. And the results show that the proposed nanosecond temporal phase diagnostic technique has a good performance when the signal noise ratio of the interferogram is above 15 dB, the relative delay of the pulses is between 0.5% and 28% and the relative intensity is above 0.1%. The proposed method is verified experimentally in a nanosecond laser system with central wavelength of 640 nm and pulse width of 20 ns. And the calculated spectra obtained from the temporal shearing interferogram match well with the spectra measured by a scanning Fabry-Perot interferometer. This proposed technique does not use any nonlinear optical effects, thus it can be applied to the diagnostic of nanosecond laser pulse centered at any wavelength. Hence, it provides a simple experimental setup for implementing the higher-accuracy diagnostic of the temporal phase distribution of nanosecond laser pulses. Keywords:nanosecond lase pulse/ temporal phase/ self-referencing/ temporal shearing
3.数值验证为了满足采样定理要求, 在本文提出的自参考移频剪切干涉测量方法中, 每个条纹至少要保证有3个采样点, 移频量$\text{δ} w$必须小于$\dfrac{1}{{3{\rm{d}}t}}\;{\rm{Hz}}$, 其中${\rm{d}}t$表示由光电探测器与示波器共同决定的采样分辨率. 另一方面, 为了使$S\left( w \right)$各级分量之间互不重叠, 移频量$\text{δ} w$需要足够大. 若待测量脉冲是1个时间半高全宽为$\Delta t$且啁啾率为$b$的高斯脉冲, $S\left( w \right)$的零级分量在频率轴上约$4/\Delta t\;{\rm{Hz}}$的范围内有意义, 一级分量在频率轴上约$6/\Delta t\;{\rm{Hz}}$的范围内有意义, 频移量$\text{δ} w$必须大于$\dfrac{5}{{\Delta t}} + b\tau \;{\rm{Hz}}$. 因此, 激光脉冲的移频量大小要介于$\dfrac{5}{{\Delta t}} + b\tau \;{\rm{Hz}}$和$\dfrac{1}{{3{\rm{d}}t}}\;{\rm{Hz}}$之间, 可确保重建的相位的精准度. 假设待测量脉冲是中心波长为640 nm的单高斯脉冲、随机啁啾单高斯脉冲、台阶脉冲和双高斯激光脉冲, 它们的时间真实强度波形和时间相位如图2(e)—(h)所示, 其中蓝色曲线为真实时间强度, 绿色实线为真实相位分布. 当所有脉冲的采样点个数为1024, 采样间隔为${\rm{d}}t = 125\;{\rm{ps}}$, 移频量大小设为1 GHz, 两脉冲之间的延时设为$\tau = 1.5\;{\rm{ns}}$, 两脉冲强度比为1时, 所得到的时间剪切干涉强度如图2(a)—(d) 所示. 利用前文描述的方法, 对图2(a)—(d)中四组时间剪切干涉条纹进行重建, 重建的相位在图2(e)—(h) 中用红色虚线表示, 可以看出, 重建的相位和实际相位差别为千分之一左右, 证明了上述方法具有良好的可行性. 将所测量的相位和示波器记录到的相位组合成激光脉冲的时间复振幅, 则可以计算出脉冲的精细光谱分布. 图2(i)—(l)中蓝色实线表示脉冲的真实光谱, 红色虚线表示测量出的光谱, 二者完全符合. 图 2 基于自参考时域剪切的纳秒相位测量技术的仿真结果. 每列表示不同强度分布脉冲的重建结果, 每一列中第一幅图是合束后的时域剪切干涉图; 第二幅中蓝色实线表示脉冲的时间强度分布, 绿色实线为原相位分布, 红色虚线为重建的相位分布; 第三幅中蓝色实线为计算所得的光谱分布, 红色虚线为原光谱分布 Figure2. Simulation results of phase retrieval of nanosecond laser pulses based on temporal shearing interferometry. Each column represents reconstructed results. In each column, the first plot represents the recorded temporal interferogram; the second plot presents the original temporal intensity distribution (blue solid line), original temporal phase distribution (green solid line) and reconstructed temporal phase distribution (red dashed line); the third shows the original spectral intensity distribution (blue solid line) versus reconstructed spectral intensity distribution (red dashed line).
为了检验本文所提方法在存在噪声情况下的测量精度, 在时域强度剪切干涉图上添加了不同程度的噪声. 图3(a)给出了在图2(a)—(d)的时域剪切干涉图上添加不同信噪比噪声时, 重建误差随信噪比变化的曲线图. 图3(b)—(d)的红色虚线给出了在图2(b)的时域剪切干涉图中分别添加10, 20, 40 dB信噪比的噪声时, 所得到的重建相位分布, 插图中蓝色实线表示根据时域复振幅计算所得的重建光谱分布, 红色虚线表示真实的光谱分布. 对比以上的仿真结果可以发现, 使用自参考移频剪切纳秒脉冲相位测量技术进行脉冲相位恢复具有很好的抗噪性, 对于上述四类脉冲而言, 当所记录时域剪切干涉图的信噪比不低于15 dB时, 脉冲的相位重建误差均小于5%, 可以认为重建的相位分布与原始的相位分布基本一致. 图 3 (a)不同强度分布的脉冲, 相位重建误差随信噪比变化的曲线图; (b)—(d)在图2(b) 所示的移频剪切图中分别添加信噪比(SNR)为10, 20, 40 dB的噪声下的重建结果, 其中的插图表示计算得到的光谱强度分布 Figure3. (a) Reconstructed error between reconstructed and original signals as a function of the SNR for pulse with different intensity distribution; (b)–(d) reconstructed pulse distribution for SNR of 10, 20, 40 dB, respectively, and the computed spectra is presented in the inset.
在上面的计算中, 脉冲之间的延时量(这里相对延时定义为$\tau /\Delta t$, 其中$\tau $为延时量大小, $\Delta t$为待测脉冲的时间半高全宽)太大会使得所求的相位梯度存在高阶微分项, 太小则会导致求得的相位梯度被噪声覆盖, 因此脉冲相对延时量大小也是影响重建相位精度的重要因素. 图4(a)为图2(e)—(g)所示的3类不同脉冲的相位重建误差随着相对延时变化的曲线图(延时脉冲和移频脉冲的相对强度设为1, 移频量大小设为1 GHz, 信噪比设为30 dB). 可以发现, 在脉冲的相干时间范围内, 当两脉冲的相对延时在0.5%—28%之间时, 该相位恢复算法能够可靠地恢复出待测脉冲的时域相位分布. 图 4 (a) 不同强度分布的脉冲, 相位重建误差随相对延时变化的曲线图; (b) 不同强度分布的脉冲, 相位重建误差随相对强度变化的曲线图 Figure4. (a) Reconstructed error between reconstructed and original signals as a function of relative delay for pulse with different intensity distribution; (b) reconstructed error between reconstructed and original signals as a function of relative intensity delay for pulse with different intensity distribution.


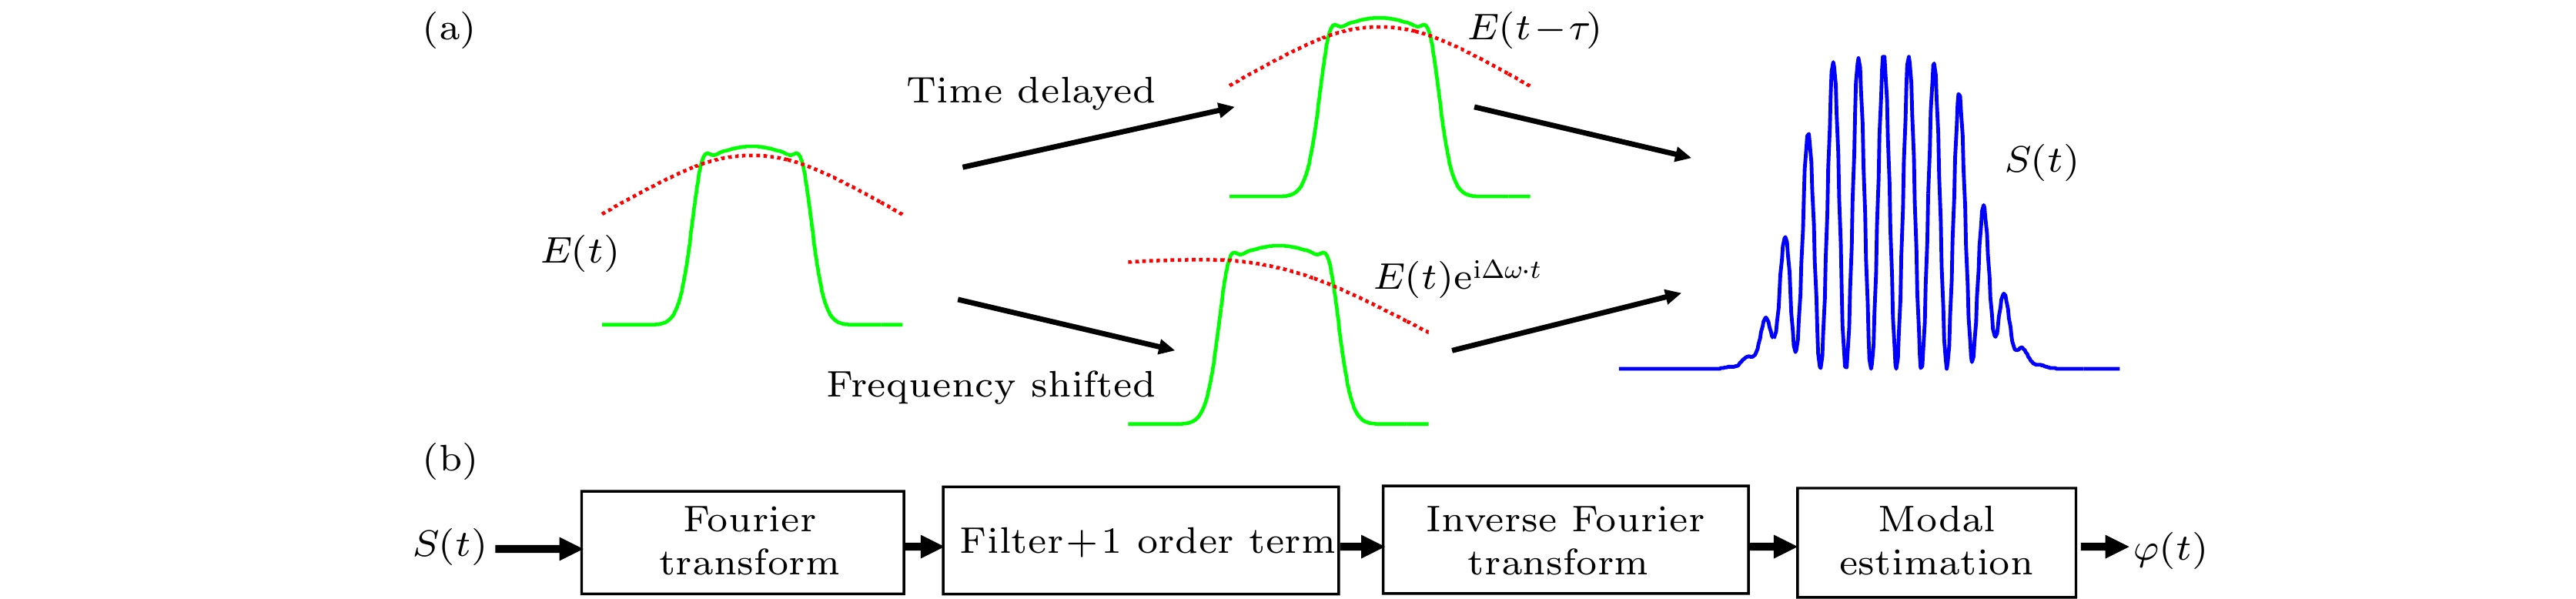 图 1 (a)自参考时域剪切纳秒相位测量技术原理; (b)重建过程


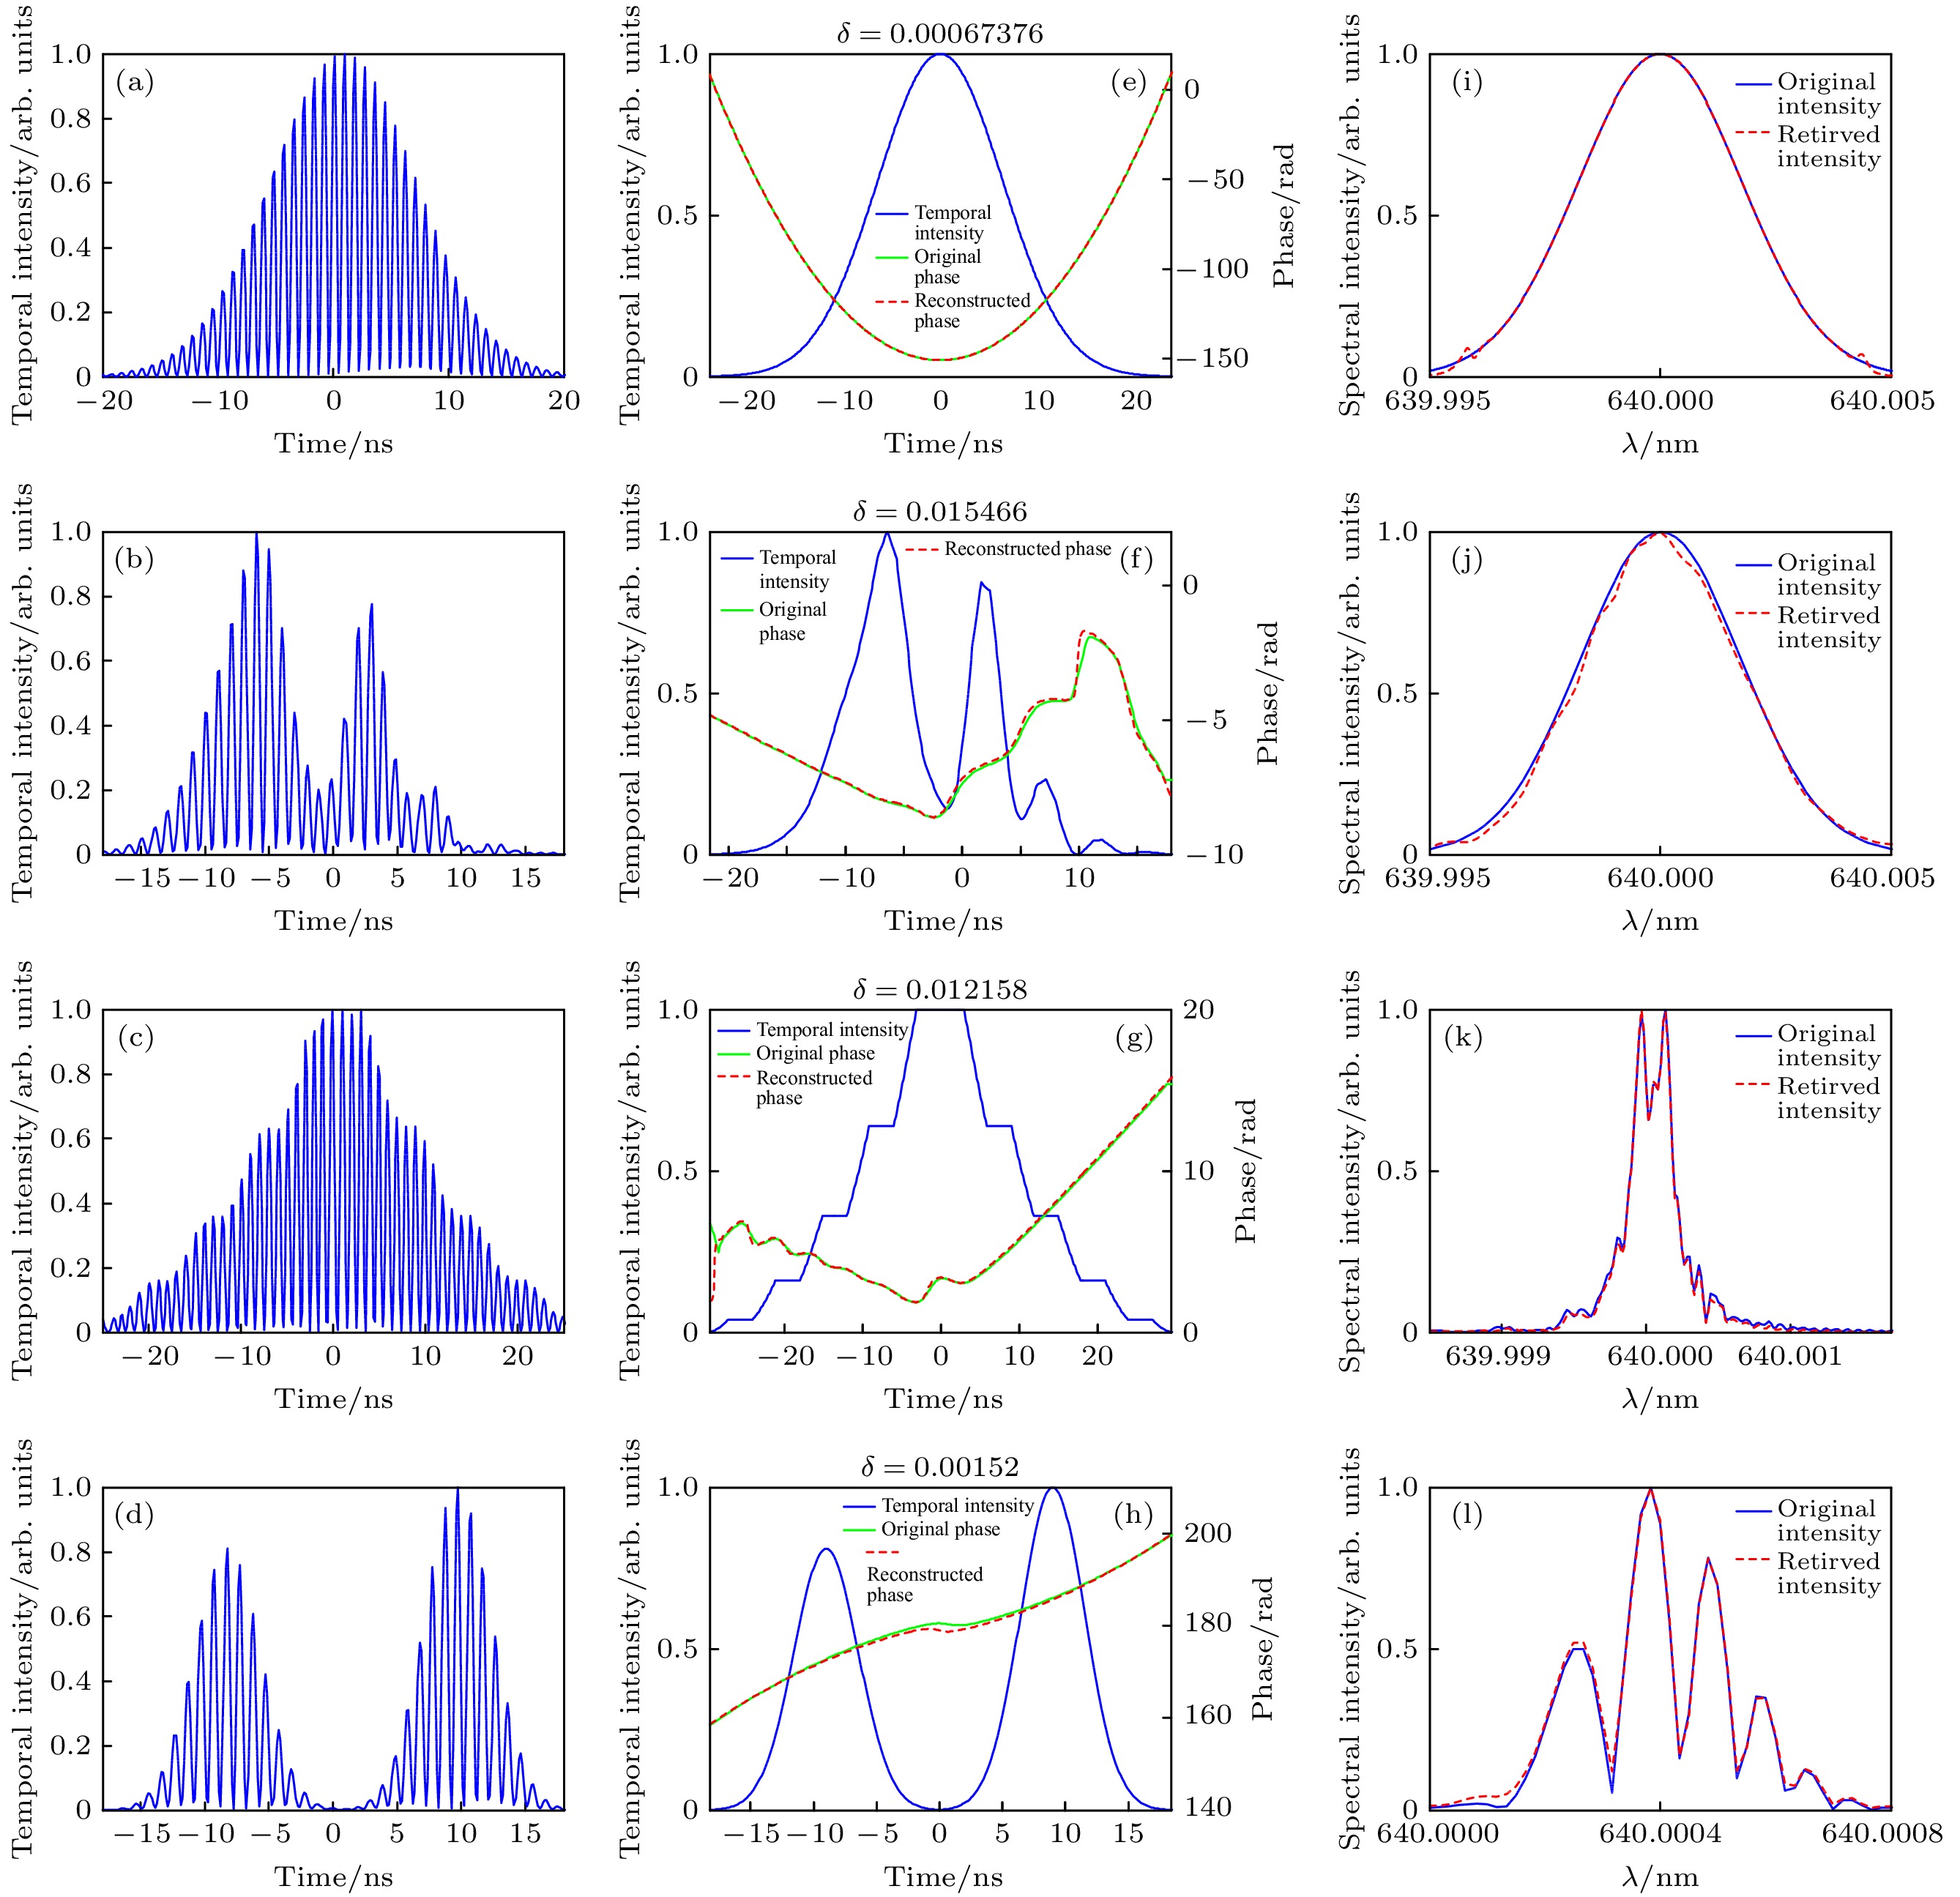 图 2 基于自参考时域剪切的纳秒相位测量技术的仿真结果. 每列表示不同强度分布脉冲的重建结果, 每一列中第一幅图是合束后的时域剪切干涉图; 第二幅中蓝色实线表示脉冲的时间强度分布, 绿色实线为原相位分布, 红色虚线为重建的相位分布; 第三幅中蓝色实线为计算所得的光谱分布, 红色虚线为原光谱分布
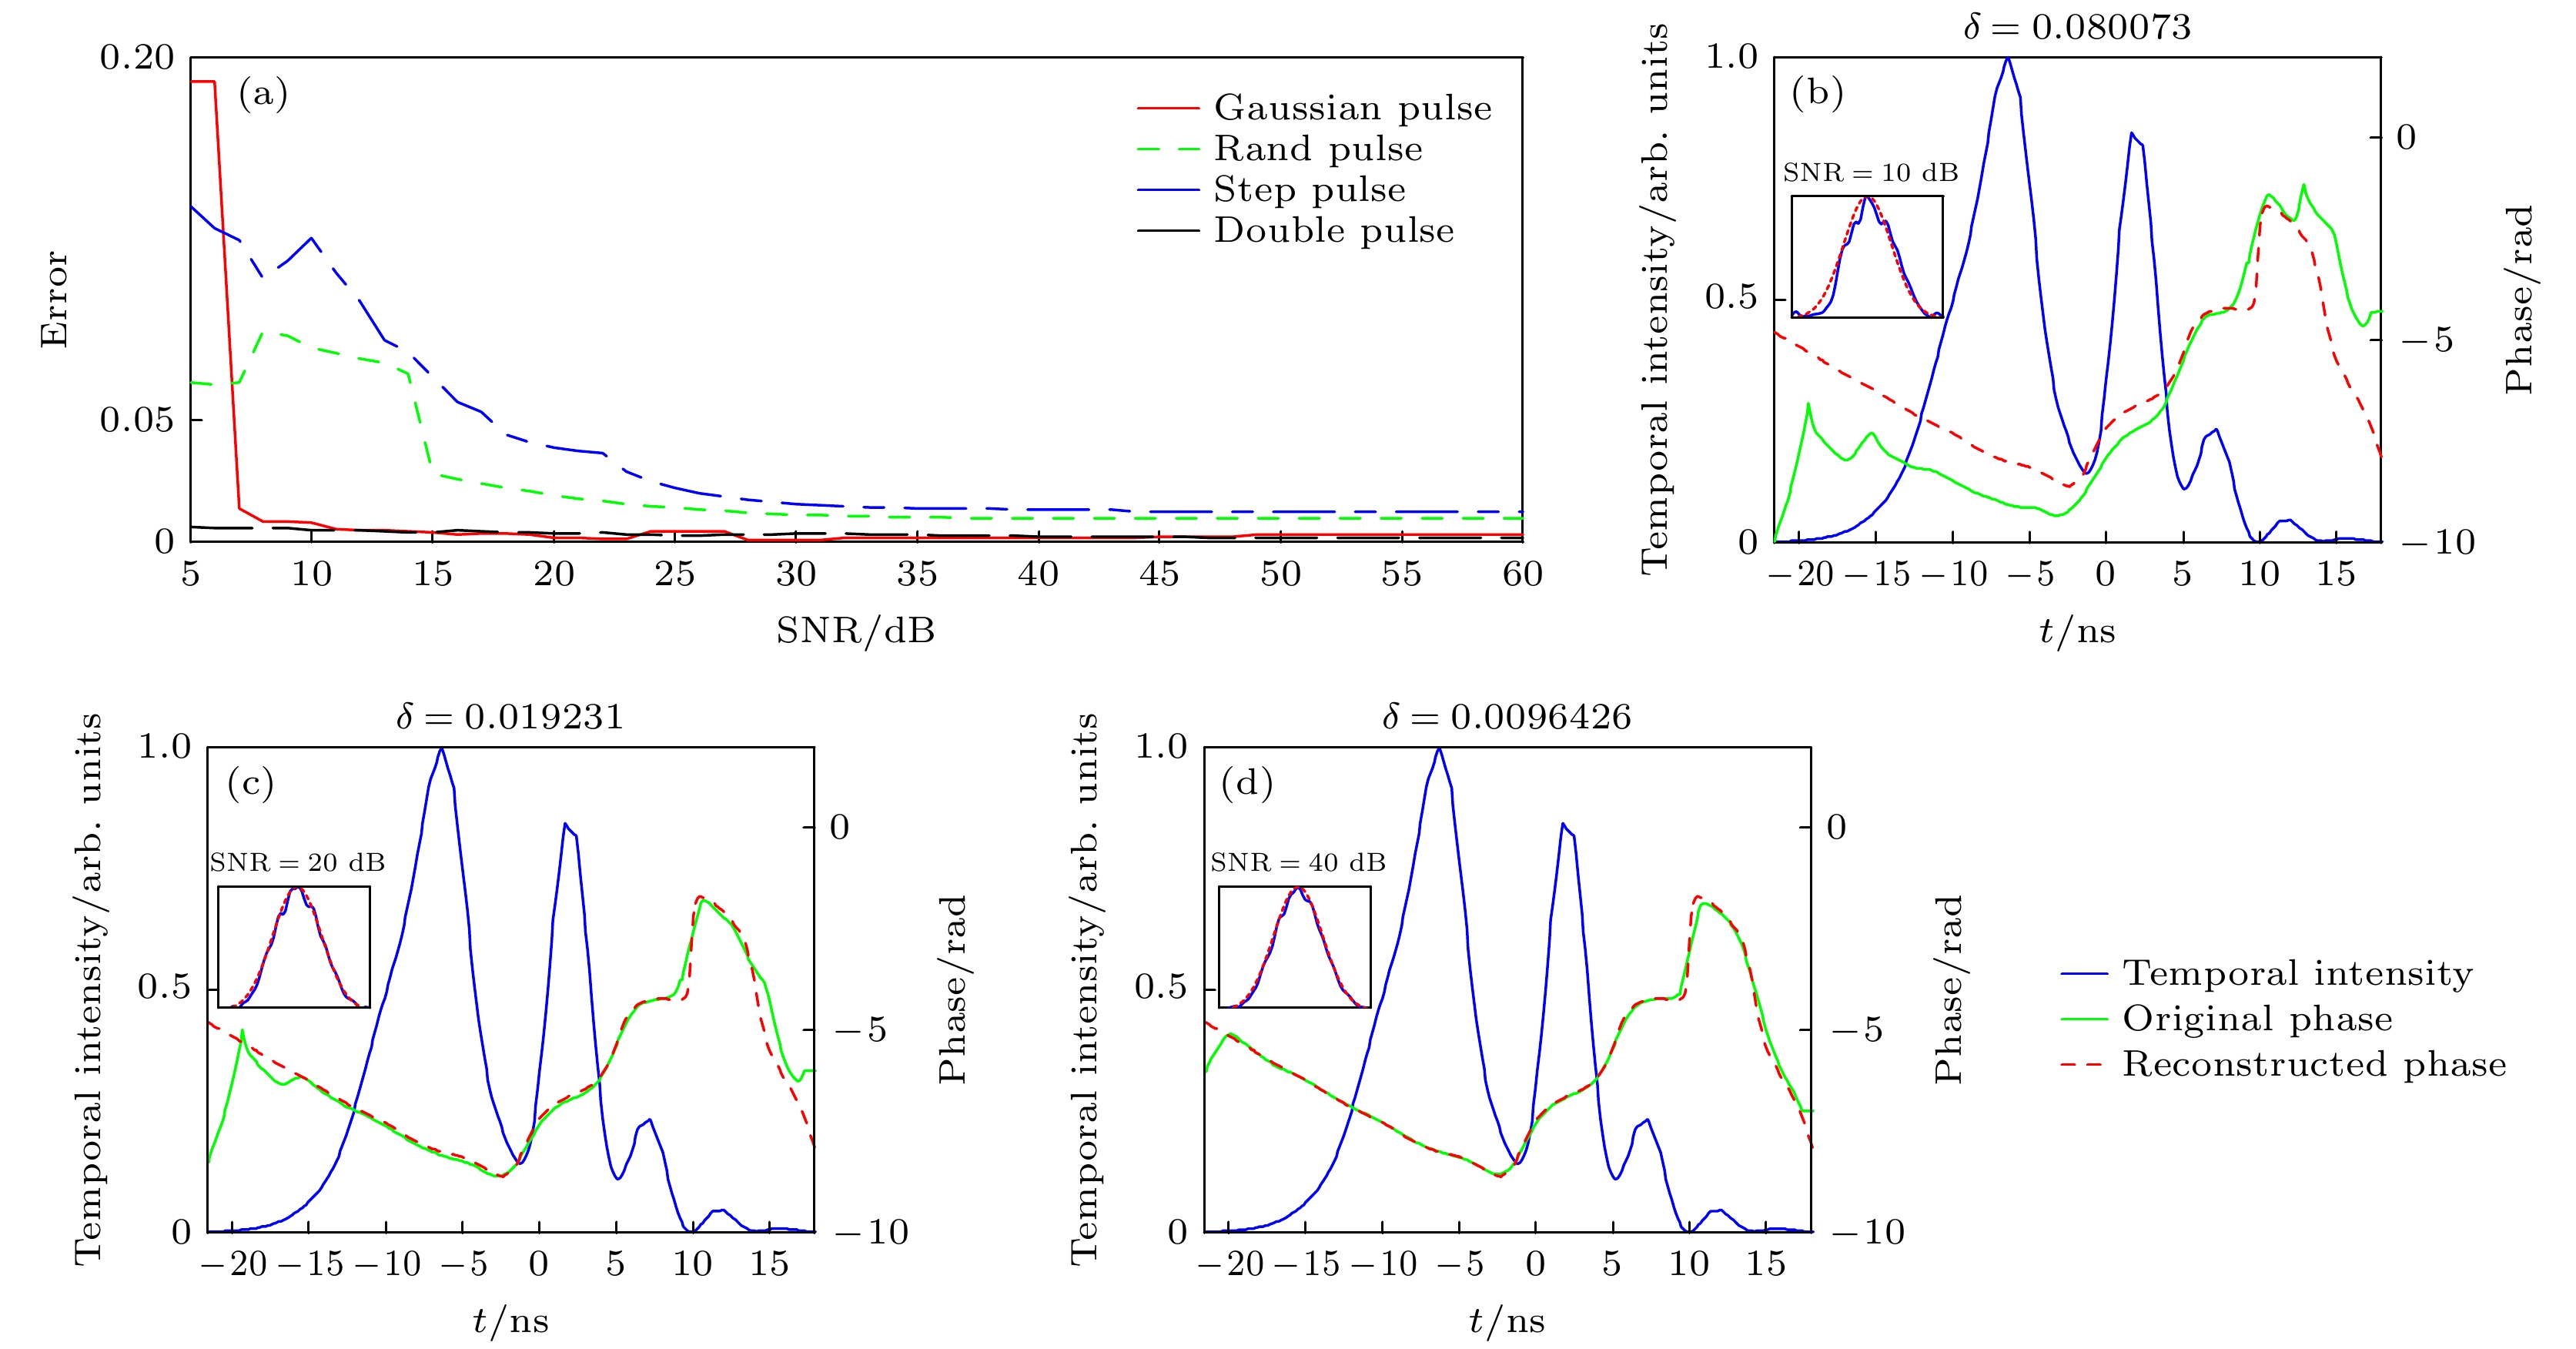 图 3 (a)不同强度分布的脉冲, 相位重建误差随信噪比变化的曲线图; (b)—(d)在图2(b) 所示的移频剪切图中分别添加信噪比(SNR)为10, 20, 40 dB的噪声下的重建结果, 其中的插图表示计算得到的光谱强度分布


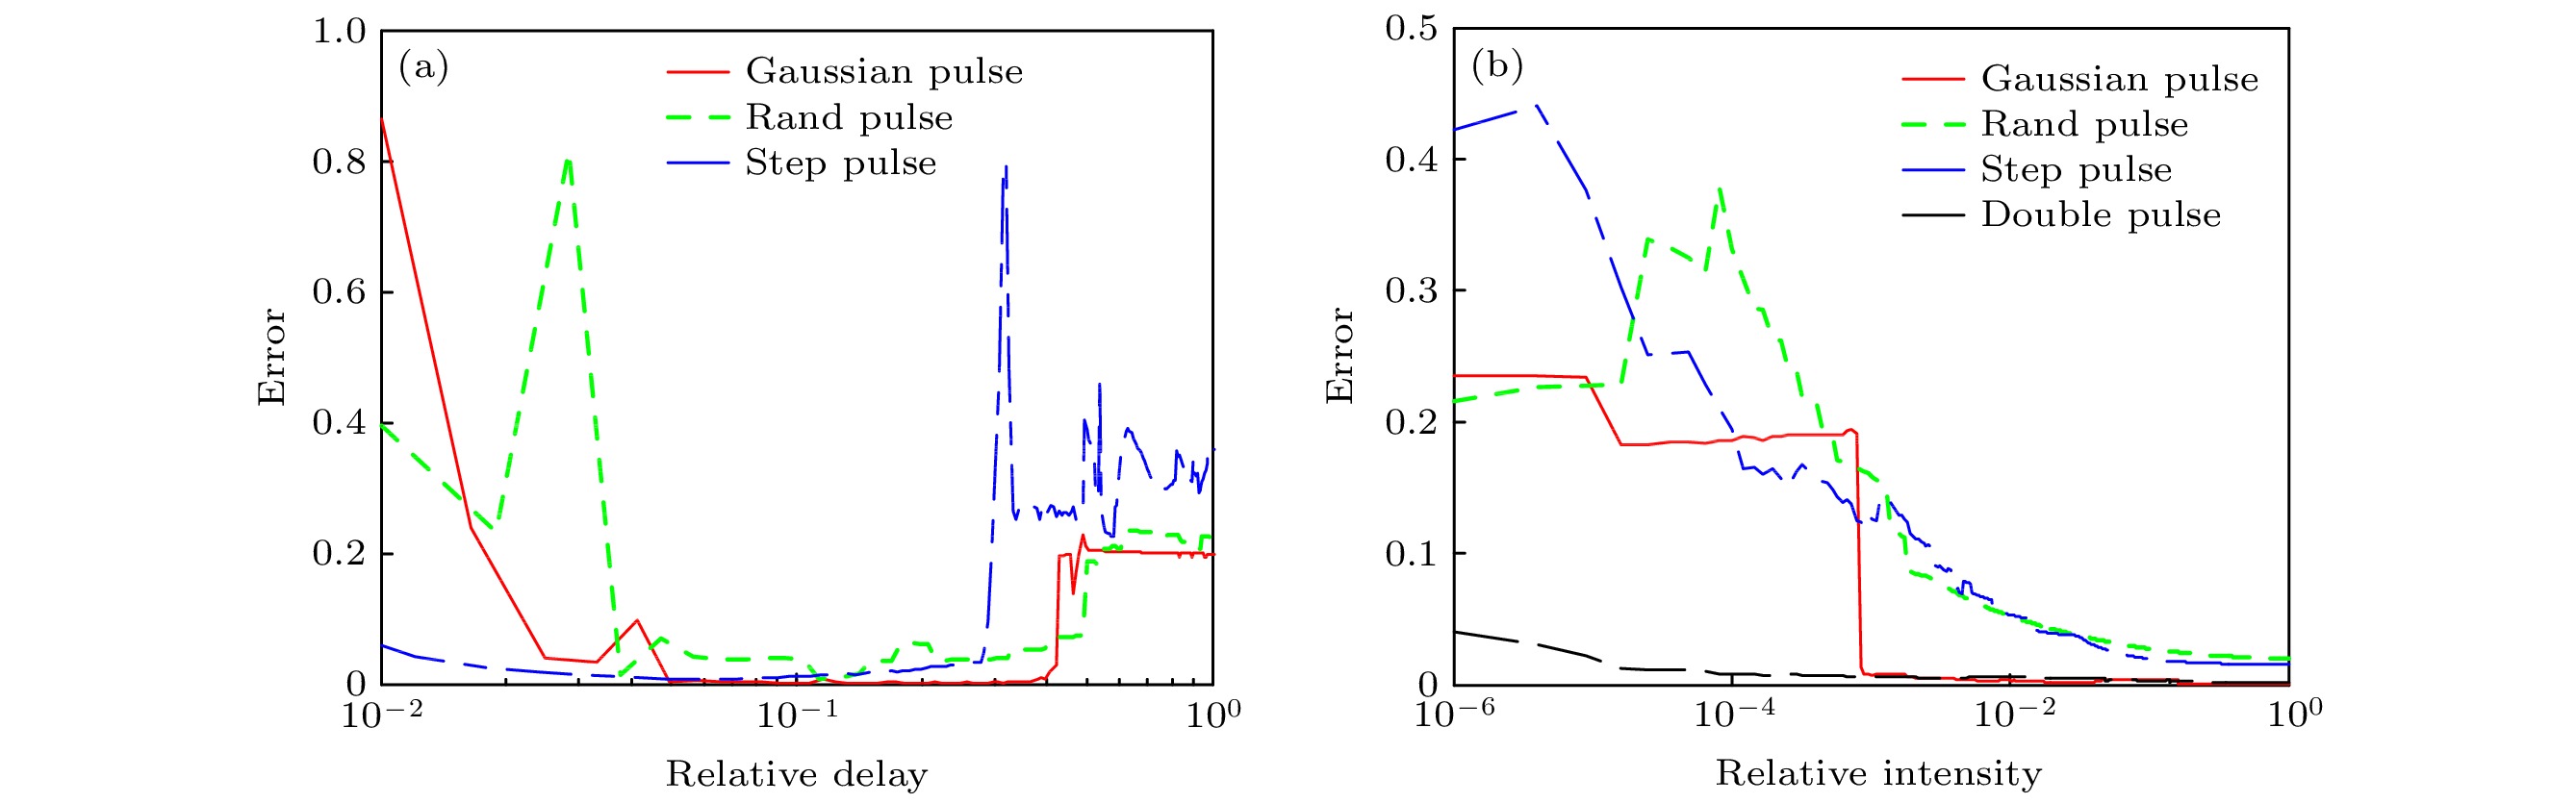 图 4 (a) 不同强度分布的脉冲, 相位重建误差随相对延时变化的曲线图; (b) 不同强度分布的脉冲, 相位重建误差随相对强度变化的曲线图


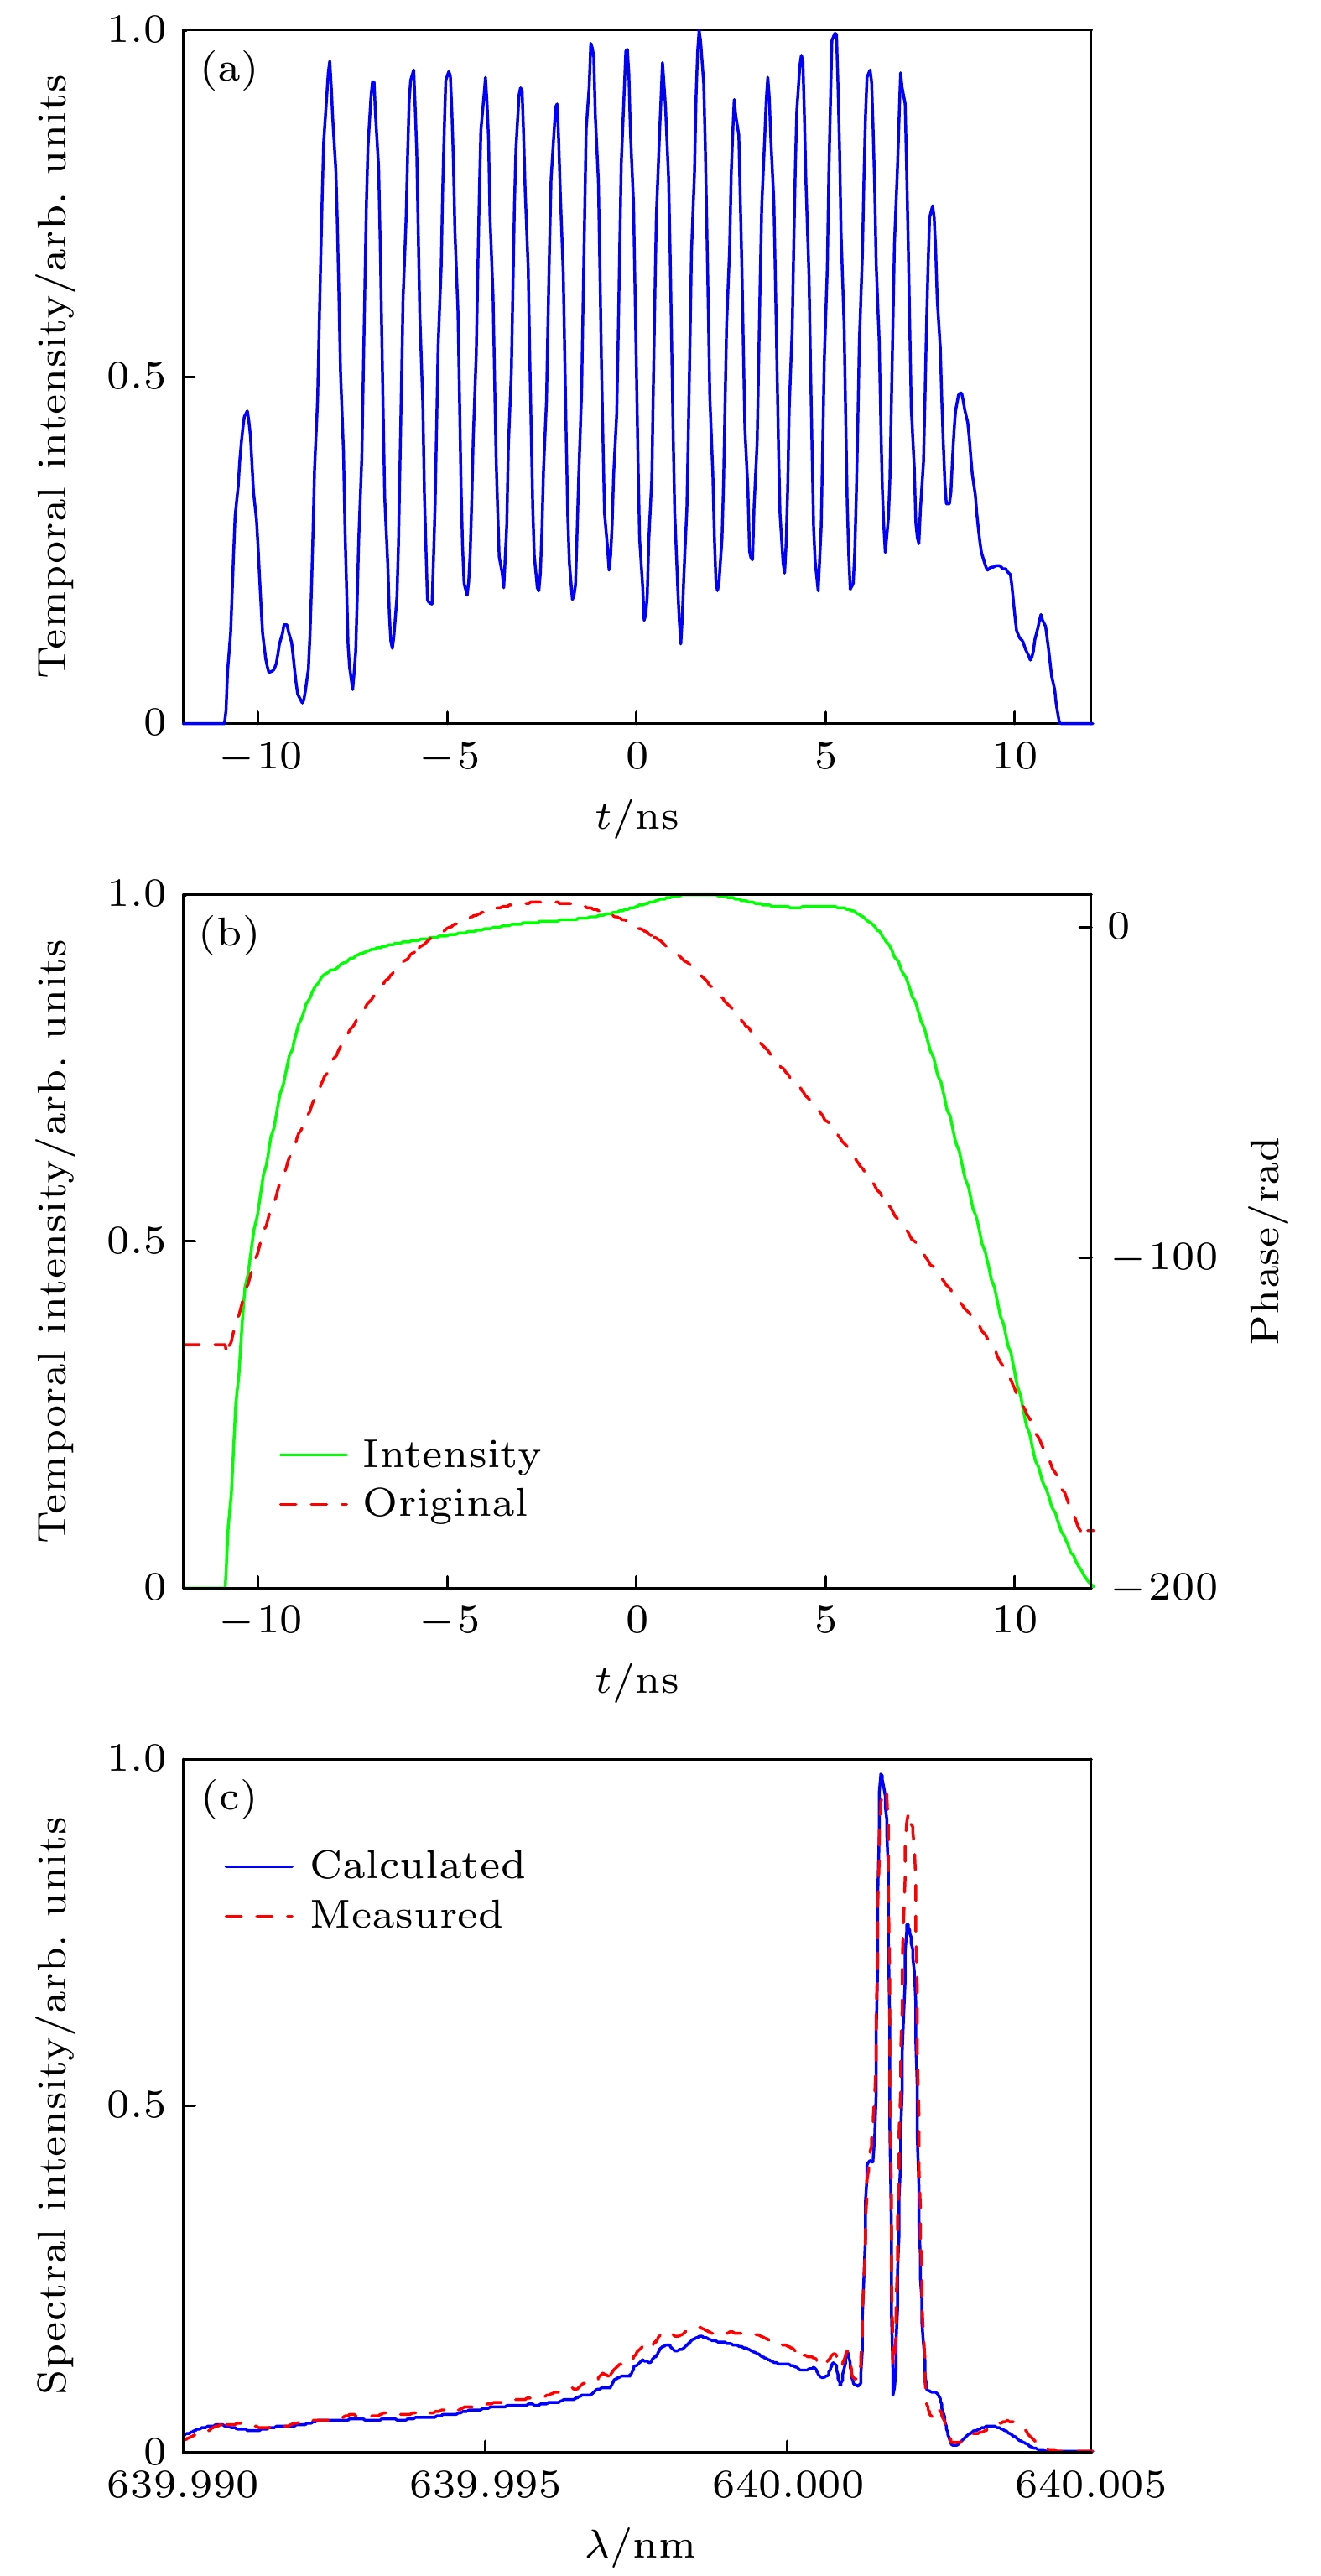 图 5 实验结果 (a) 实验记录的时间剪切干涉图; (b) 重建的时间相位分布(红色虚线)和示波器记录到的时间强度图(绿色实线); (c) 计算光谱强度分布(蓝色实线)和测得的光谱强度分布(红色虚线)