1.School of Mathematical Science, Henan Institute of Science and Technology, Xinxiang 453003, China 2.School of Aerospace Engineering and Applied Mechanics, Tongji University, Shanghai 200092, China
Fund Project:Project supported by the National Natural Science Foundation of China (Grant Nos. 12072236, 11872276), the Postdoctoral Research Project of Henan Province, China (Grant No. 19030095), and the Key R&D and Promotion Special Project of Henan Province(Science and Technology Targeting), China (Grant No. 212102210543)
Received Date:28 January 2021
Accepted Date:22 March 2021
Available Online:07 June 2021
Published Online:05 September 2021
Abstract:Bursting is a complex multiple-time-scale nonlinear phenomenon in a nervous system and exhibits diverse patterns, which is modulated by the excitatory or inhibitory effect to achieve the physiological functions. According to the bifurcations of the fast subsystem, bursting is classified as different patterns including the mixed-mode bursting. Recently, many studies have found the paradoxical phenomena contrary to the common concept that the inhibitory effect induces the electrical activity to decrease or the excitatory effect induces the discharge activity to increase, which enriches the connotation of the nonlinear dynamics. To identify more examples of paradoxical phenomena of different bursting patterns and the underlying nonlinear mechanism, in the present study the paradoxical phenomena for the complex mixed-mode oscillations of the bursting pattern induced by the self-feedback mediated by both the inhibitory autapse and excitatory autapse and the bifurcation mechanism are acquired in the modified Morris-Lecar model. By using the fast/slow variable dissection method, the complex dynamics of the bursting is acquired, which is that the depolarization block behavior appears after the burst and before the quiescent state. The burst begins from a saddle-node bifurcation in an invariant cycle (SNIC) and terminates at a fold limit cycle (FLC) bifurcation. Furthermore, the FLC bifurcation is identified to play a key role in generating the paradoxical phenomenon. The inhibitory autapse induces the FLC bifurcation to shift leftward. However, the SNIC point remains unchanged. The change of FLC bifurcation point leads the parameter range of the burst to widen, the number of spikes per burst to become larger, and the average firing frequency to turn higher. Unlike the inhibitory autapse, the excitatory autapse induces the FLC bifurcation to shift rightward, and SNIC to be unchanged, thus reducing the bursting activity. Such results are different from those of the paradoxical phenomenon induced by the inhibitory autapse instead of excitatory autapse for the other bursting pattern and by the slow auatpse, which present a novel example and regulation mechanism of the paradoxical phenomena of the bursting patterns and show the diversity of the paradoxical phenomena, thus helping understand the potential functions of the bursting and self-feedback modulations of the brain neurons. Keywords:bifurcation/ bursting/ self-feedback/ paradoxical behavior/ mixed-mode oscillation
周期6簇放电的快慢变量分离结果如图2所示. 选取慢变量u作为分岔参数, 在$ (u, V) $平面上获得快子系统(5)和(6)的平衡点曲线和极限环. 平衡点曲线呈“Z”型(黑色), 其上支由焦点组成, 实线表示稳定焦点, 虚线表示不稳定焦点; 中支由鞍点组成, 用虚线表示; 下支由稳定结点组成, 用实线表示. 在平衡点曲线的上支中, 稳定和不稳定焦点的分界点是亚临界Hopf分岔(sub-Hopf); 下支与中支交于不变环上的鞍结分岔(SNIC), 同时经过该SNIC会产生稳定极限(蓝色实线). 该稳定极限和通过sub-Hopf分岔产生的不稳定极限环(蓝色虚线) 碰撞形成极限环的鞍结分岔(FLC). 稳定极限环的最大值和最小值分别由$ {V_{\max }} $和$ {V_{\min }} $表示. 图 2 周期6簇放电的快慢变量分离 (a) 快子系统的平衡点及分岔. 上支黑色实线表示稳定的焦点, 黑色虚线表示不稳定的焦点, 中支黑色虚线表示鞍点, 下支黑色实线表示稳定的结点, H点为sub-Hopf分岔点, SNIC为不变环上的鞍结分岔点. $ {V_{\max }} $和$ {V_{\min }} $表示稳定极限环的极大和极小值. (b) 快子系统的极限环分岔(蓝色实线表示稳定的极限环, 蓝色虚线表示不稳定的极限环)与图(a)的叠加. (c)周期6簇放电的相轨线(红)与图(b)的叠加. (d) 图(c)的局部放大, 数字1—6表示一个簇内的第1—6个峰 Figure2. Fast/slow variable dissection of the period-6 bursting: (a) Bifurcation diagram of the equilibria of the fast subsystem. Upper black solid line, upper black dotted line, middle black dotted line, and lower black solid line is composed of the stable focus, unstable focus, saddle, and stable node, respectively. H and SNIC represents the subcritical Hopf bifurcation and saddle-node bifurcation on an invariant circle. $ {V_{\max }} $ and $ {V_{\min }} $ represent the maximal and minimal value of the stable limit cycle, respectively. (b) Bifurcation diagram of the limit cycles (solid and dashed bule lines represent the stable and unstable limit cycle) of the fast subsystem and Fig. (a) plotted in one figure. (c) The trajectory of the period-6 bursting (red) superimposes Fig. (b). (d) Partial enlargement of Fig. (c). The numbers 1–6 represents the 1st–6th spikes within a burst.
抑制性和兴奋性自突触作用的结果分别如图3左列和右列所示. 图3左侧为加入了不同电导强度的抑制性自突触电流(红色)的膜电位(黑色)的时间历程. 图3(a1), 图3(a2)和图3(a3)对应的电导分别为0.01, 0.015和0.02. 随着自突触抑制性作用的增强, 簇内峰的个数明显增多, 从6增加至8, 10和19. 由此可见, 抑制性的自突触电流引起簇内峰的个数增加, 与传统观念的应该降低不同. 图 3 自突触电流(红)影响下的膜电位(黑) (a1)—(a3) 抑制性自突触 (a1) 周期8簇放电, $ g = 0.01 $; (a2) 周期10簇放电, $ g = 0.015 $; (a3) 周期19簇, $ g = 0.02 $. (b1)—(b3) 兴奋性自突触 (b1) 周期3簇放电, $ g = 0.02 $; (b2) 周期2簇放电, $ g = 0.03 $; (b3) 周期1簇放电, $ g = 0.04 $ Figure3. Membrane potential (black) under the influence of autaptic current (red). (a1)–(a3) Inhibitory autapse: (a1) Period-8 bursting when $ g = 0.01 $; (a2) period-10 bursting when $ g = 0.015 $; (a3) period-19 bursting when $ g = 0.02 $. (b1)–(b3) Excitatory autupse: (b1) Period-3 bursting when $ g = 0.02 $; (b2) period-2 bursting when $ g = 0.03 $; (b3) Period-1 bursting when $ g = 0.04 $.
图3右侧为加入了不同电导的兴奋性自突触电流(红色)的膜电位(黑色)的时间历程, 图3(b1), 图3(b2)和图3(b3)对应的电导分别为0.02, 0.03和0.04. 与抑制性自突触电流引起簇内峰个数增多的结果相反, 兴奋性自突触电流引起簇内峰的个数减少, 由6个减少为3个, 2个和1个. 另外, 兴奋性自突触电流使放电呈现出明显的减弱现象, 与传统观念的应该增强不同. 抑制性和兴奋性自突触下的簇放电的峰峰间期(interspike interval, ISI)如图4(a), (b)所示. 不同颜色代表不同自突触电导. 图4(a), (b)给出了一个周期内的ISI随ISI序号的变化. 长的ISI为两个簇的间隔, 短的ISI为簇内峰的间隔. 可以看出, 不论是抑制性自突触还是兴奋性自突触, 簇内峰的ISI在不同电导下差别不大, 大约为20; 而长ISI, 即簇簇间隔在不同的电导下的差别也不大. 因此, 对于抑制性自突触, 放电的增强主要是自突触诱发簇内放电个数增多引起的, 如图4(a)所示, 进而引起平均放电频率的增加; 对于兴奋性自突触, 放电变弱也主要是自突触诱发簇内放电个数变化减少引起的, 如图4(b)所示, 进而引起平均放电频率的降低. 图 4 不同自突触电导下的簇放电的峰峰间期ISI随序号的变化 (a) 抑制性自突触, $ g = 0 $(蓝), $ g = 0.01 $(绿), $ g = 0.015 $(红)和$ g = 0.02 $(黑); (b) 兴奋性自突触, $ g = 0 $(蓝), $ g = 0.02 $(粉)和$ g = 0.03 $(青) Figure4. Change of ISI respect to the sequential number at different levels of autaptic conductance: (a) Inhibitory autaptic current, blue, green, red, and black lines represent $ g = 0 $, $ g = 0.01 $, $ g = 0.015 $, and $ g = 0.02 $, respectively; (b) excitatory autaptic current, blue, pink, and cyan-blue lines represents $ g = 0 $, $ g = 0.02 $, and $ g = 0.03 $, respectively.
对于抑制性自突触, 簇放电的平均放电频率随自突触电导增加而增加, 如图5(a)的上(绿)线所示, 而自突触电导的增加会引起平均自突触电流的增强, 如图5(a)的下(蓝)线所示. 因此, 增强的抑制性自突触电流引起了簇放电的平均放电频率增加. 对于兴奋性自突触, 随自突触电导的增加, 平均自突触电流增强, 簇放电的平均放电频率减小, 分别如图5(b)的下(蓝)线和上(绿)线所示, 说明增强的兴奋性自突触电流引起了簇放电的平均放电频率降低. 图 5 平均放电频率(上, 绿)与自突触电流的平均值(下, 蓝)随自突触电导g的变化 (a) 抑制性自突触; (b) 兴奋性自突触 Figure5. Change of the mean firing frequency (green, upper) and the mean value of autaptic current (blue, lower) with respect to g: (a) Inhibitory autapse; (b) excitatory autapse.
23.4.抑制性和兴奋性自突触分别引起反常现象的动力学机制: 分岔点的变化 -->
3.4.抑制性和兴奋性自突触分别引起反常现象的动力学机制: 分岔点的变化
利用快慢变量分离的方法, 对上述不同电导强度下的快子系统的平衡点分岔以及相应的相轨线进行分析, 进一步探究反常现象的动力学机制. 抑制性和兴奋性自突触对应的快子系统的分岔分别如图6左列((a1)—(a4))和图6右列((b1)—(b4))所示, 抑制性和兴奋性自突触对应的簇放电的慢变量分离的结果分别如图7和图8所示. 图 6 不同自突触电导强度下快子系统的分岔 (a1)—(a4) 抑制性自突触: (a1)平衡点分岔; (a2) 图(a1)的局部放大; (a3) 极限环分岔与图(a1)的叠加; (a4) 图(a3)的局部放大. 电导强度的取值为$ g = 0 $(蓝), $ g = 0.01 $(绿), $ g = 0.015 $(红)和$ g = 0.02 $(黑). (b1)—(b4)兴奋性自突触: (b1) 平衡点分岔; (b2) 图(b1)的局部放大; (b3) 极限环分岔与图(b1)的叠加; (b4) 图(b3)的局部放大. 电导强度的取值为$ g = 0 $(蓝), $ g = 0.02 $(粉), $ g = 0.03 $(青)和$ g = 0.04 $(棕) Figure6. Bifurcations of the fast subsystem at different values of the autapse conductance. (a1)–(a4) Inhibitory autapse: (a1) Bifurcations of the equilibria; (a2) partial enlargement of Fig. (a1); (a3) bifurcations of the limit cycles superimposes Fig. (a1); (a4) partial enlargement of Fig. (a3). Blue, green, red, and black lines represent $ g = 0 $, $ g = 0.01 $, $ g = 0.015 $, and $ g = 0.02 $, respectively. (b1)–(b4) Excitatory autapse: (b1) Bifurcations of the equilibria; (b2) partial enlargement of Fig. (b1); (b3) bifurcation of the limit cycles superimposes Fig. (b1); (b4) partial enlargement of Fig. (b3). Blue, pink, cyan-blue, and brown curves represents $ g = 0 $, $ g = 0.02 $, $ g = 0.03 $ and $ g = 0.04 $, respectively.
图 7 不同抑制性自突触电导强度下的簇放电的快慢变量分离 (a1) $ g = 0 $; (a2) 图(a1)的放大; (b1) $ g = 0.01 $, 数字1—6代表簇内第1—6个放电峰; (b2) 图(b1)的放大; (c1) $ g = 0.015 $; (c2) 图(c1)的放大; (d1) $ g = 0.02 $; (d2) 图(d1)的放大 Figure7. Fast/slow variable dissection of bursting at different values of the inhibitory autapse conductance: (a1) $ g = 0 $, and the numbers 1–6 represent the 1st–6th spikes within a burst; (a2) enlargement of Fig. (a1); (b1) $ g = 0.01 $; (b2) enlargement of Fig. (b1); (c1) $ g = 0.015 $; (c2) enlargement of Fig. (c1); (d1) $ g = 0.02 $; (d2) enlargement of Fig. (d1).
图 8 不同兴奋性自突触电导强度下簇放电的快慢变量分离 (a) $ g = 0 $; (b) $ g = 0.02 $; (c) $ g = 0.03 $; (d) $ g = 0.04 $ Figure8. Fast/slow variable dissection of the bursting at different values of the excitatory autapse conductance: (a) $ g = 0 $; (b) $ g = 0.02 $; (c) $ g = 0.03 $; (d) $ g = 0.04 $.
抑制性和兴奋性自突触作用下的快子系统的稳定极限环的周期分别如图9(a)和图9(b)所示. 不同颜色对应不同的自突触电导, 对某一自突触电导, 左侧较小值对应FLC附近的极限环的周期, 右侧较大值对应SNIC附近的极限环的周期. 随着抑制性自突触电导的增强, FLC左移, 极限环的范围扩大, 新出现的极限环的周期略有降低的趋势, 但差别不大. 随着兴奋性自突触电导的增强, FLC右移. 无论抑制性还是兴奋性自突触, 同一u值下的极限环的周期差别较小. 对于不靠近SNIC的极限环, 其周期不在同u下, 大约为20, 差别也不大. 这就是图4所示的簇内ISI差别不大, 大约在20左右的原因. 因为簇内峰与快子系统极限环有对应, 簇内峰的ISI与快子系统的极限环有对应. 图 9 快子系统的极限环的周期随分岔参数u的变化 (a) 抑制性自突触, 蓝, 绿, 红和黑色曲线分别对应$ g = 0 $, $ g = 0.01 $, $ g = 0.015 $和$ g = 0.02 $; (b) 兴奋性自突触, 蓝、粉、青和棕色曲线分别对应g = 0, g = 0.02, g = 0.03和g = 0.04 Figure9. Period of the limit cycle of the fast system changes with respect to the bifurcation parameter u: (a) Inhibitory autupse. The blue, green, red, and black curves correspond to $ g = 0 $, $ g = 0.01 $, $ g = 0.015 $, and $ g = 0.02 $, respectively. (b) Excitatory autupse. The blue, pink, cyan-blue, and brown curves correspond to g = 0, g = 0.02, g = 0.03, and g = 0.04, respectively.


 图 1 MML模型未加自突触的混合簇放电的膜电位 (a) 周期3,


 图 2 周期6簇放电的快慢变量分离 (a) 快子系统的平衡点及分岔. 上支黑色实线表示稳定的焦点, 黑色虚线表示不稳定的焦点, 中支黑色虚线表示鞍点, 下支黑色实线表示稳定的结点, H点为sub-Hopf分岔点, SNIC为不变环上的鞍结分岔点.


 图 3 自突触电流(红)影响下的膜电位(黑) (a1)—(a3) 抑制性自突触 (a1) 周期8簇放电,


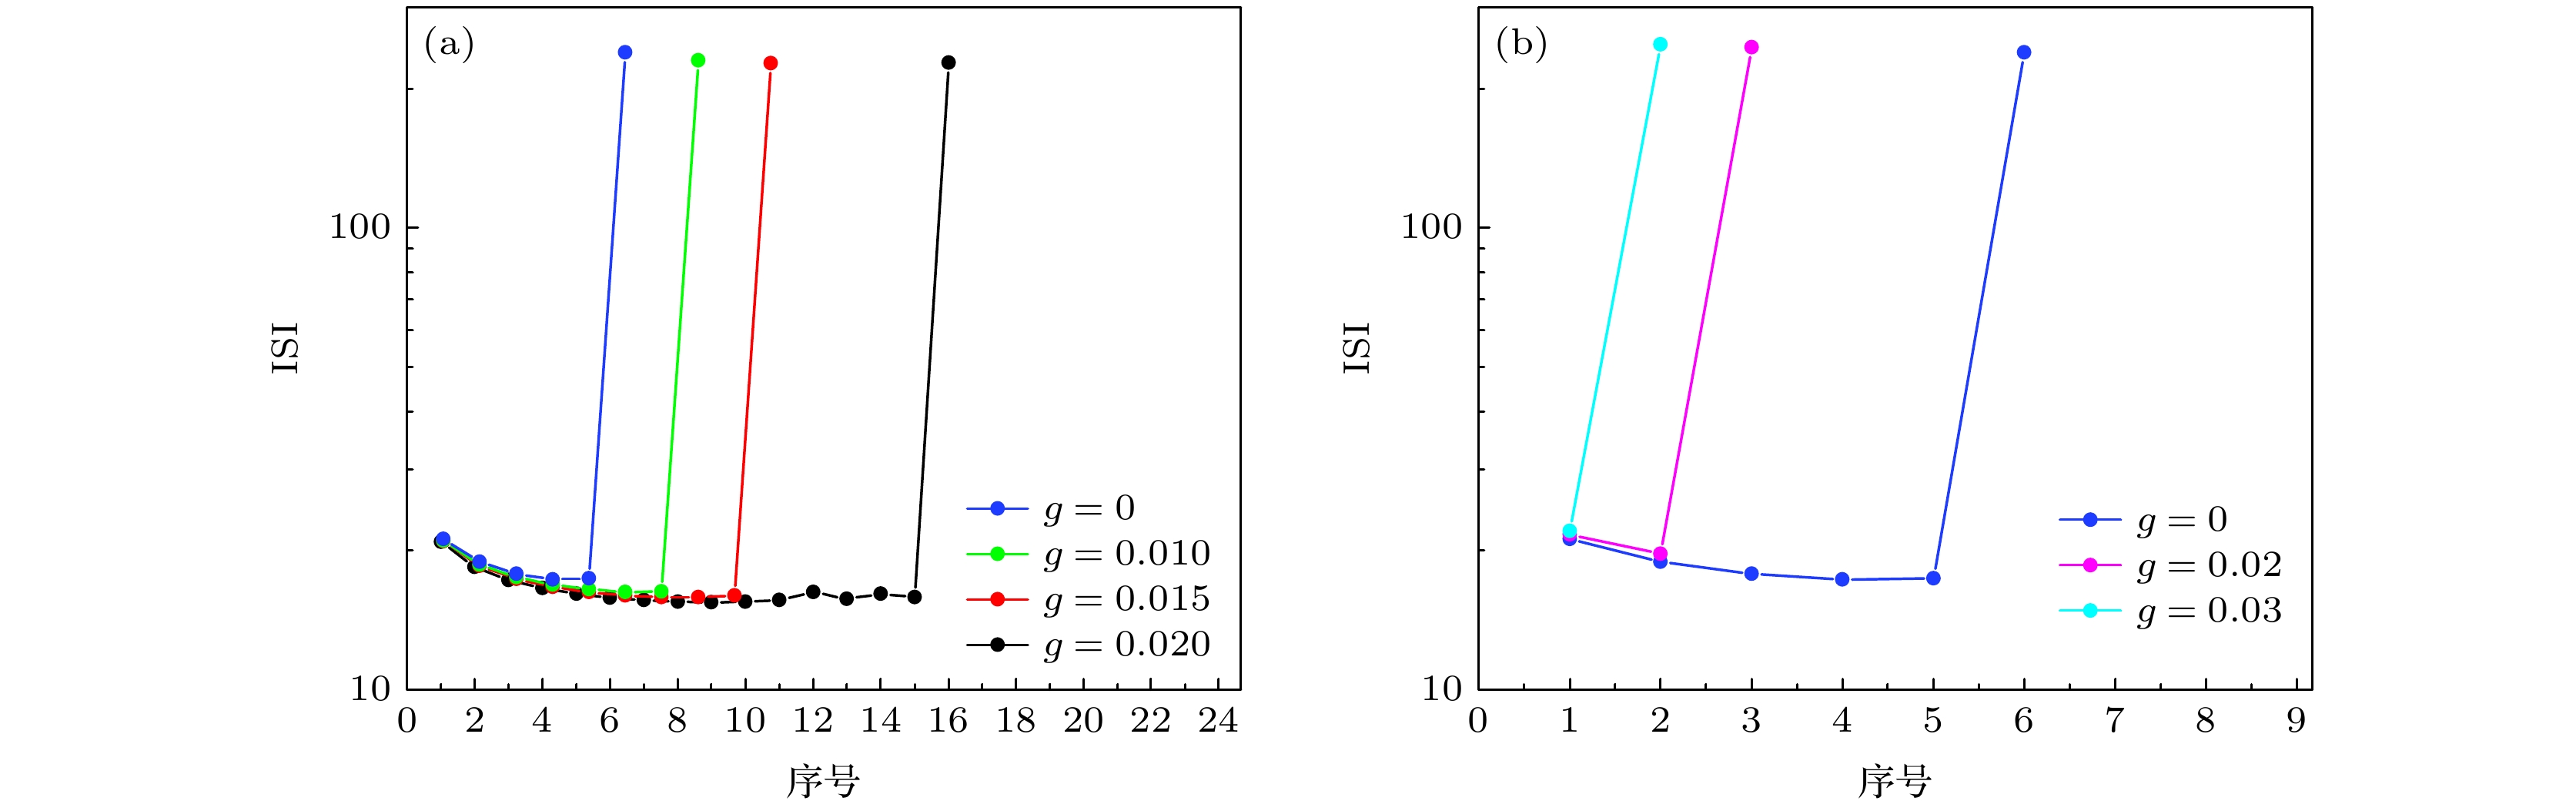 图 4 不同自突触电导下的簇放电的峰峰间期ISI随序号的变化 (a) 抑制性自突触,


 图 5 平均放电频率(上, 绿)与自突触电流的平均值(下, 蓝)随自突触电导g的变化 (a) 抑制性自突触; (b) 兴奋性自突触
 图 6 不同自突触电导强度下快子系统的分岔 (a1)—(a4) 抑制性自突触: (a1)平衡点分岔; (a2) 图(a1)的局部放大; (a3) 极限环分岔与图(a1)的叠加; (a4) 图(a3)的局部放大. 电导强度的取值为


 图 7 不同抑制性自突触电导强度下的簇放电的快慢变量分离 (a1)


 图 8 不同兴奋性自突触电导强度下簇放电的快慢变量分离 (a)


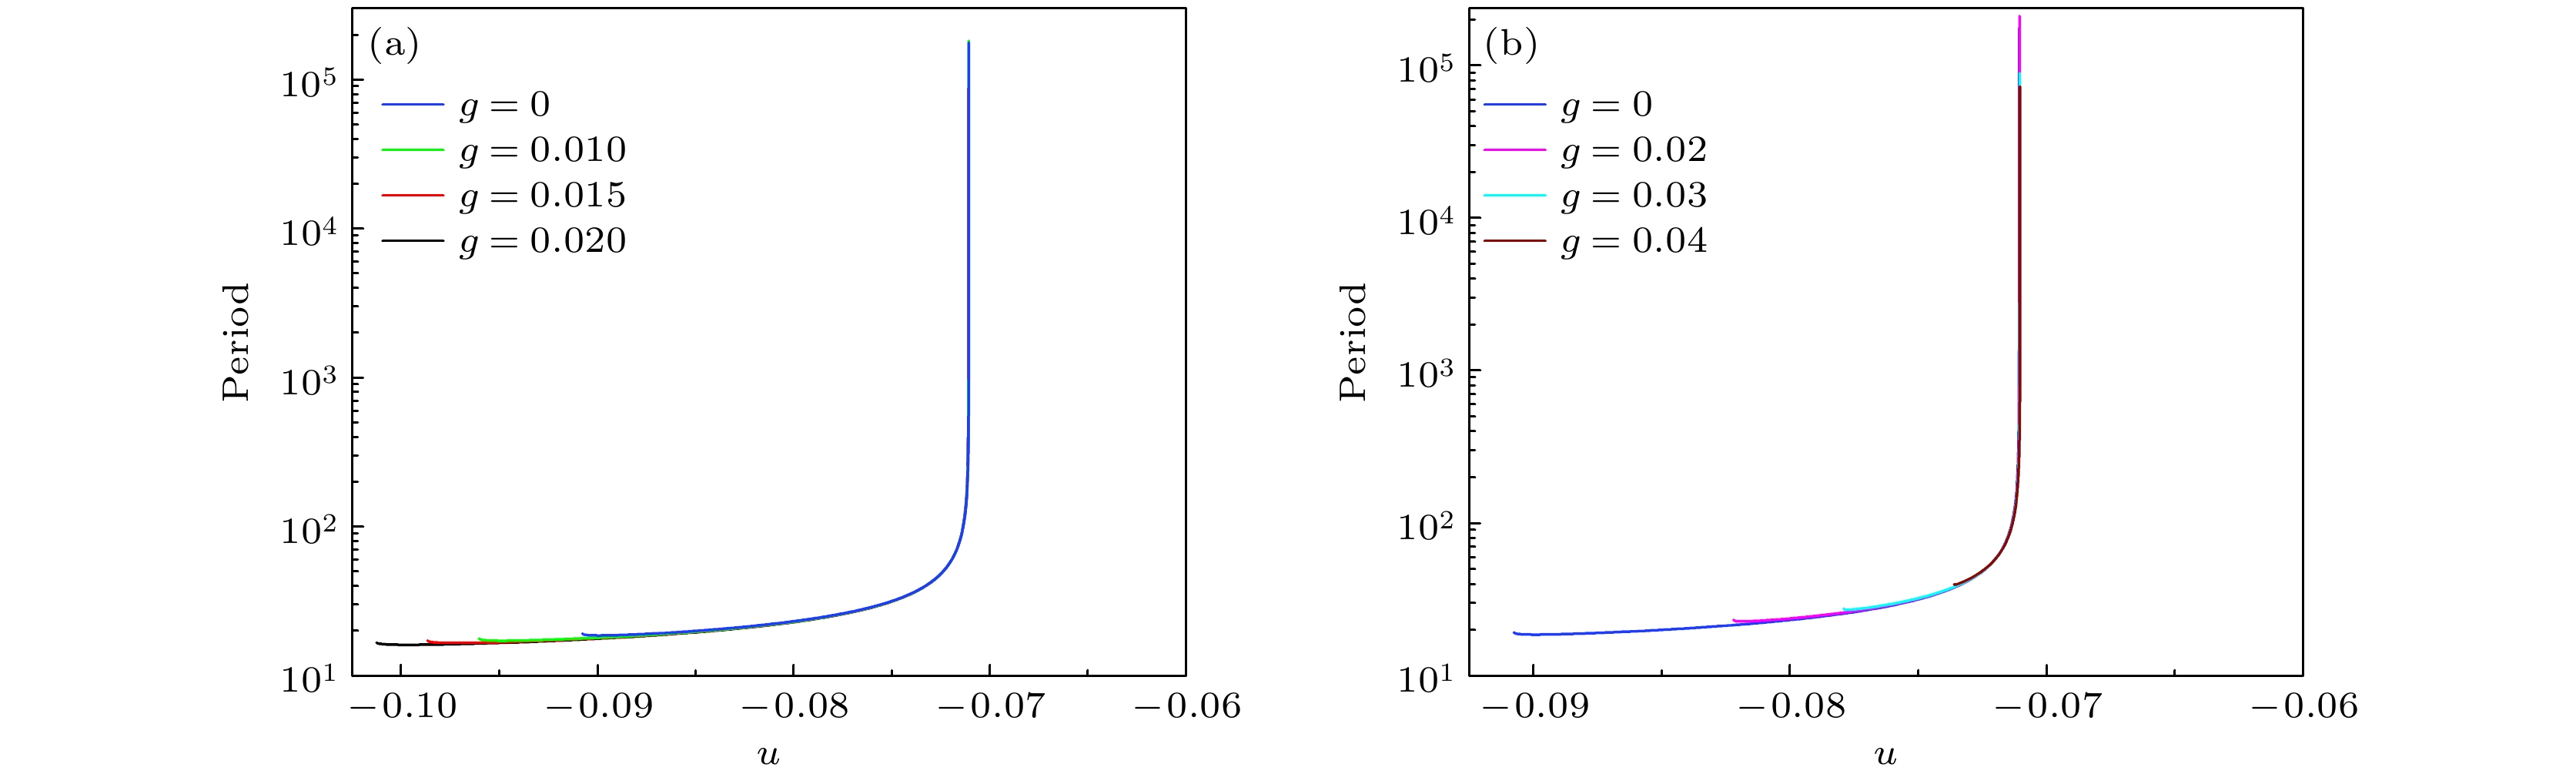 图 9 快子系统的极限环的周期随分岔参数u的变化 (a) 抑制性自突触, 蓝, 绿, 红和黑色曲线分别对应


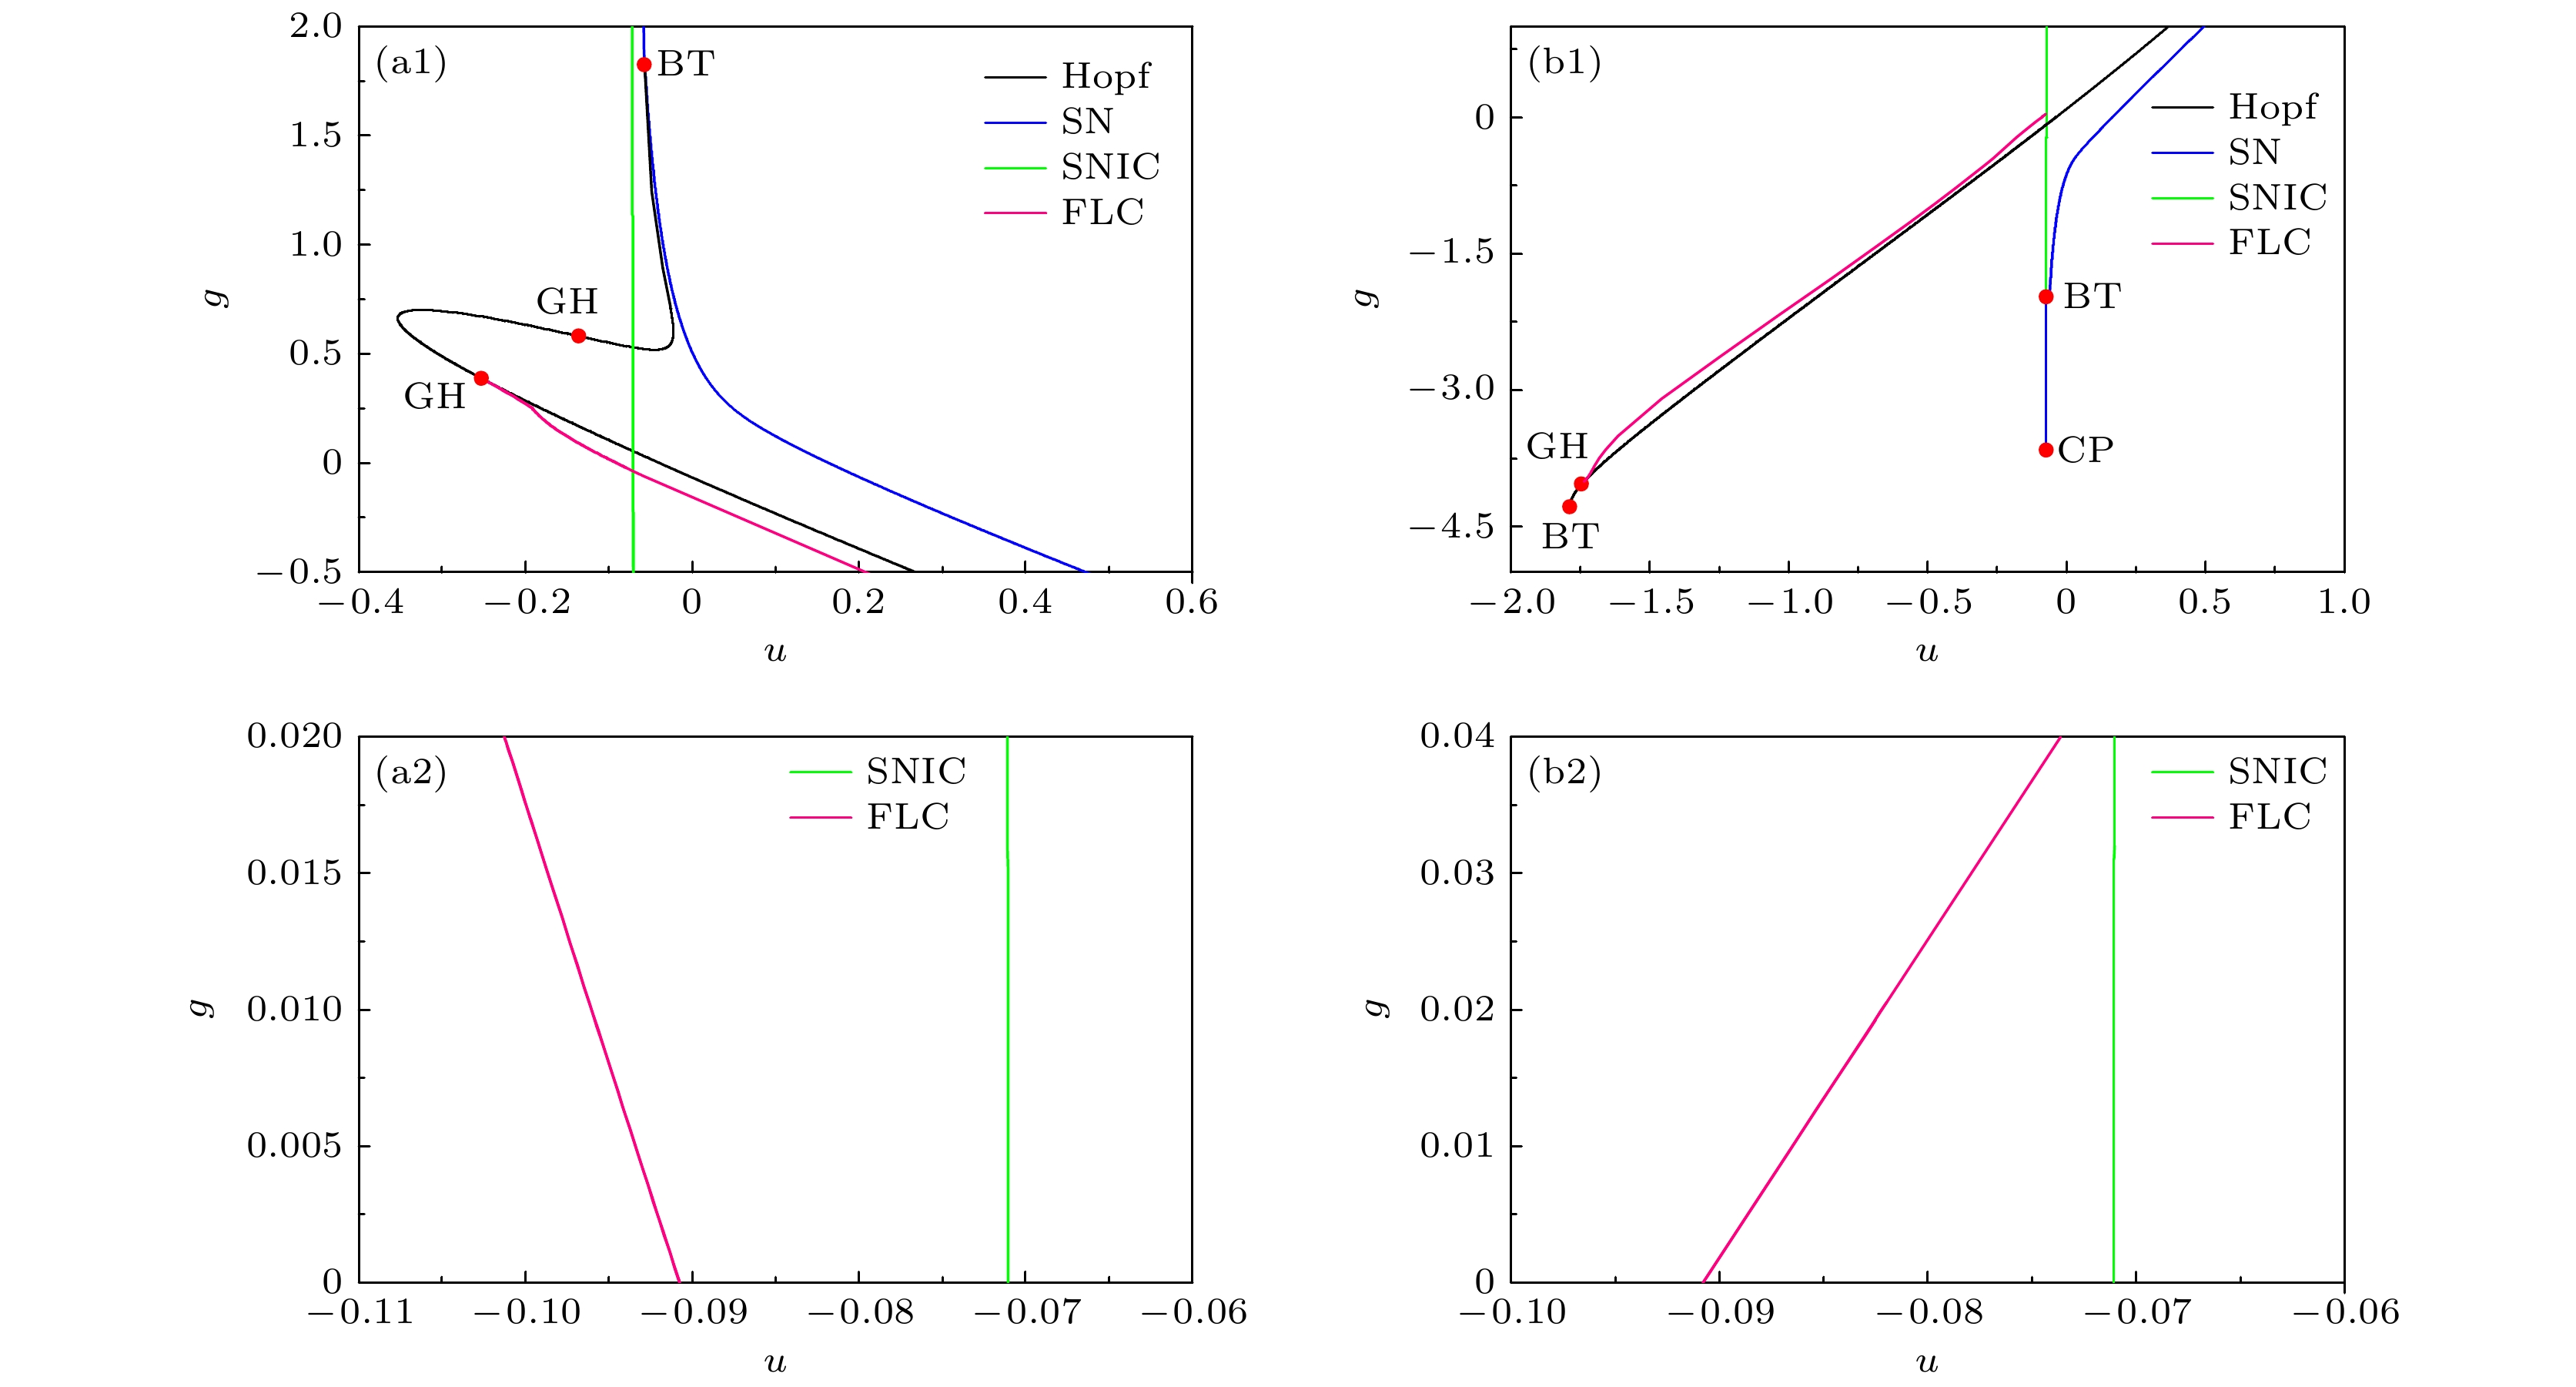 图 10 快子系统在

