全文HTML
--> --> -->通常, 可以通过两束对称等离子体的对穿来产生Weibel不稳定性[9,10]. 对穿方向的等离子体在不稳定性反馈机制下发生箍缩而形成丝状电流结构, 产生环绕着电流丝的管状磁场. 粒子模拟(particle-in-cell, PIC)结果表明, 这些管状磁场在平行于电流的方向上基本均匀分布, 而在垂直于电流方向上则具有随机分布的特征[11]. 可以在非磁化等离子体中产生磁场是Weibel不稳定性的一个重要特性, 但在Weibel不稳定性的发展过程中, 电流的箍缩作用同时也会使等离子体在垂直于电流方向上形成静电场[12].
实验上, 质子束照相技术是诊断电磁场的重要方法[13]. 该技术的基本原理是: 探针质子束在穿越电磁场区域时, 电磁场会引起质子束的偏转, 并最终对探测面上的质子通量密度分布造成调制. 利用探测面上的质子束通量密度分布并借助一定的反演方法, 可以定量或者定性地诊断被探测电磁场的分布信息. 得益于国内外高能质子源品质的不断优化, 质子束照相技术已经成为一种诊断Weibel不稳定性的常用方法[14]. 图1为常见的Weibel不稳定性质子照相示意图, 其中等离子体沿着z方向进行对穿, 探针质子束沿着x方向对其进行侧向照相.
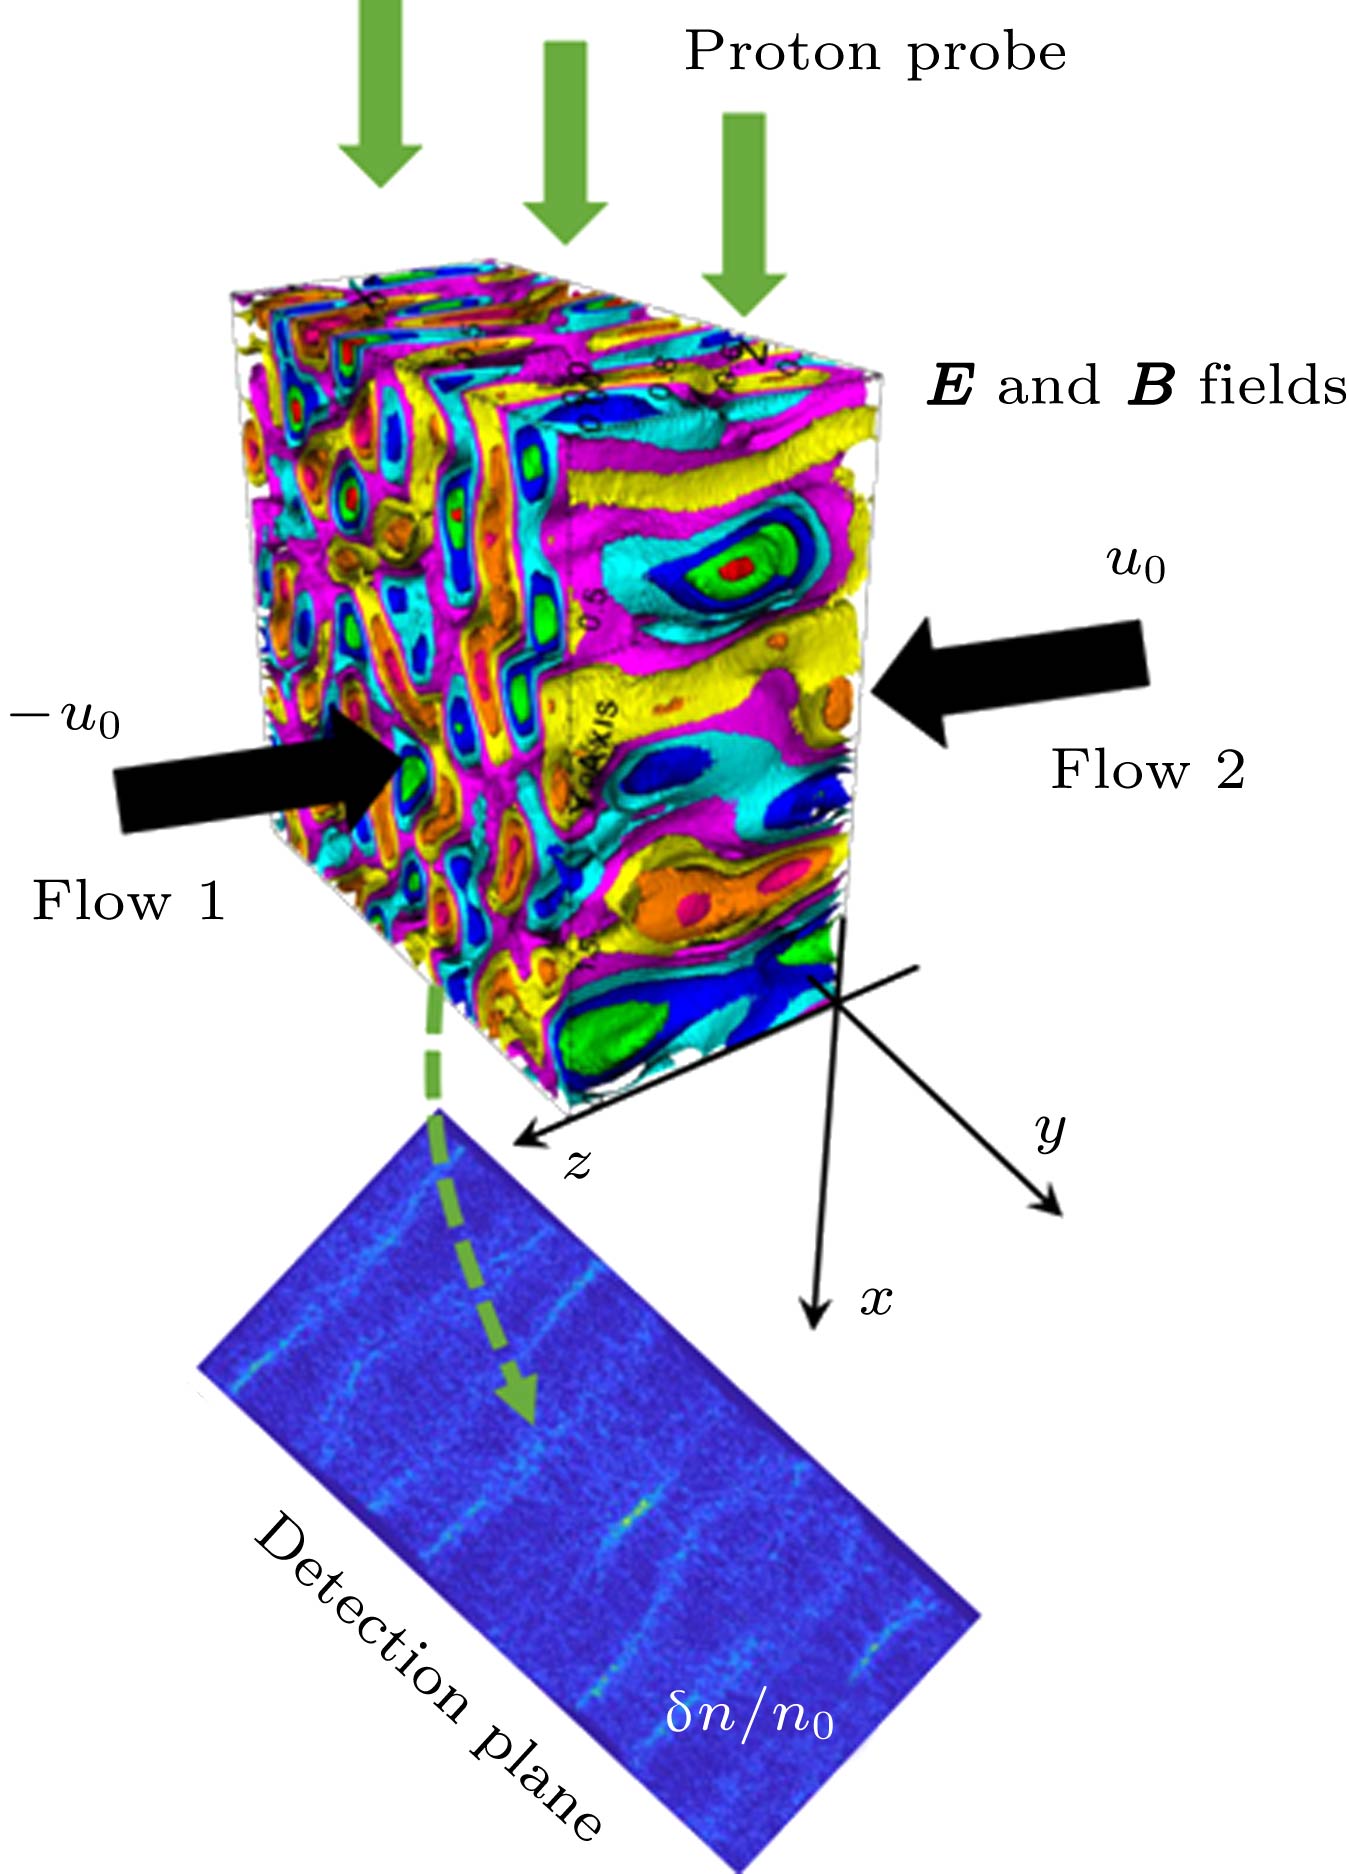 图 1 Weibel不稳定性的质子照相示意图
Figure1. Schematic diagram of the proton radiography of the Weibel instability
在对Weibel不稳定性进行质子束照相时, 横向电场和磁场均可对探针质子束造成偏转. 准确地判断被诊断电磁场的属性是进行深入物理分析的基本前提. 传统上, 在对Weibel不稳定性的质子照相结果进行定性和定量分析时, 一般情况下忽略来自电场的影响, 而认为引起探针质子束偏转的主要是磁场[7,10]. 但是, 该假设的正确性却一直没有得到针对性的定量检验.
Quinn等[7]、Fox等[9]以及Huntington等[10]关于Weibel不稳定性的质子束照相实验结果显示, 探测面上的通量密度大部分呈现出沿z方向平行的丝状调制结构. 这表明, 探针质子束受到的偏转作用主要在y方向. 但当探针质子束沿着x方向穿透Weibel不稳定性的发生区域时, 如果造成质子束偏转的作用力来自于横向磁场Bx + By, 那么磁场对质子束的偏转作用力将沿着z方向. 这与实验观察不符合. 而且, PIC模拟结果显示, 一些情况下横向静电场的能量只比磁场能量小约一个数量级[15], 即


为了检验Weibel不稳定性质子束照相中电场可被忽略这一假设的合理性, 本文首先使用三维PIC程序模拟了对称等离子体在对穿时电子Weibel不稳定性的自生电磁场. 其次, 利用径迹追踪法(ray tracing method)[17]计算了当只考虑Weibel不稳定性自生电场或磁场时的质子束照相过程, 对比分析了探测面上质子通量密度分布与同时存在自生电磁场时的差别. 与电场影响可被忽略的传统认识相反, 本文中模拟结果表明, 磁场对探针质子束的偏转作用远小于电场. 这主要是因为在探针质子束的穿越路径上, Weibel不稳定性自生环向磁场的偏转作用力总是被自身中和并抵消, 而自生电场却并没有这一限制.
本文使用三维PIC程序Ascent模拟了两束对称的氢等离子体在对穿过程中的自生电磁场[18]. 模拟中, 氢等离子体沿着z方向对穿, 电子和离子的漂移速度均为u0 = ± 0.5c. 等离子体的密度为1.1 × 10²³ m–3, 电子温度和离子温度均为5 keV. 等离子体的空间尺寸为Lx × Ly × Lz = 318 μm × 318 μm × 159 μm, 模拟网格大小为Δx = Δy = Δz = Lx/256, 每个网格中放置54个粒子, 时间步长为1.92 fs. 模拟使用了周期边界条件.
图2为模拟区域内y向自生磁场By和x向自生电场Ex在t = 1.06 ps时的三维空间分布情况. 从图2可以看出, 磁场和电场的主要特征是沿电流方向呈管状分布. 但电场具有更小的横向周期长度.
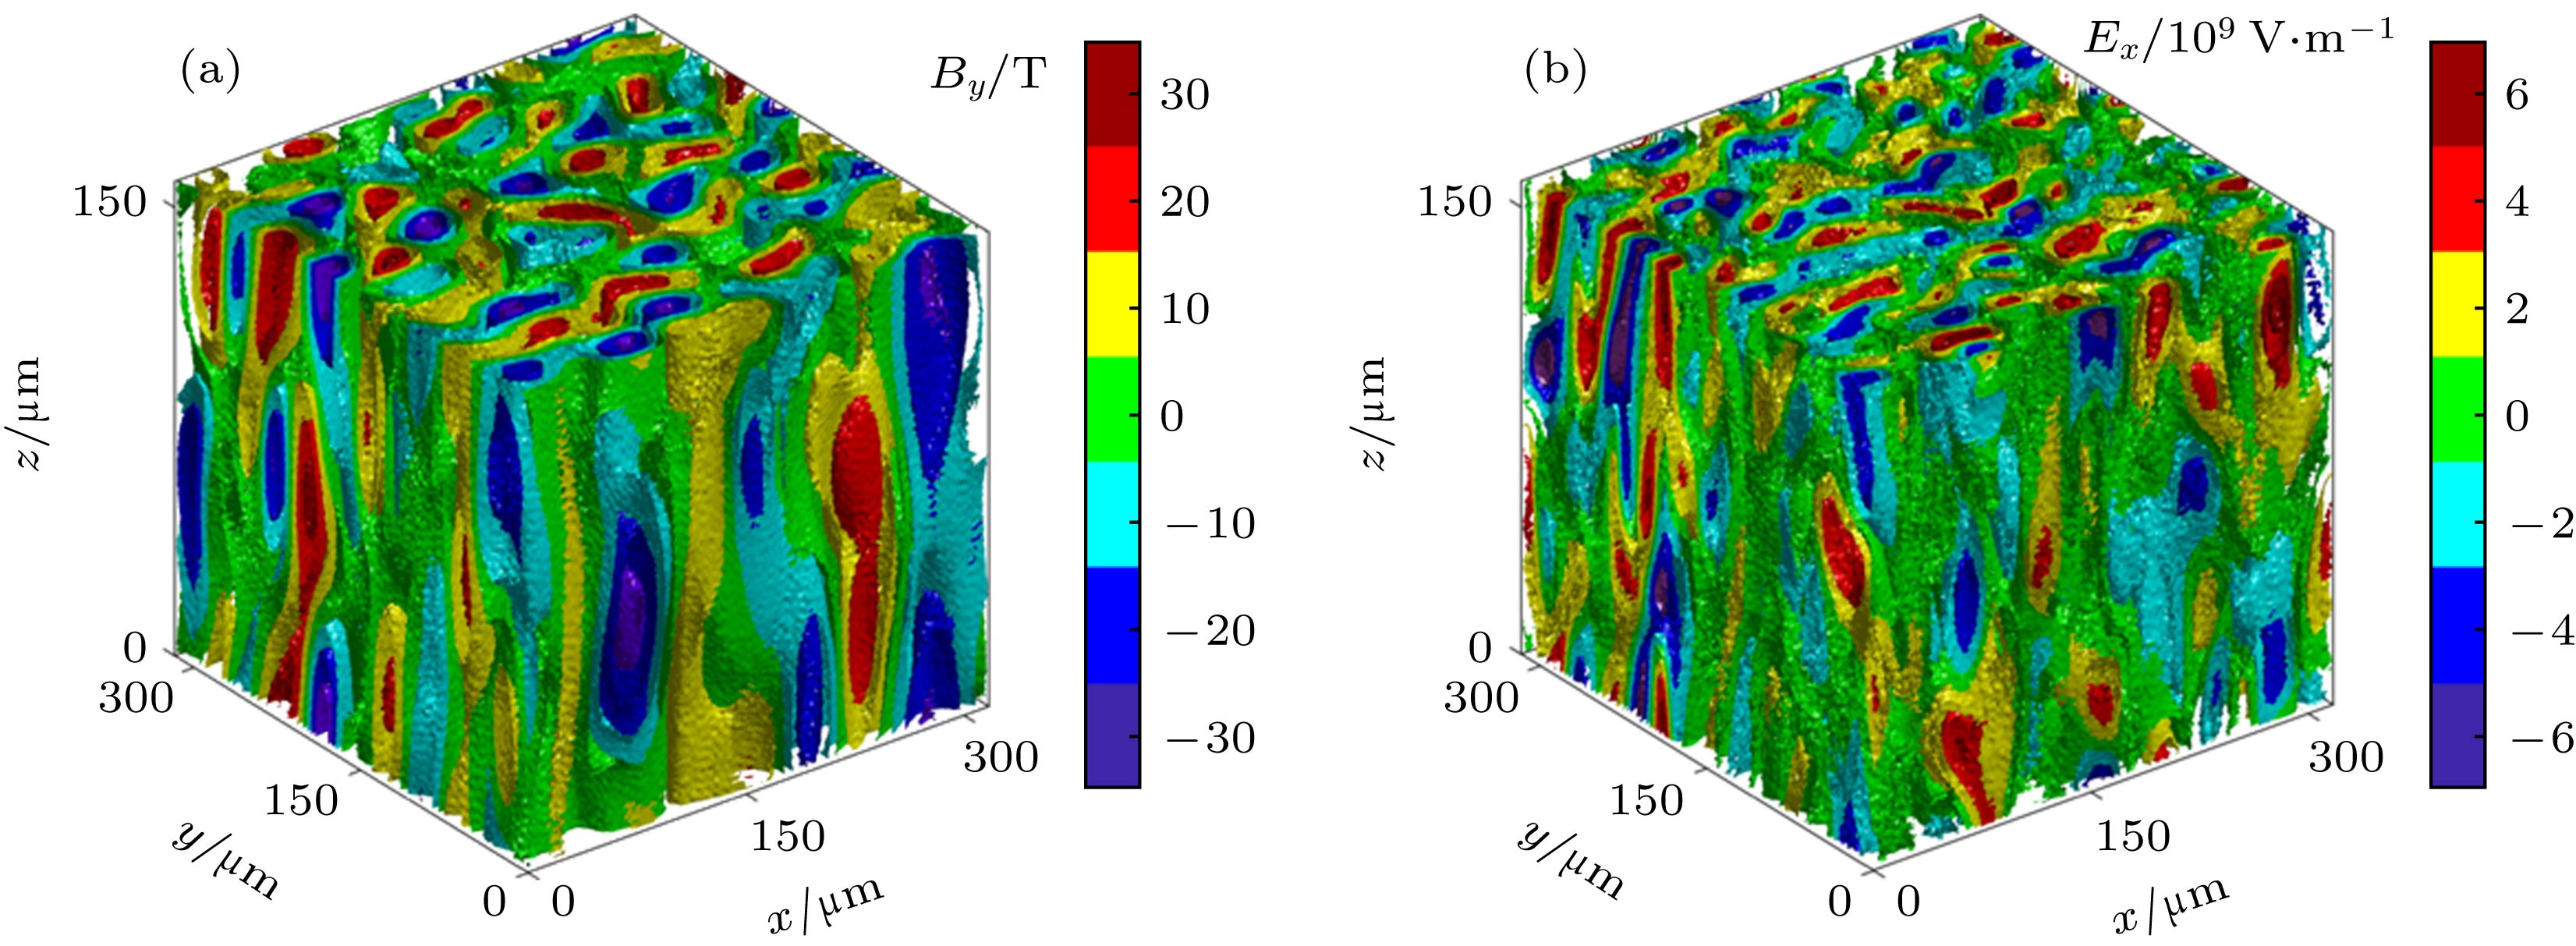 图 2 Weibel不稳定性 (a)自生磁场By和(b)自生电场Ex在t = 1.06 ps时的三维空间分布
Figure2. Three demensional distributions of the Weibel instability generated (a) magnetic field By and (b) electric field Ex at t = 1.06 ps
图3为模拟区域内自生磁场总能量εB和电场总能量εE随着时间的演化情况. 图中曲线显示出典型的电子Weibel不稳定性磁场和电场能量的变化规律[15]. 即在线性增长阶段, 因为电流的箍缩, 等离子体的部分动能被转化为磁场能量. 同时, 随着箍缩作用的加剧, 空间电荷效应引起的静电场能量也开始上升, 直至t = 1.22 ps时达到饱和. 此时, 电场能量与磁场能量相当, 这主要是因为当电子束温度较低而对穿速度较大时, 强烈的箍缩作用可产生明显的空间电荷分离[19]. 而在Weibel不稳定性达到饱和后的非线性发展阶段, 电场和磁场能量通过离子的静电响应和磁重联机制被缓慢地转移给等离子体并最终导致了等离子体的热化[5,11,20—22]. 此外, 电场能量和磁场能量具有明显的相关性, 这主要是因为当横向位移电流较小时, 径向电场和磁场压力达到平衡状态, 即

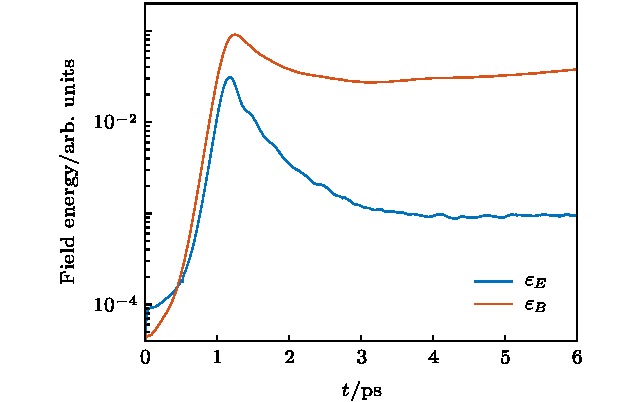 图 3 Weibel不稳定性自生磁场和电场能量随着时间的演化
Figure3. Evolution of the energy of the Weibel instability generated magnetic and electric fields.
图4为t = 1.06 ps时的磁场和电场在z = 0和y = 0平面上的空间分布情况. 根据图3显示, 此时磁场能量和电场能量接近线性增长的峰值时刻, Weibel不稳定性即将达到饱和, 而且磁场能量略大于电场能量. 其中, z = 0平面上的电场和磁场强度分布, 即图4(a)和图4(b), 均显示出随机分布的特征. 图4(c)和图4(d)中磁场和电场的矢量分布显示, 磁场的方向为环向, 电场方向为径向. 电磁场的这种指向符合Weibel不稳定性的典型图像, 即磁场围绕着z向丝状电流产生, 而电场则是由x-y平面内箍缩作用引起的电荷累积所导致[15]. y = 0平面上的电场和磁场结构, 即图4(e)和图4(f), 则显示出丝状特征. 这种二维各向同性随机的分布同样符合Weibel不稳定性的典型特征[15]. 此时, 磁场的峰值强度约51 T, 电场的峰值强度约为1.1 × 10¹⁰ V/m.
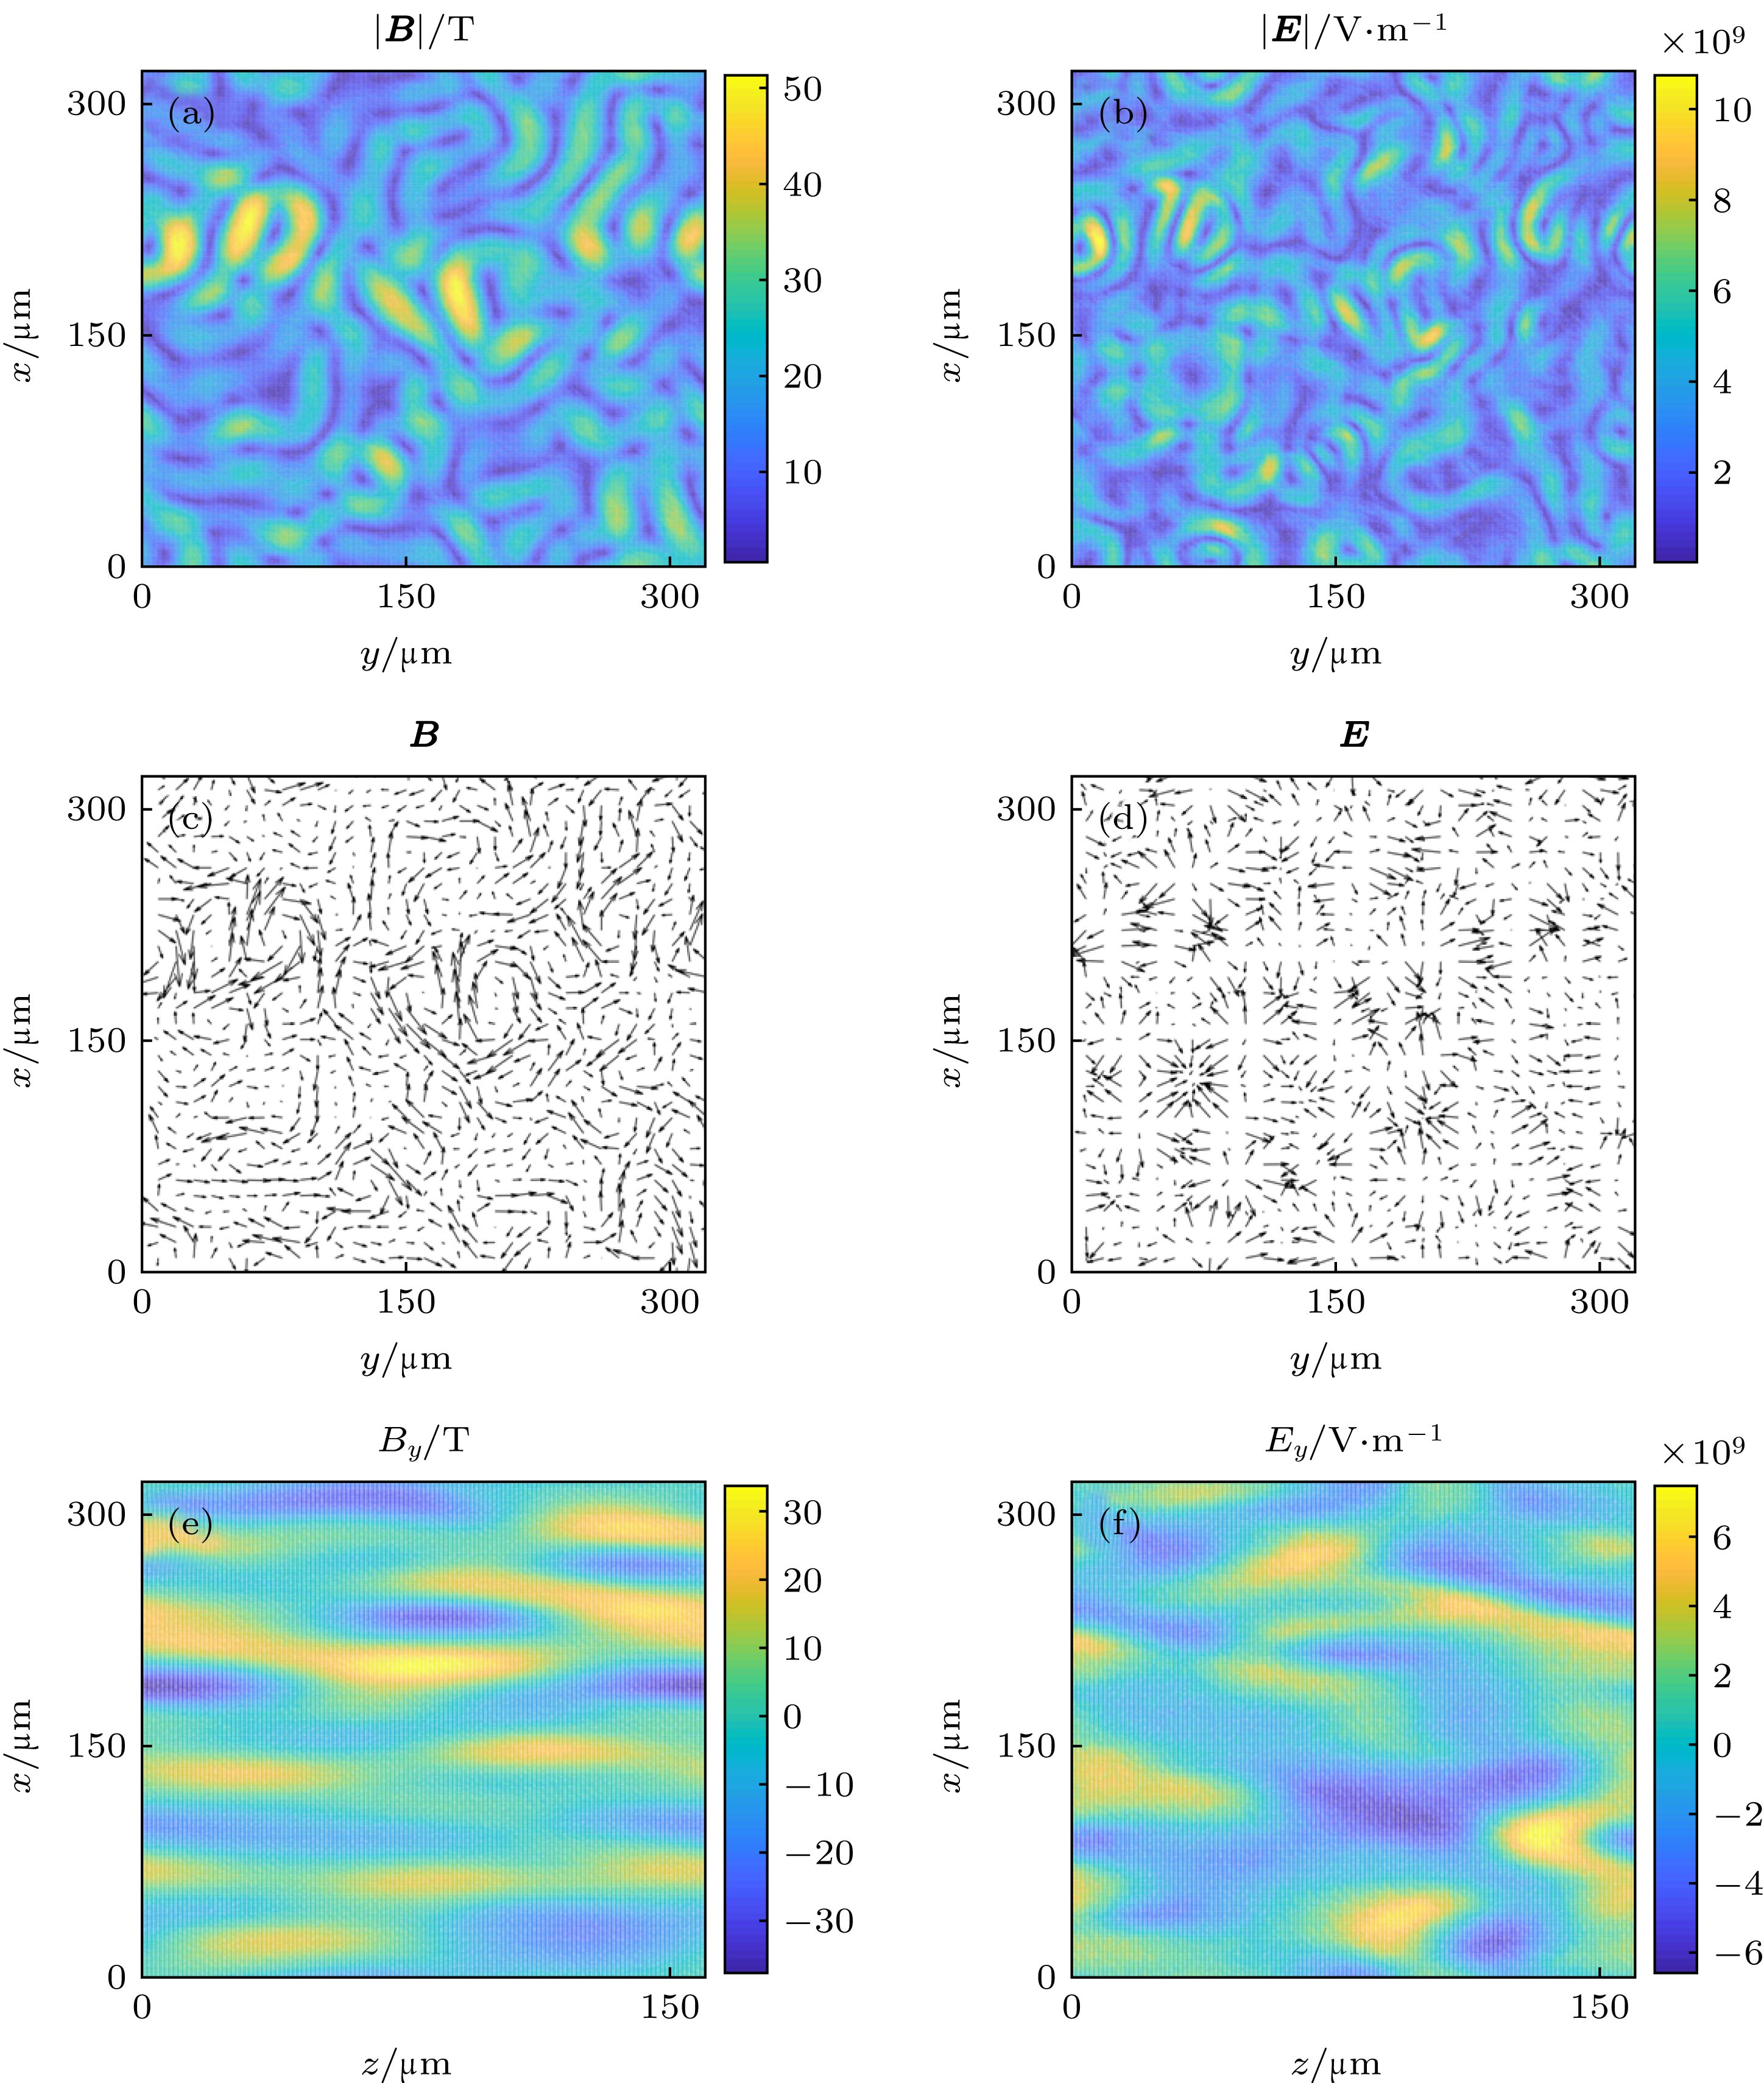 图 4 t = 1.06 ps时, z = 0平面上(a)磁场强度|B|、(b)电场强度|E|、(c)磁场方向和(d)电场方向的分布情况以及y = 0平面上(e) y向磁场By和(f) y向电场Ey的分布情况
Figure4. Spatial distributions of (a) the magnetic field strength |B|, (b) the electric field strength |E|, (c) the direction of B and (d) the direction of E on the z = 0 plane, (e) the y component of the magnetic field By and (f) the y component of the electric field Ey on the y = 0 plane at t = 1.06 ps.
图5为t = 4.78 ps时的磁场和电场分布情况. 根据图3显示, 此时Weibel不稳定性已进入饱和后的非线性演化阶段, 磁场和电场的能量均有所下降, 但电场能量因为下降得更快而只约为磁场能量的0.03倍. 与t = 1.06 ps时对比, 除了磁场方向仍然为环向, 电场方向仍然为径向外, t = 4.78 ps时的电场和磁场空间结构同样显示出二维各向同性随机分布的特征, 但在z方向更加均匀平滑. 此时, 磁场强度峰值约33 T, 电场的峰值强度约为2.8 × 10⁹ V/m. 另外, 横向空间周期明显变长, 说明发生了磁重联[22].
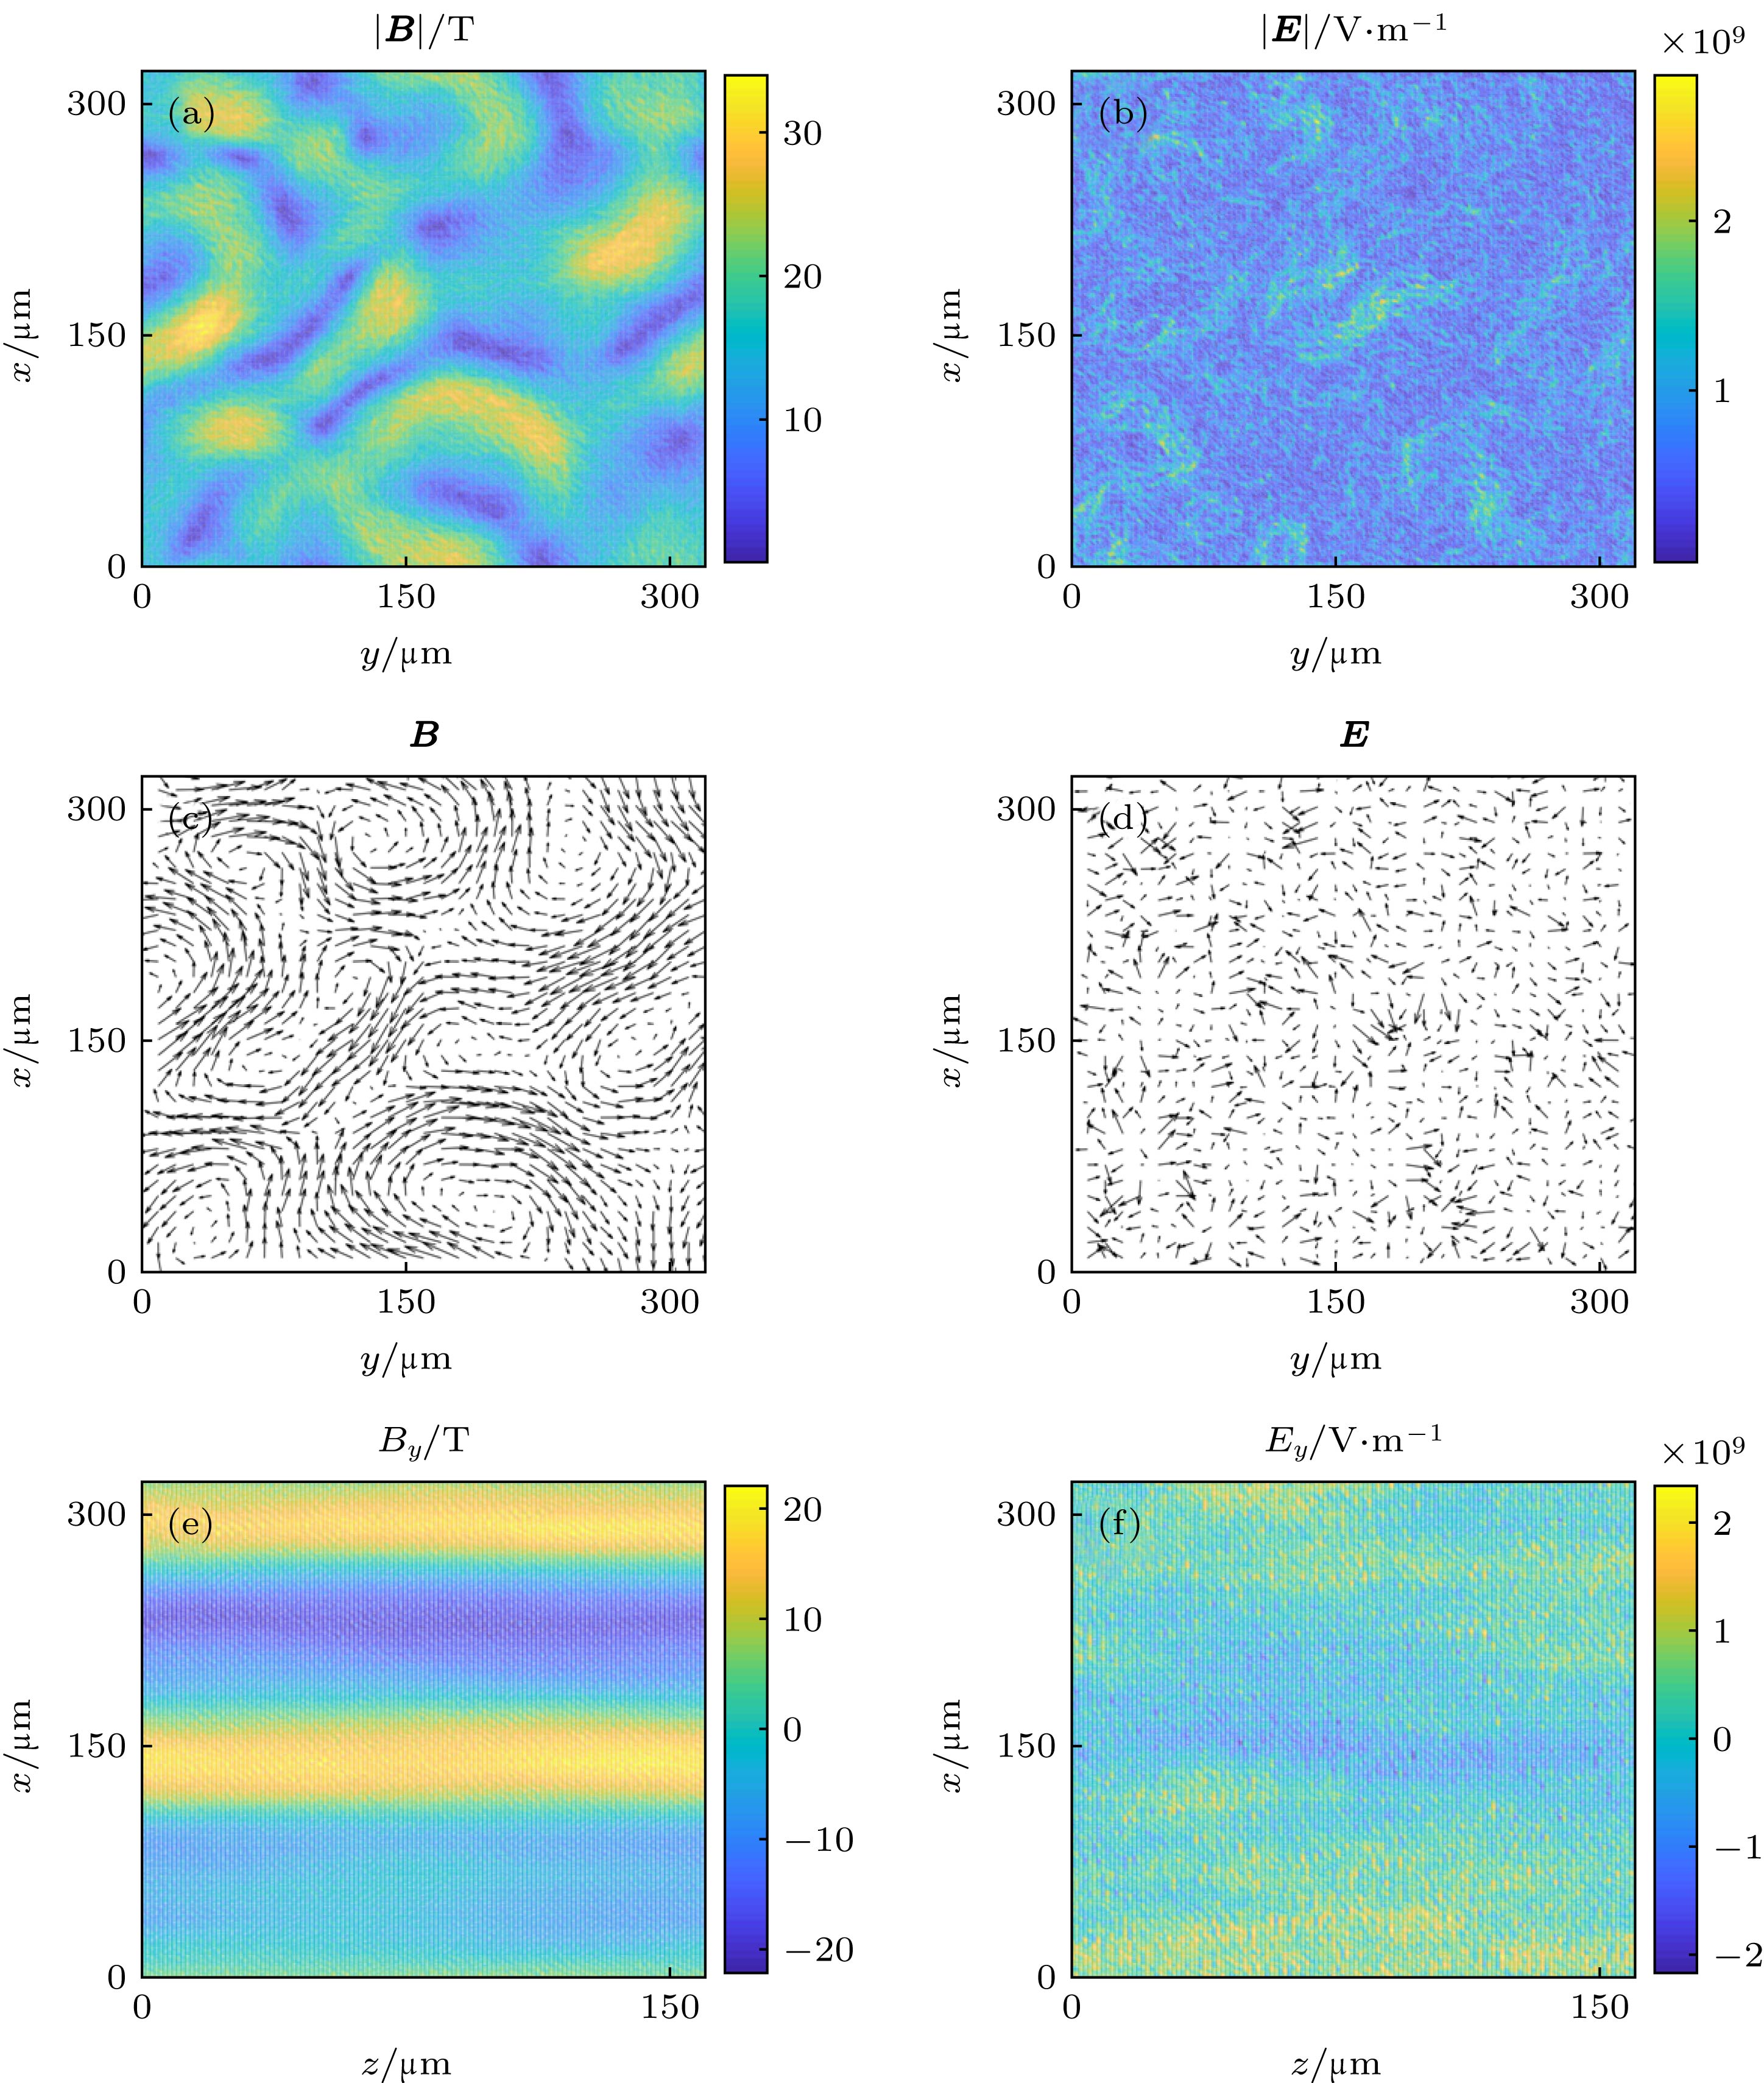 图 5 t = 4.78 ps时, z = 0平面上(a)磁场强度|B|、(b)电场强度|E|、(c)磁场方向和(d)电场方向的分布情况以及y = 0平面上(e) y向磁场By和(f) y向电场Ey的分布情况
Figure5. Spatial distributions of (a) the magnetic field strength |B|, (b) the electric field strength |E|, (c) the direction of B and (d) the direction of E on the z = 0 plane, (e) the y component of the magnetic field By and (f) the y component of the electric field Ey on the y = 0 plane at t = 4.78 ps.
根据以上三维PIC模拟结果, 我们发现在对穿等离子体的Weibel不稳定性演化过程中, 无论是饱和前的线性增长阶段还是饱和后的非线性发展阶段, 自生电场和磁场均具有二维各向同性随机分布的特征.
当t = 1.06 ps时, 三种情况下探测器上的质子束通量密度扰动的分布δn/n0如图6所示, 其中δn = n–n0, n为电场或者磁场不为零时的质子通量密度分布, n0为电场或者磁场为零时的质子通量密度分布. 此时, 探测器到场区域的距离LD = 0.5 mm. 从图6可见, 当只有电场时, 引起的密度扰动的最大值达到(δn/n0)max = 28.1, 但当只有磁场时, 引起的密度扰动的最大值(δn/n0)max只有约0.4, 远小于电场偏转引起的密度扰动. 而且, 无论有没有磁场, 探测面上的密度扰动信息几乎没有发生改变. 模拟还发现, 即使改变探测器距离LD为0.1 mm, 只考虑电场时的最大密度扰动(δn/n0)max = 1.2, 仍然远大于只考虑磁场时的(δn/n0)max = 0.2. 这说明, 在对线性演化阶段的Weibel不稳定性进行质子束照相时, 相比于电场而言, 磁场对探针质子束的偏转作用可以忽略不计. 此外, 因为线性发展阶段电磁场变化较快, 在实验上对此时的Weibel不稳定性进行质子照相时, 探针质子束穿越等离子体区域时感受到的其实是电场和磁场偏转作用的时间累加效果, 这种运动模糊效应将引起图6(a)—(c)中δn/n0空间分布的模糊化和(δn/n0)max的下降. 为了规避运动模糊效应带来的影响, 我们同样观察了t = 4.78 ps时的质子照相情况. 如图3所示, 此时Weibel不稳定性进入非线性区, 电场和磁场变化非常缓慢, 运动模糊效应可被忽略不计.
 图 6 t = 1.06 ps时, (a)只考虑电场E、(b)只考虑磁场B以及(c)同时考虑电场E和磁场B三种情况下探测面上的质子通量密度扰动分布信息
Figure6. Proton flux density perturbations on the detection plane when (a) only the electric field is included, (b) only the magnetic field is included and (c) both the electric and magnetic fields are included at t = 1.06 ps.
当t = 4.78 ps时, 三种情况下探测器上的质子束通量密度扰动的分布δn/n0如图7所示. 因为此时电磁场相比于t = 1.06 ps时均较弱, 所以为了清晰地观察此时电磁场引起的密度扰动, 已将探测器到场区域的距离增大到LD = 2 mm. 由图7可见, 与t = 1.06 ps时一样, 电场引起的质子束通量密度扰动最大值((δn/n0)max = 8.8)远大于磁场引起的质子束通量密度扰动最大值((δn/n0)max = 1.5), 而且磁场存在与否同样不会对探测面上的质子通量密度扰动产生明显影响. 这说明, 在对非线性阶段的Weibel不稳定性进行质子束照相时, 拍摄到的仍然只是电场的信息, 磁场的分布信息并不会被反映在探测器上.
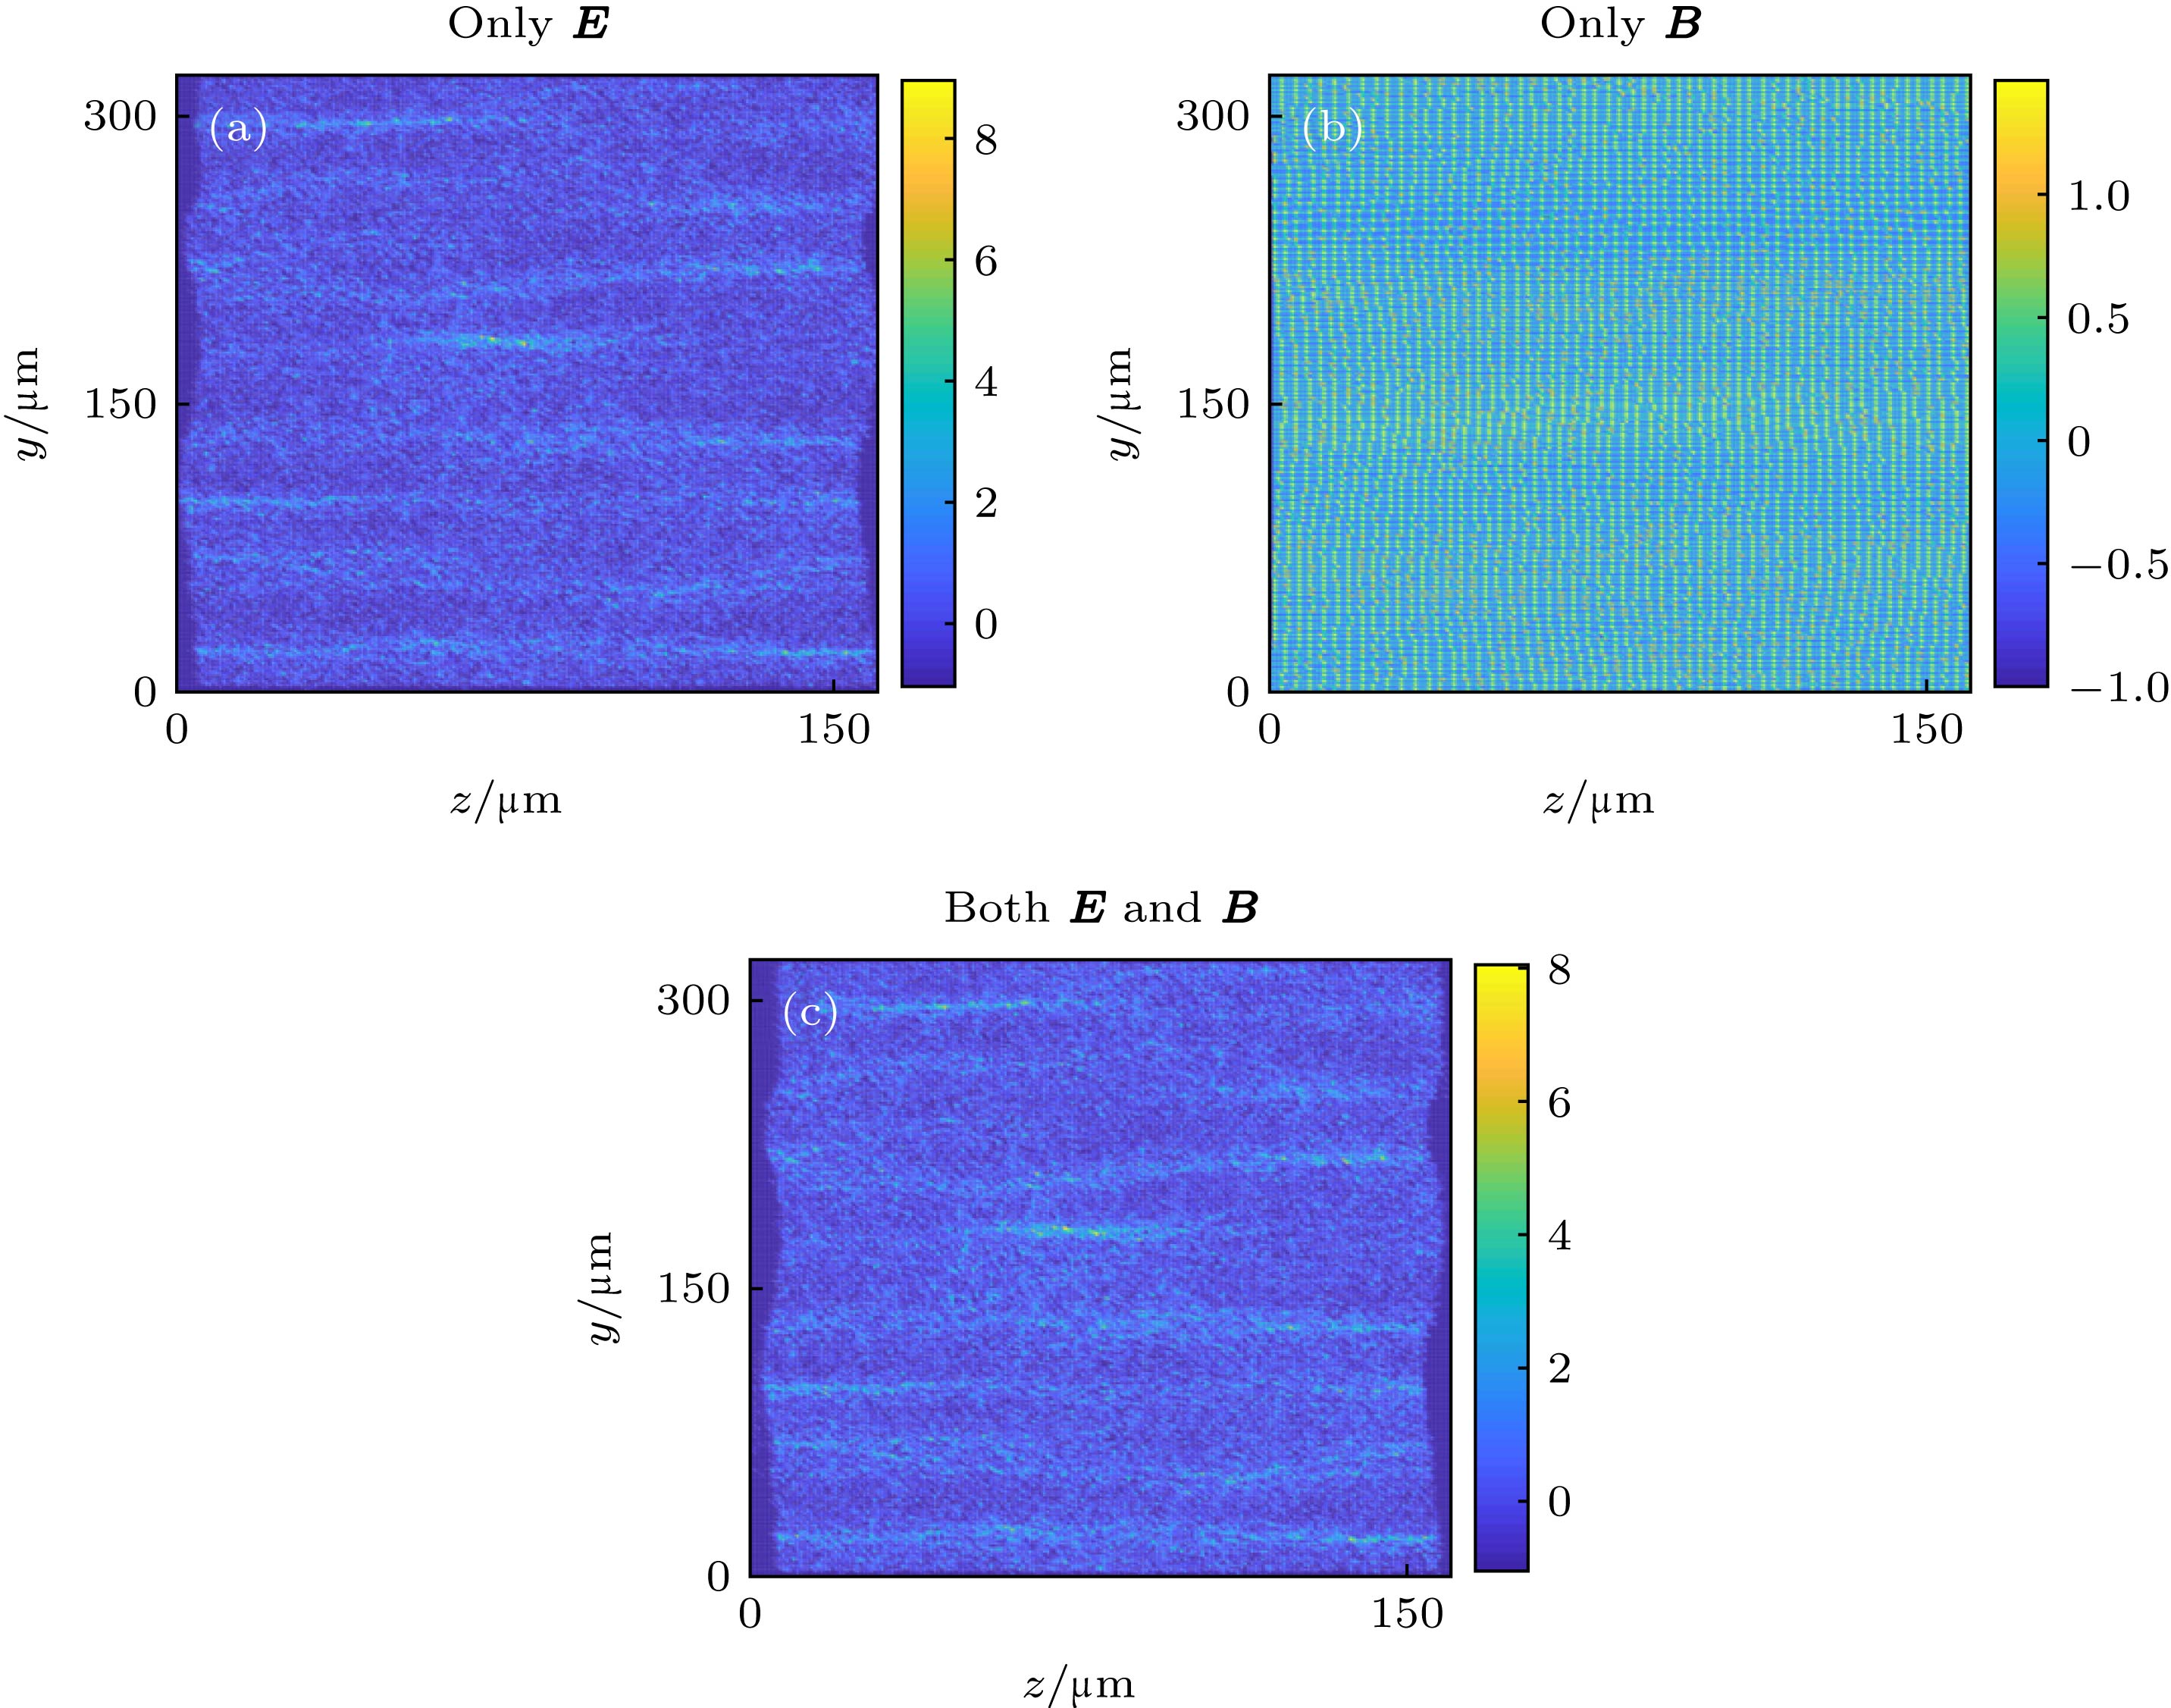 图 7 t = 4.78 ps时(a)只考虑电场E、(b)只考虑磁场B以及(c)同时考虑电场E和磁场B三种情况下探测面上的质子通量密度扰动分布信息
Figure7. Proton flux density perturbations on the detection plane when (a) only the electric field is included, (b) only the magnetic field is included and (c) both the electric and magnetic fields are included at t = 4.78 ps.
此外, 图6中质子通量密度条纹具有局部平行的特征, 这主要是由于电场自身在z方向的非均匀分布引起的. 而图7中的质子通量密度条纹显示出平行状特征. 这些特征均与Quinn等[7]、Fox等[9]以及Huntington等[10]的实验室观察是一致的.
总之, 无论在Weibel不稳定性饱和前的线性增长阶段还是饱和后的非线性演化阶段, 对其进行质子束照相时, 拍摄到的都只是自生电场的分布信息, 自生磁场的影响可以忽略不计. 这种结果与传统上电场偏转作用可被忽略的认识是刚好相反.


另外, 在t = 4.78 ps时, 电场的能量只约为磁场能量的0.03倍, 其对探针质子束的静电作用力远小于磁场的洛伦兹力, 但仍然在探针质子束离开场区域时产生了远强于磁场的偏转效果. 这可佐证上述解释的唯一性.
