1.Complex Systems Research Center, Shanxi University, Taiyuan 030006, China 2.Shanxi Key Laboratory of Mathematical Techniques and Big Data Analysis on Disease Control and Prevention, Shanxi University, Taiyuan 030006, China
Fund Project:Project supported by the National Natural Science Foundation of China (Grant Nos. 61873154, 11601294) and the Natural Science Foundation of Shanxi Province, China (Grant Nos. 201801D121008, 201801D121206).
Received Date:10 February 2019
Accepted Date:05 May 2019
Available Online:01 August 2019
Published Online:05 August 2019
Abstract:In the process of rumor propagation, people who know the truth or judge the truth can spread true information about rumors. Therefore, on the rumor propagation, it is significant to introduce the spreaders who spread true information in the rumor propagation. But the previous studies did not take into consideration the influence of true information spreading on the rumor propagation. In this paper, the susceptible-infective-true-removed (SITR) rumor propagation model with the true information spreader and the forgetting factor of rumors is established. The threshold K0 is obtained by using the method of the next generation matrix. If K0 < 1, the balance between no rumor and no true information spreader is locally asymptotically stable. The existence and stability of two boundary balance (that is, there are rumor spreaders but no true information spreaders, and there are no rumor spreaders but true information spreaders) are proved. The bistable region of two-boundary balance is given. Further, under different conditions we obtain the existence and locally asymptotical stability of positive balance (rumor spreaders and true information spreaders coexist). Finally, the theoretical results are verified by numerical simulations. We find that the initial value of the true information spreaders affects the peak value of the rumor spreaders and the duration of the rumor. The bigger the initial value of the true information spreaders, the smaller the peak value of the rumor spreaders is and the shorter the duration of the rumor is. The initial value of the rumor spreaders affects the peak value of the rumor spreaders, and the time when the rumor spreaders reach the peak value. The larger the initial value of the rumor spreaders, the larger the peak value of the rumor spreaders is and the earlier the peak value appears. But the initial value of the rumor spreaders does not affect the duration of the rumor. Therefore, in the process of rumor propagation, according to mathematical analysis of the rumor propagation model, we find that the rumor spread is a very complicated process. The results of mathematical analysis can provide theoretical basis to control the rumor propagation and reduce the negative effects of rumors. Keywords:rumor propagation/ true information/ threshold/ equilibrium
图 6$\alpha_1 = 0.7,\;\beta = 0.9,\; A = 0.2,\;\mu =0.2,\;\theta = 0.01,\;\epsilon = 0.01,\;\delta = 0.22$时, (a) S, I,T的时间序列图和(b) I-T相平面图 Figure6. When $\alpha_1 = 0.7,\;\beta = 0.9,\; A = 0.2,\;\mu =0.2,\;\theta = 0.01,\;\epsilon = 0.01,\;\delta = 0.22$, (a) time series graph of S, I, and T; (b) phase plan of I-T.
从图5可以看出, 随着谣言的传播, 谣言传播者的数量会达到一个峰值, 之后不断下降, 真实信息传播者数量随着时间逐渐增大, 最后达到稳定状态. 即系统(2)达到没有谣言传播者, 只有真实信息传播者和易感者的稳定状态. 从图6可以看出, 随着谣言的传播, 谣言传播者的数量逐渐增加, 真实信息传播者数量会逐渐减少变为零, 最后达到稳定状态. 即系统(2)达到没有真实信息传播者, 只有谣言传播者和易感者的稳定状态. 参数取值为$\alpha = 0.4,\; \beta = 0.7,\; A = 0.2,\; \mu = 0.2,$$ \epsilon = 0.01,\; \theta = 0.01,\; \delta = 0.234$, 且满足$\dfrac{1}{n}K_{1} < K_{2} < $$\dfrac{K_{1}(K_{1}\mu+\theta)}{\mu+\theta}$, 当$T(0)$值不相同时, 系统(2)的解会趋于不同的边界平衡点(见图7). 图 7 当$T(0)$不相同时, 系统(2)的解趋于不同的边界平衡点 (a) I的时间序列图; (b) 时间增加后I 的时间序列图 Figure7. When $T(0)$ is different, the solution of system (2) tends to the different boundary equilibrium: (a) Time series graph of I; (b) time series graph of I after time increment.
参数取值为$\alpha_1 = 0.7$, $\beta = 0.9$, $\delta = 0.3$, $A = $0.2, $\mu = 0.2$, $\theta = 0.01$, 则$K_2 = 3 > \dfrac{K_1(\mu K_1+\theta)}{\mu+\theta} = $ 2.21429. 当取$\epsilon = 0.01$时, $\epsilon = 0.01 < (1-\alpha_1)\beta =$0.27, $E_1{^*}$是渐近稳定的(见图8). 当取$\epsilon = 0.3$时, $\epsilon = 0.3 > (1-\alpha_1)\beta = 0.27$, $E_2{^*}$是渐近稳定的(见图9). 图 8$\alpha_1 = 0.7,\;\beta = 0.9,\; A = 0.2,\;\mu =0.2,\;\theta = 0.01,\;\epsilon = 0.01,\;\delta = 0.3 $时, (a) S, I, T的时间序列图和(b) I-T相平面图 Figure8. When $\alpha_1 = 0.7,\;\beta = 0.9,\; A = 0.2,\;\mu =0.2,\;\theta = 0.01,\;\epsilon = 0.01,\;\delta = 0.3 $, (a) time series graph of S, I, and T; (b) phase plan of I-T.
图 9$\alpha_1 = 0.7,\;\beta = 0.9,\; A = 0.2,\;\mu =0.2,\;\theta = 0.01,\;\epsilon = 0.3,\;\delta = 0.3 $时, (a) S, I, T的时间序列图和(b) I-T相平面图 Figure9. When $\alpha_1 = 0.7,\;\beta = 0.9,\; A = 0.2,\;\mu =0.2,\;\theta = 0.01,\;\epsilon = 0.3,\;\delta = 0.3 $, (a) time series graph of S, I, and T; (b) phase plan of I-T.
取$\alpha_1 \!= 0.5$, $\beta = 0.6$, $\delta \!= 0.24$, $A \!= 0.2$, $\mu \!= 0.2,$$\theta = 0.01$, 则$K_2 = \dfrac{K_1(\mu K_1+\theta)}{\mu+\theta} = 1.42857$, 当取$\epsilon = 0.01 < (1-2\alpha_1)\beta+ {\delta\theta}/{\mu} = 0.012$, $E_4^*$是渐近稳定的(见图10). 图 10$ \alpha_1 = 0.5,\;\beta = 0.6,\; A = 0.2,\;\mu =0.2,\;\theta = 0.01,\;\epsilon = 0.01,\;\delta = 0.24 $时, (a) S, I, T的时间序列图和(b) I-T相平面图 Figure10. When $\alpha_1 = 0.5,\;\beta = 0.6,\; A = 0.2,\;\mu =0.2,\;\theta = 0.01,\;\epsilon = 0.01,\;\delta = 0.24 $, (a) time series graph of S, I, and T; (b) phase plan of I-T.
从图8—图10可看出, 随着谣言的传播, 易感者数量先减小后增大, 谣言传播者的数量会先增大后减小, 真实信息传播者数量逐渐增大, 最后达到稳定状态. 即系统(2)达到同时存在易感者、言传播者和真实信息传播者的稳定状态. 从图11(a)可以看出, 真实信息传播者的初始值影响着谣言传播者的峰值以及谣言传播的时间, 真实信息传播者的初始值越大谣言传播者的峰值越小, 峰值到达的时间越早, 谣言灭绝得越快. 从图11(b)可以看出, 谣言传播者的初始值影响着谣言传播者的峰值以及谣言传播者峰值到达的时间, 谣言传播者的初始值越大谣言传播者的峰值越大, 峰值到达的时间越早, 但不影响谣言持续的时间. 图 11 (a)不同真实信息传播者的初始值对谣言传播的影响; (b)不同谣言传播者的初始值对谣言传播的影响; 参数取值 $\alpha_1=0.7$, $\beta=0.9$, $\delta=0.36$, $A=0.2$, $\mu=0.2$, $\theta=0.01$, $\epsilon=0.01$ Figure11. (a) Influence of different initial values of true information spreaders; (b) influence of different initial values of rumor spreaders on the rumor propagation. The parameter values are $\alpha_1=0.7$, $\beta=0.9$, $\delta=0.36$, $A=0.2$, $\mu=0.2$, $\theta=0.01$, $\epsilon=0.01$.
从图11(a)得到谣言传播者峰值$I_{\rm {max}}$的散点图(见图12(a)), 通过MATLAB拟合得到函数表达式: $I_{\rm {max}} \!=\! x_1{\rm e}^{x_2T(0)}\!+\!y_1{\rm e}^{y_2T(0)}$, 其中, $x_1 \!=\! 0.2881,$$x_2 = -20.11,$$y_1 = 0.1296,$$y_2 = -6.828$ (结果见图12(b)), 故T(0)与$I_{\rm {max}}$之间的函数关系为$ I_{\rm {max}} =$$ 0.2881{\rm e}^{-20.11T(0)}+0.1296{\rm e}^{-6.828T(0)}$, 可以看出谣言传播者峰值$I_{\rm {max}}$随着T(0)的增加按上述函数关系衰减. 图 12 (a) T(0)与谣言传播者峰值$I_{\rm {max}}$的散点图; (b) 根据数据点拟合得到的曲线图 Figure12. (a) Scatter plot of T(0) and the peak value $I_{\rm {max}}$ of rumor spreaders; (b) the curve graph of fitting data points.


 图 1 真实信息影响下谣言传播流程图


 图 2
图 2 


 图 3
图 3 


 图 4
图 4 


 图 5
图 5 

 图 6
图 6 


 图 7 当
图 7 当


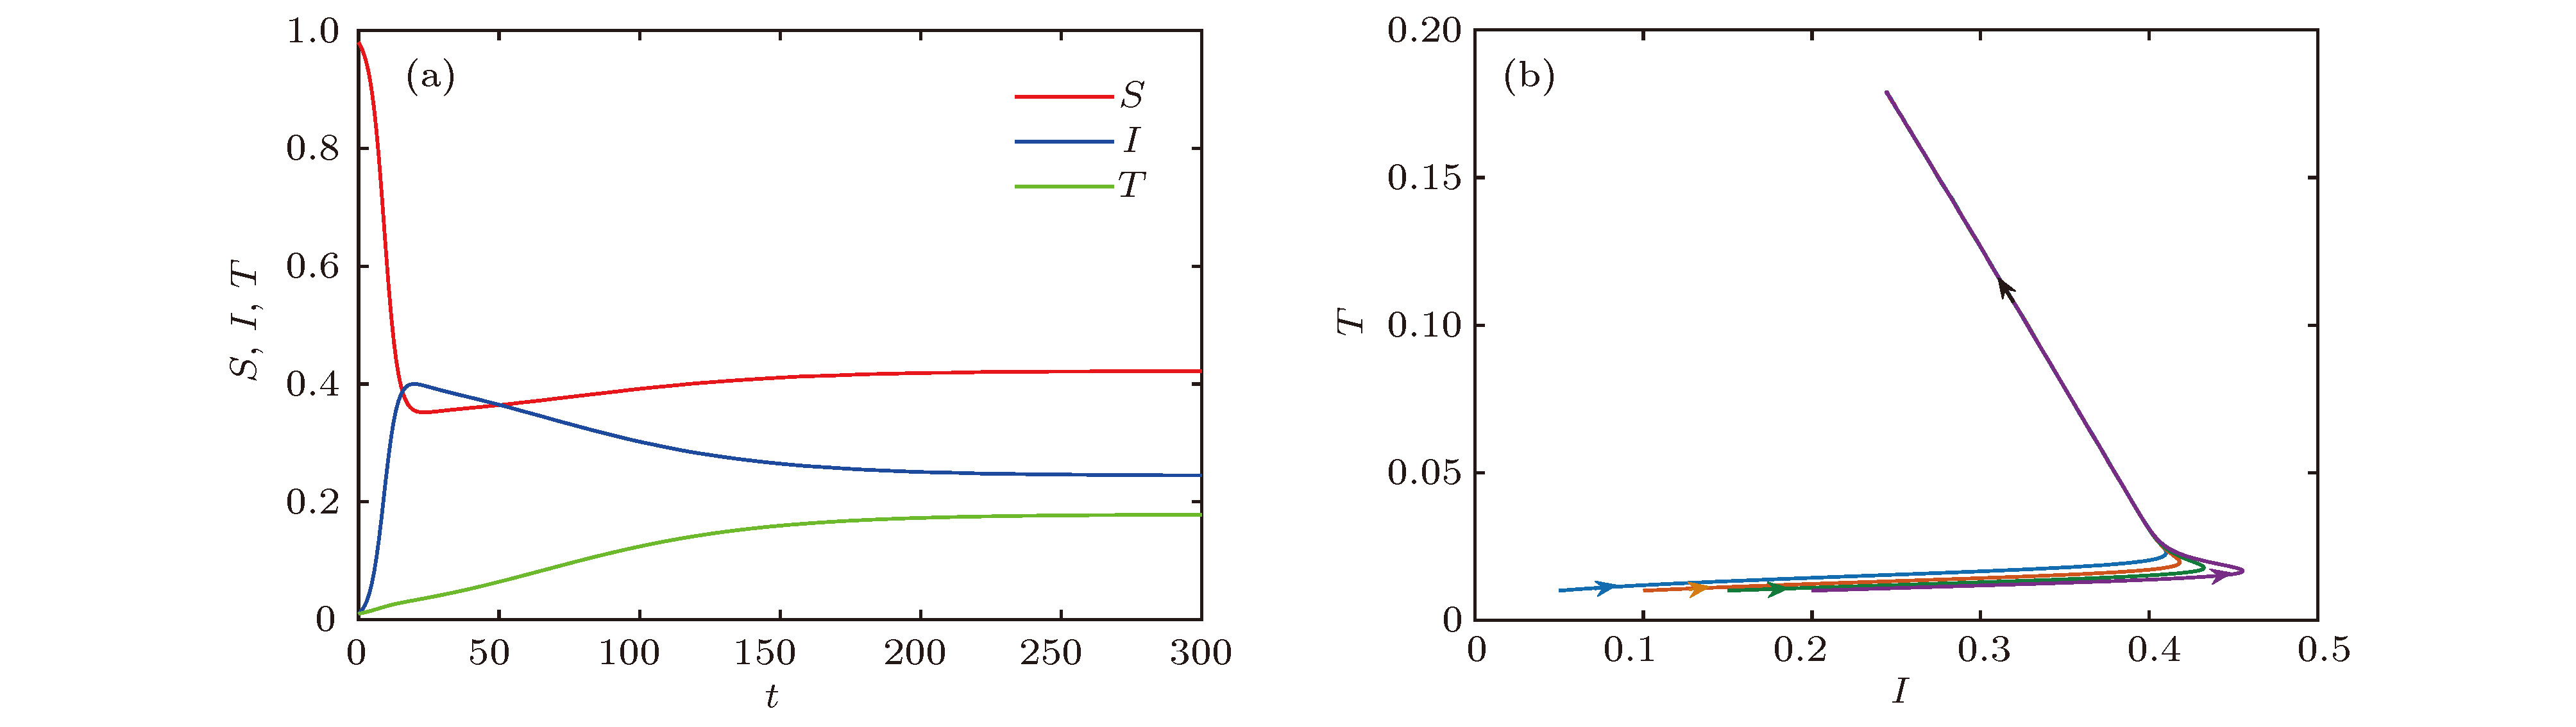 图 8
图 8 

 图 9
图 9 


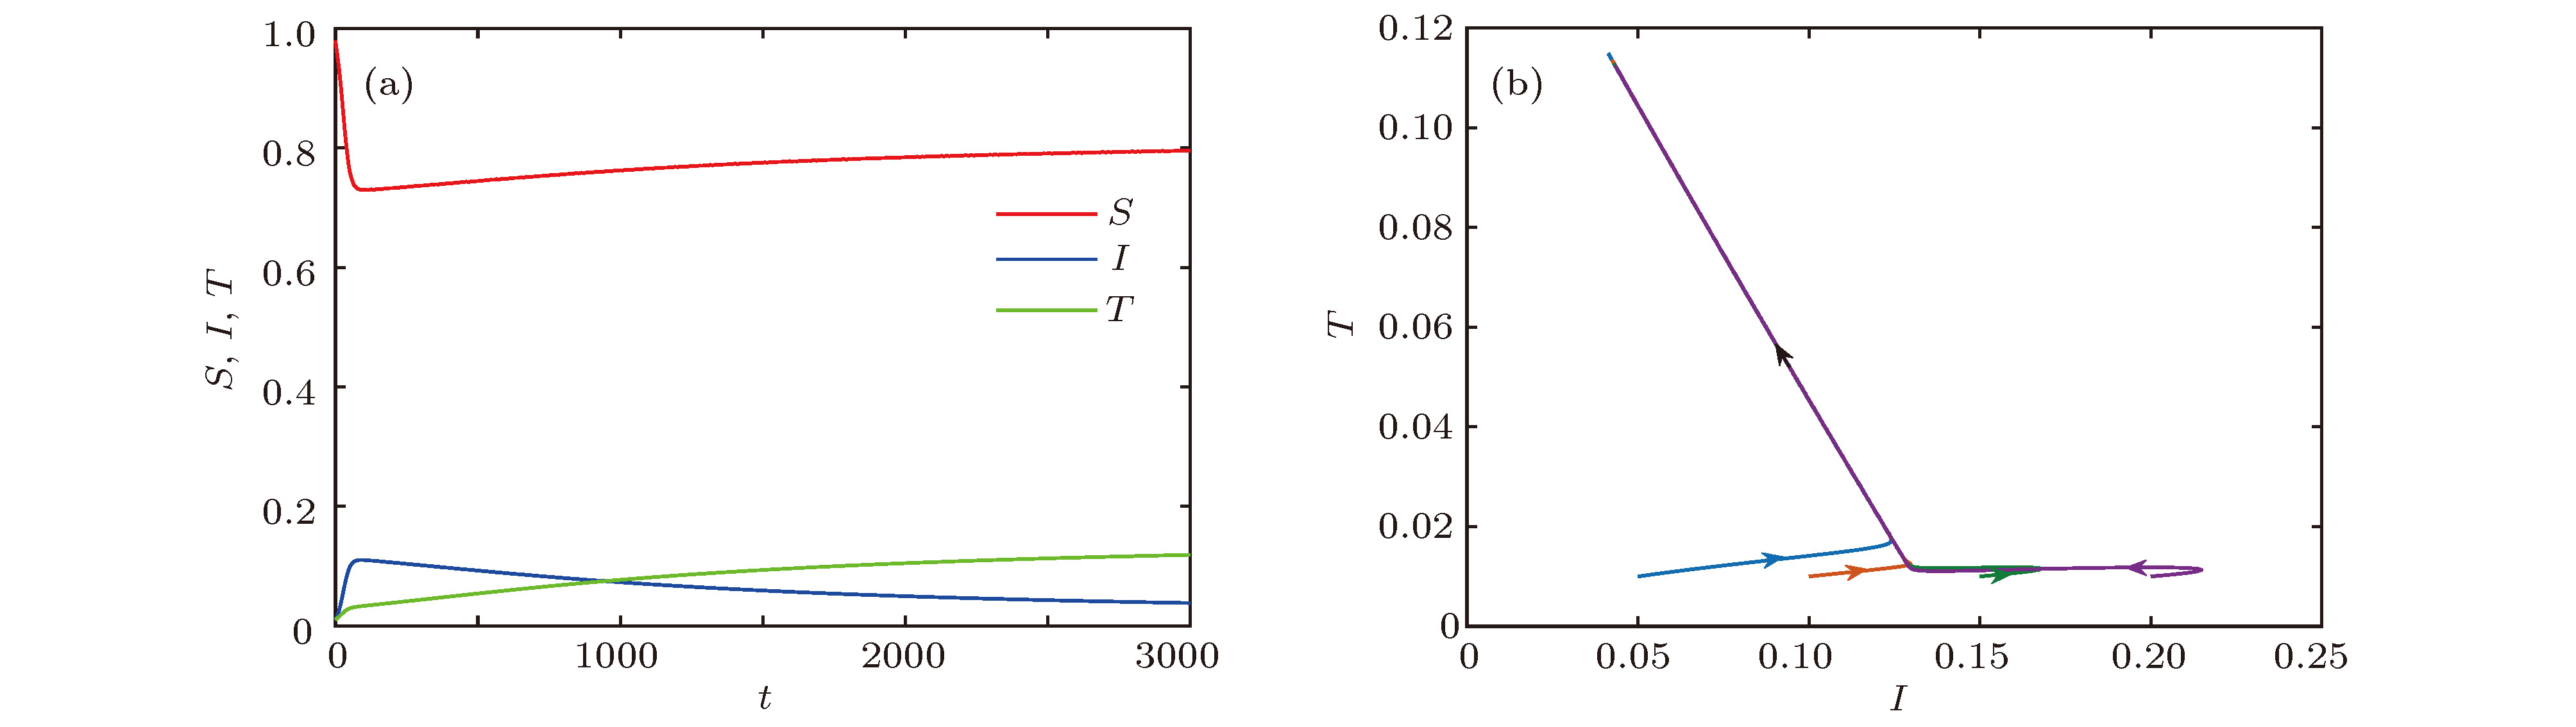 图 10
图 10 

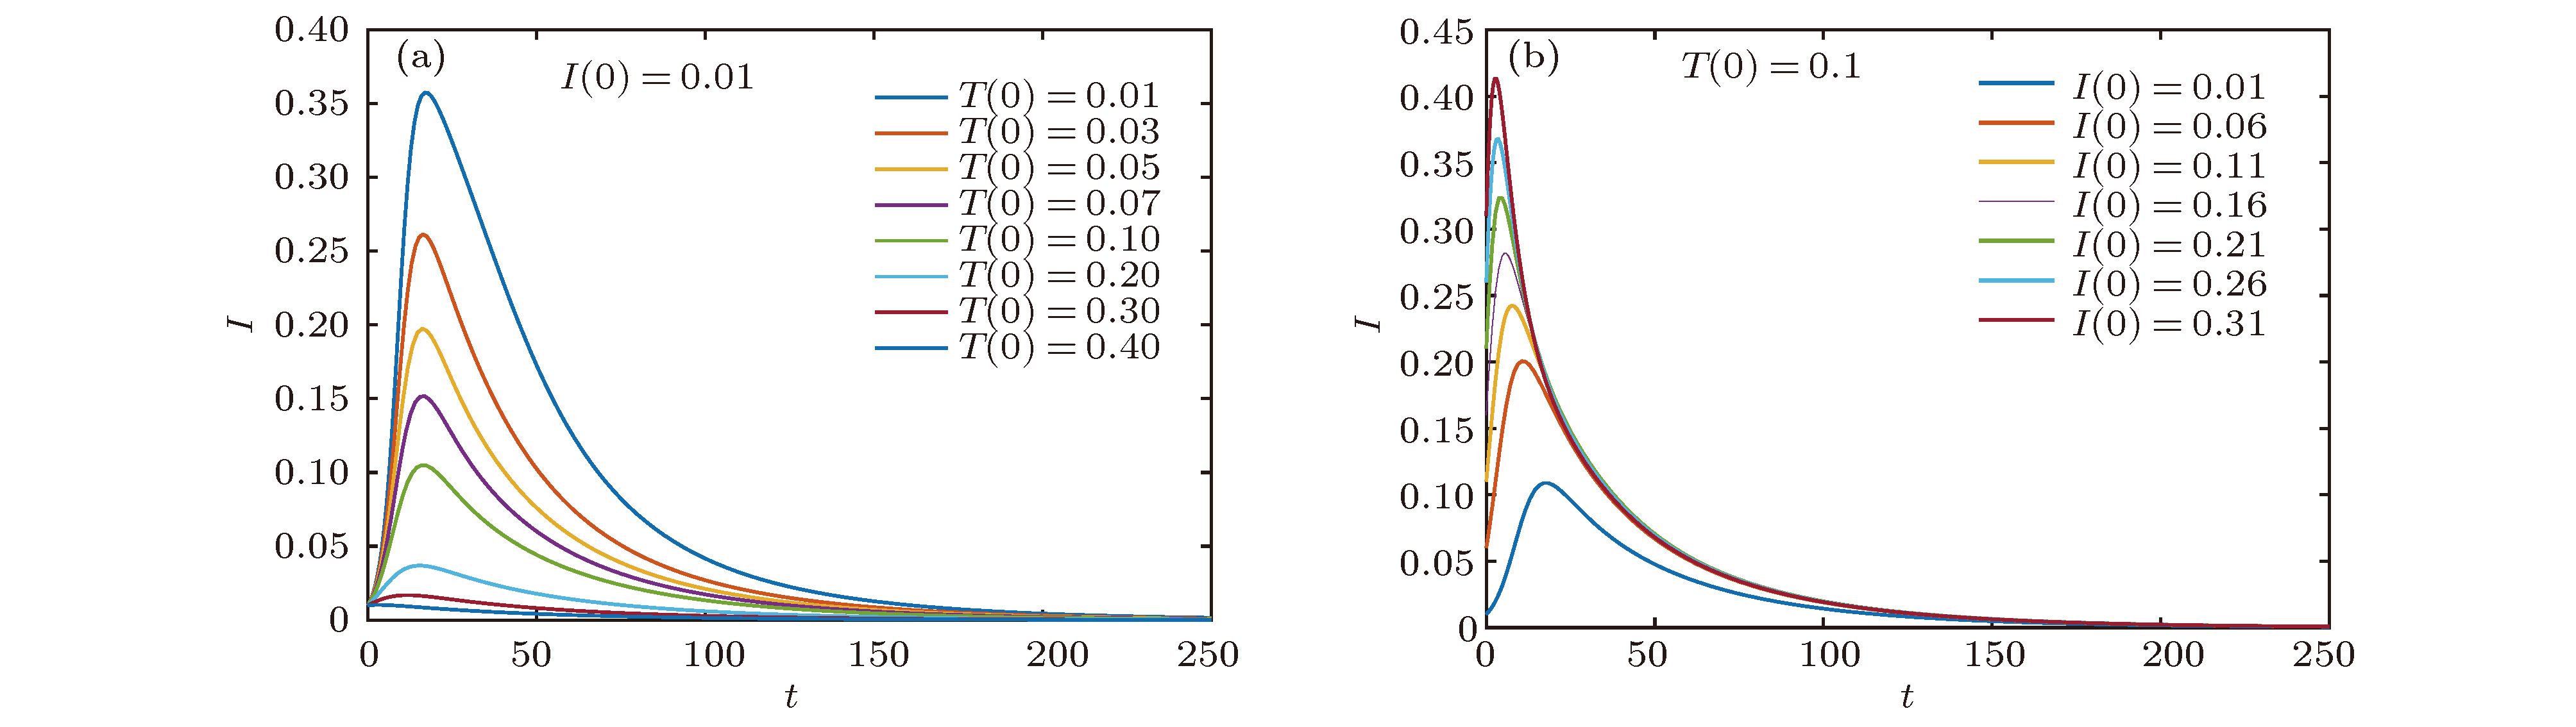 图 11 (a)不同真实信息传播者的初始值对谣言传播的影响; (b)不同谣言传播者的初始值对谣言传播的影响; 参数取值


 图 12 (a) T(0)与谣言传播者峰值


