1.Department of Physics, Dalian Maritime University, Dalian 116026, China 2.Regional Innovation Center, Akita University, Tegata Gakuen-machi 1-1, Akita 010-8502, Japan
Abstract:In the scanning magnetic domain by using the conventional magnetic force microscopy (MFM), a laser beam reflection is used to detect the static magnetic force between probe and sample. Therefore, for the MFM, it is a challenge to directly detect the dynamic magnetic force between probe and sample under an external alternating-current (AC) magnetic field. In this study, it is proved that in an alternating magnetic force microscopy (A-MFM) a sensitive Co-GdOx superparamagnetic probe can be usedto detect the dynamic magnetic force under an external AC magnetic field (frequency ωm). In the present method, the magnetization of Co-GdOx probe is modulated by an external AC magnetic field. Collecting ωm and 2ωm signals by using the combination of phase-locked loop (PLL) and lock in amplifiers can accurately represent the static (DC, which stands for direct current) magnetic field areas (the external AC magnetic field has no effect on the magnetized status of the sample) and dynamic (AC) magnetic field areas (the external AC magnetic field changes the magnetized status of the sample) of an anisotropic Sr ferrite sintered magnet at the same time, respectively. The Sr ferrite sample is a single-domain-type magnet where magnetization mainly changes via magnetic rotation. The A-MFM method can measure the strength and identify the polarities of the static magnetic field of sample with a DC demagnetized state. By modifying the traditional tapping-lift mode into a tapping-multiply lift mode, the A-MFM by using superparamagnetic tips can measure the static and dynamic magnetic field distribution in three-dimensional (3D) space. It is proved that the static and dynamic magnetic field as a function of the distance z between probe and sample are both expressed as Hz(z) = Hz(0)·exp(–kz). The experimental data are consistent with the previous theoretical calculations. The A-MFM can be used to study the dynamic magnetization process and to evaluate the magnetic homogeneity (microstructural homogeneity) of magnetic materials. Keywords:magnetic force microscopy/ magnetic materials/ dynamic magnetic force/ superparamagnetic probe
2.实 验图1(a)为交变力磁力显微镜的实验装置示意图. 在日立L-trace II 扫描探针显微镜基础上, 外加磁场感应线圈和搭建测试信号的线路, 如图1(a). 感应线圈可以产生一定频率的交流磁场, 可以周期地调制探针的磁矩. 周期变化的探针的磁矩在磁场中产生一个动态磁力能引起探针的有效弹劲系数周期地改变. 探针的振动频率被调制, 可以表示为 图 1 (a)静态和动态磁场测试的交变力磁力显微镜实验装置示意图; (b)探针扫描模式示意图, 首先轻敲获得一点的表面形貌, 之后探针多次抬举相同的高度测试磁力; 探针下落进行这一点样品表面的轻敲, 按照设置的步长移动到下一个点位置轻敲, 之后多次抬举测磁力, 这样循环测试; 这里, 设定抬举的次数为32, 每一次抬举的时间设置为60 ms, 每一次抬举位置的停留时间为 20 ms, 在抬举过程中探针的振动电压为轻敲时电压的20% Figure1. (a) Schematic diagram of A-MFM with super paramagnetic tips for DC and AC magnetic fields measurement of magnetic materials. (b) Schematic diagram of sequential probe control. First measuring the topography (tapping), after tapping, tip was lifted by the same height between the adjacent lift points. The probe drops to tap the topography of the sample at this point, and moves to the next point according to the set step, and then lifts the probe several times, so that the cyclic test was carried out. The lift points number can be set, and the wait time of lift points can be set. In this experiment, the lift points were set as 32, the every lift procession was set as 60 ms, and the wait time was set as 20 ms. Using 20% of the tapping oscillation voltage of the supe rparamagnetic tips as a lift oscillation voltage.
3.结果与讨论利用Co靶和Gd2O3靶在Ar气1 Pa气氛下磁控共溅射制备了100 nm厚的Co-GdOx超顺磁薄膜. 图2(a)表示100 nm厚Co-GdOx薄膜在室温是超顺磁性, 图2(a)的插图是小量程500 Oe的磁滞回线, 进一步验证了Co-GdOx是超顺磁性, 矫顽力为0 Oe, 初始磁化率是1.18 × 10⁻⁵ H/m. 原子力显微镜的实验结果图2(b)表明Co-GdOx薄膜的平均颗粒尺寸为20.4 nm, 表面粗糙度是0.83 nm. 超顺磁Co-GdOx探针和薄膜一起制备, 超顺磁探针是Co-GdOx薄膜覆盖在商业Si探针(SI-DF40, Seiko Instruments Inc.)上面. 样品台在溅射过程中保持旋转, 保证探针镀层的均匀性. 制备的Co-GdOx探针在大气中的共振频率约为300 kHz, 品质因数约为50. 更多关于超顺磁薄膜的微观结构和磁性能信息可参考文献[20]. 本研究中, 样品是c面抛光的硬磁Sr铁氧体块材, 铁氧体样品尺寸为1 mm × 1 mm × 1 mm, 晶粒尺寸约1 μm, 矫顽力为2.9 kOe, 矩形比为0.97. 在测试之前, 铁氧体样品进行了DC退磁, 剩余磁矩为零. 铁氧体样品的更多磁性能信息可参考文献[16]的支持材料. 图 2 (a) 100 nm厚Co-GdOx薄膜在室温下20 kOe量程的面内磁滞回线, 插图为500 Oe量程的磁滞回线; (b)利用原子力显微镜使用Si探针测试100 nm厚Co-GdOx薄膜的表面形貌结果 Figure2. (a) In plane hysteresis loops of Co-GdOx films with 100 nm thickness at 300 K at the range 20 kOe, and the inset figure is the range of 500 Oe, (b) AFM topography image of Co-GdOx films with 100 nm thickness using Si probe.
图3(a)(1—12)是使用交变力磁力显微镜结合Co-GdOx超顺磁探针获得的Sr铁氧体在不同探针和样品之间距离(T-S)的静态磁场同相X图像(ωm信号), T-S从574 nm到8794 nm. 这里, X图像不仅可以表示垂直方向静态磁场的强度, 也可以表示静态磁场的方向(垂直向上或者向下). 在图3(b)中, 线扫描结果可以清楚表示出静态磁场的零点位置, 也就是静态磁场方向转变的位置, 如果正的信号表示静态磁场垂直向上, 那么负的信号就表示垂直向下方向. 这个线扫描结果表明随T-S增加磁场强度快速降低. 当T-S大于3040 nm时, 静态磁场已经变得很弱. 在8794 nm, 静态磁场几乎是零值. 静态磁场的方向在一些地方随T-S增加会发生改变, 这是因为近表面探针与样品之间的磁力主要来自于样品表面的磁荷, 而当增加T-S, 这个磁力除了受到样品表面磁荷的作用, 也受到样品内部磁荷的作用. 图4(a)为一个静态磁场的空间分布示意图. 图3(c)(1—12)是一系列动态磁场的振幅R图像在T-S从574 nm到8794 nm. 它们和静态磁场(图3(a))同时获得. 图3(d)是线扫描结果, 动态磁场的振幅随T-S增加快速降低. 最后, 这个振幅趋于一个恒定数值. 这个恒定数值来自于探针和线圈交流磁场之间的相互作用. 当T-S小于1396 nm时, 线扫描结果给出翻转晶粒两侧的交流磁场振幅是小于探针和线圈交流磁场之间的作用, 这是因为翻转晶粒两侧产生的交流磁场方向是与线圈产生的交流磁场方向相反的(图4(b)). 图4(b)为Sr铁氧体中矫顽力较小的晶粒在一个线圈交流磁场周期中磁矩翻转的示意图. 图 3 一系列不同探针和样品距离(T-S)的Sr铁氧体的静态磁场的同相X图像(ωm信号) (a) 和动态磁场振幅R图像(2ωm信号) (c); (b)和(d)是图(a)和(c)在相同位置的线扫描, 这里T-S距离从574 nm到8794 nm Figure3. A set of A-MFM in phase X images of ωm signal (a) and the A-MFM amplitude R images of 2ωm signal (c) of Sr ferrite sample at different distances between tip and sample (T-S) from 574 nm to 8794 nm; (b) and (d) are the line profiles of (a), (c) at the same positions, respectively.
图 4 (a) Sr铁氧体的三维静态磁场分布示意图; (b)在线圈交流磁场作用下, Sr铁氧体矫顽力较小的晶粒的磁矩翻转示意图, 翻转的频率与线圈交流磁场频率相同, 这里线圈交流磁场频率是89 Hz, 振幅是800 Oe0-p(零点到峰值的强度) Figure4. (a) Schematic of 3-D static (DC) magnetic field distribution of Sr ferrite sample; (b) the changed magnetized statement of the grain (a small coercivity) of Sr ferrite sample under an external AC magnetic field (frequency is 89 Hz, amplitude is 800 Oe (zero to peak intensity)).
图5是图3(b)和图3(d)中位置1, 2和3的X图像静态磁场和R图像动态磁场的强度值随探针与样品之间的距离T-S的变化曲线. 位置1和2的静态磁场方向是相反的, 静态磁场强度随T-S的变化可以拟合为y = 17.95 exp(–2.78x). 位置3的交流磁场随T-S的变化可以拟合为y = 15.05 exp(–1.79x) + 1.45. 这里, 常数1.45是Co-GdOx超顺磁探针和线圈交流磁场之间的相互作用. 从实验上证明了静态和动态磁场随T-S以指数衰减, 这与理论计算的结果相一致[21]. 图 5图3(b)和图3(d)中位置1, 2和3的X图像静态磁场和R图像动态磁场的强度值随探针与样品之间的距离T-S变化曲线 Figure5. The plot of intensity values of A-MFM in phase X images of static (DC) magnetic field with ωm signal and A-MFM amplitude R images of dynamic (AC) magnetic field with 2ωm signal versus distance between super paramagnetic tip and Sr ferrite sample on the position 1, position 2 and position 3 in Fig.3(b), (d).
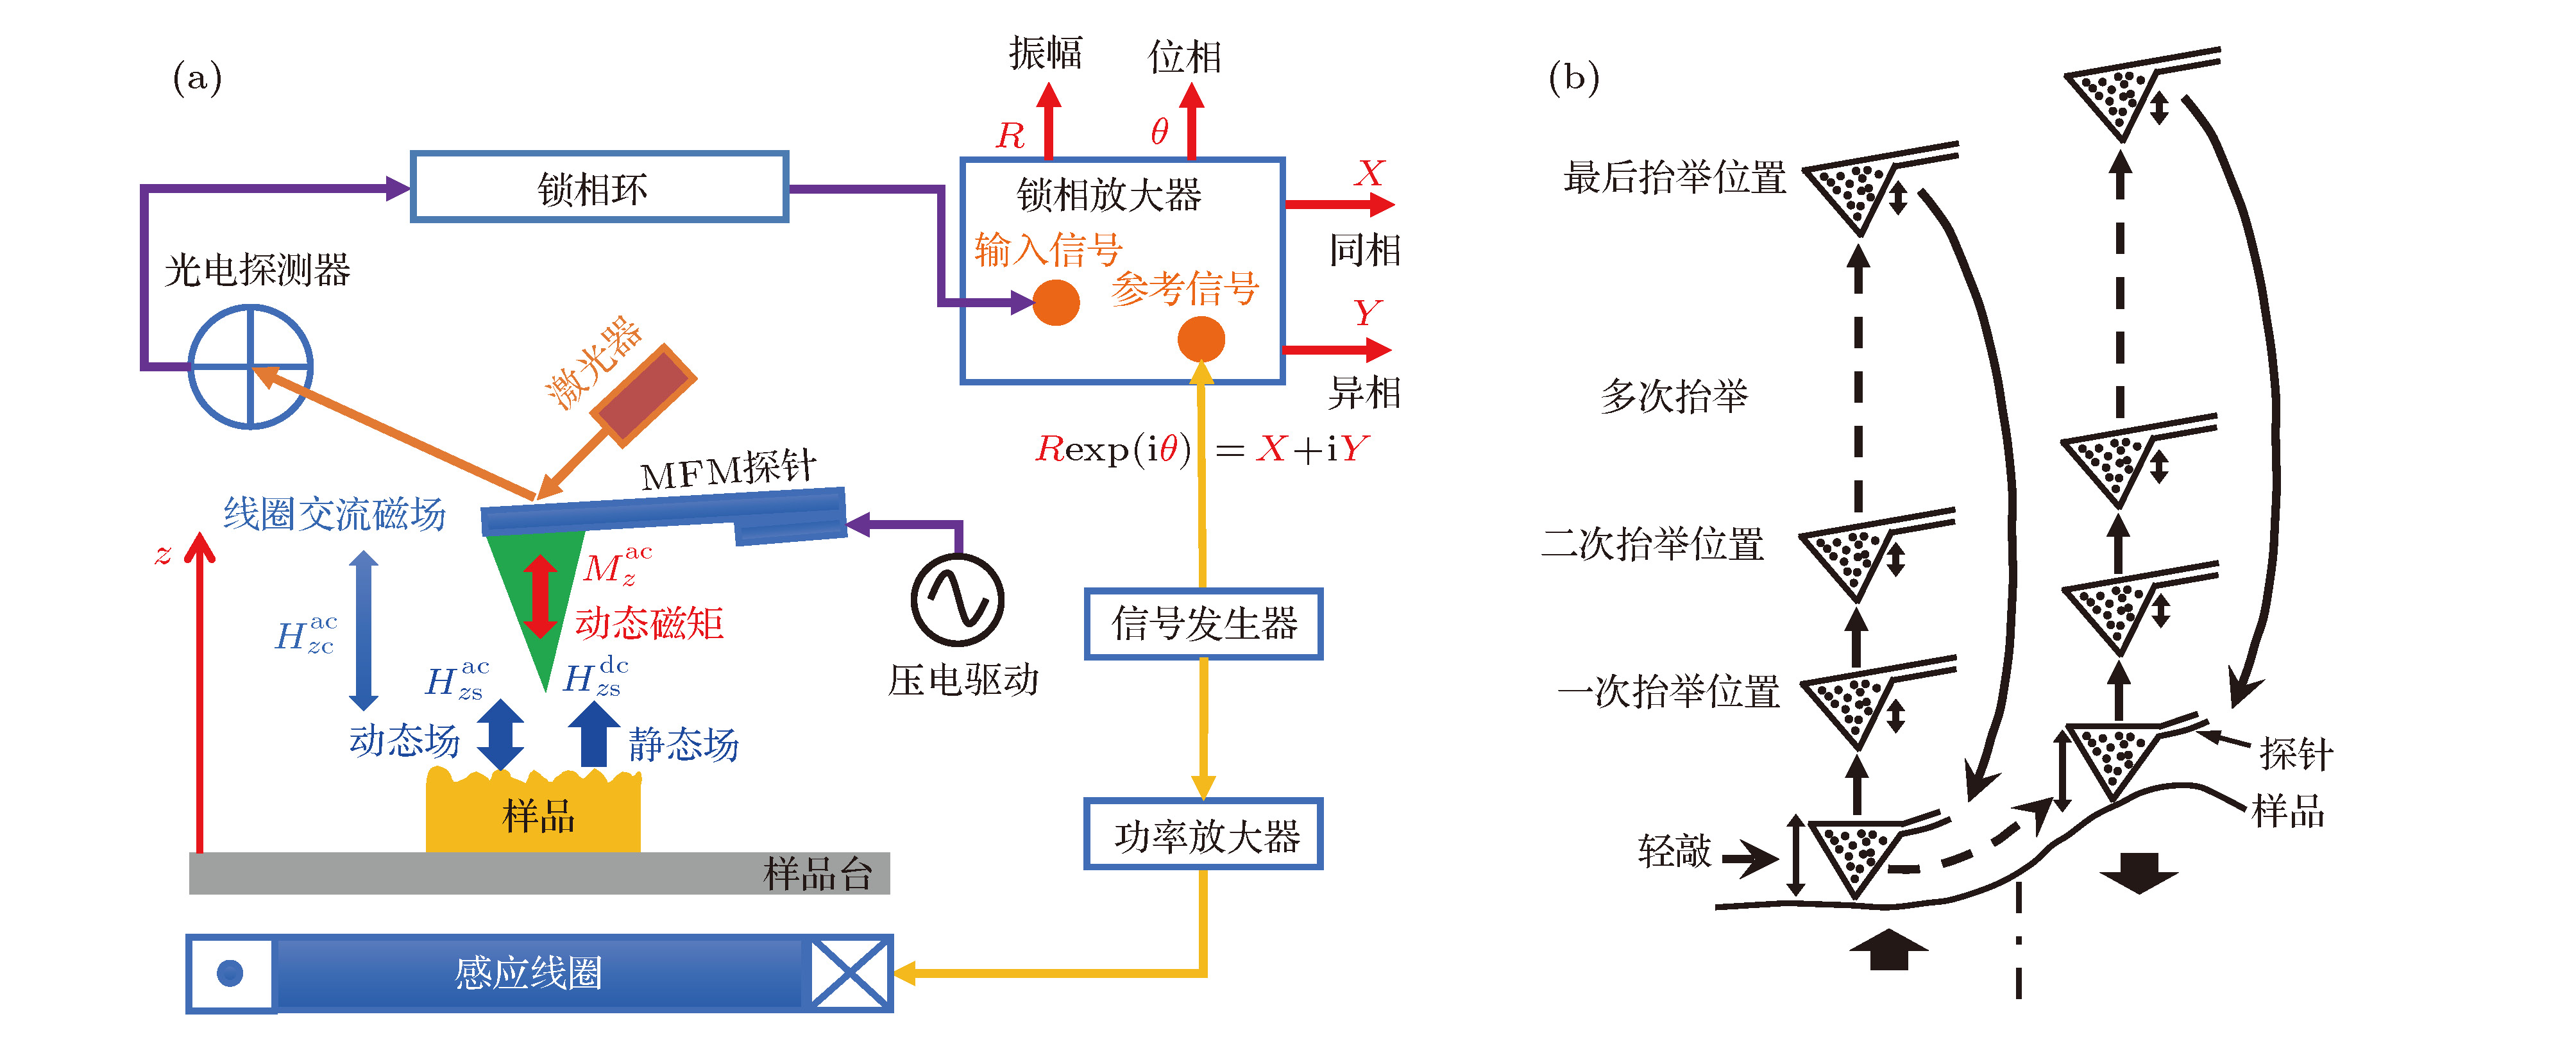 图 1 (a)静态和动态磁场测试的交变力磁力显微镜实验装置示意图; (b)探针扫描模式示意图, 首先轻敲获得一点的表面形貌, 之后探针多次抬举相同的高度测试磁力; 探针下落进行这一点样品表面的轻敲, 按照设置的步长移动到下一个点位置轻敲, 之后多次抬举测磁力, 这样循环测试; 这里, 设定抬举的次数为32, 每一次抬举的时间设置为60 ms, 每一次抬举位置的停留时间为 20 ms, 在抬举过程中探针的振动电压为轻敲时电压的20%


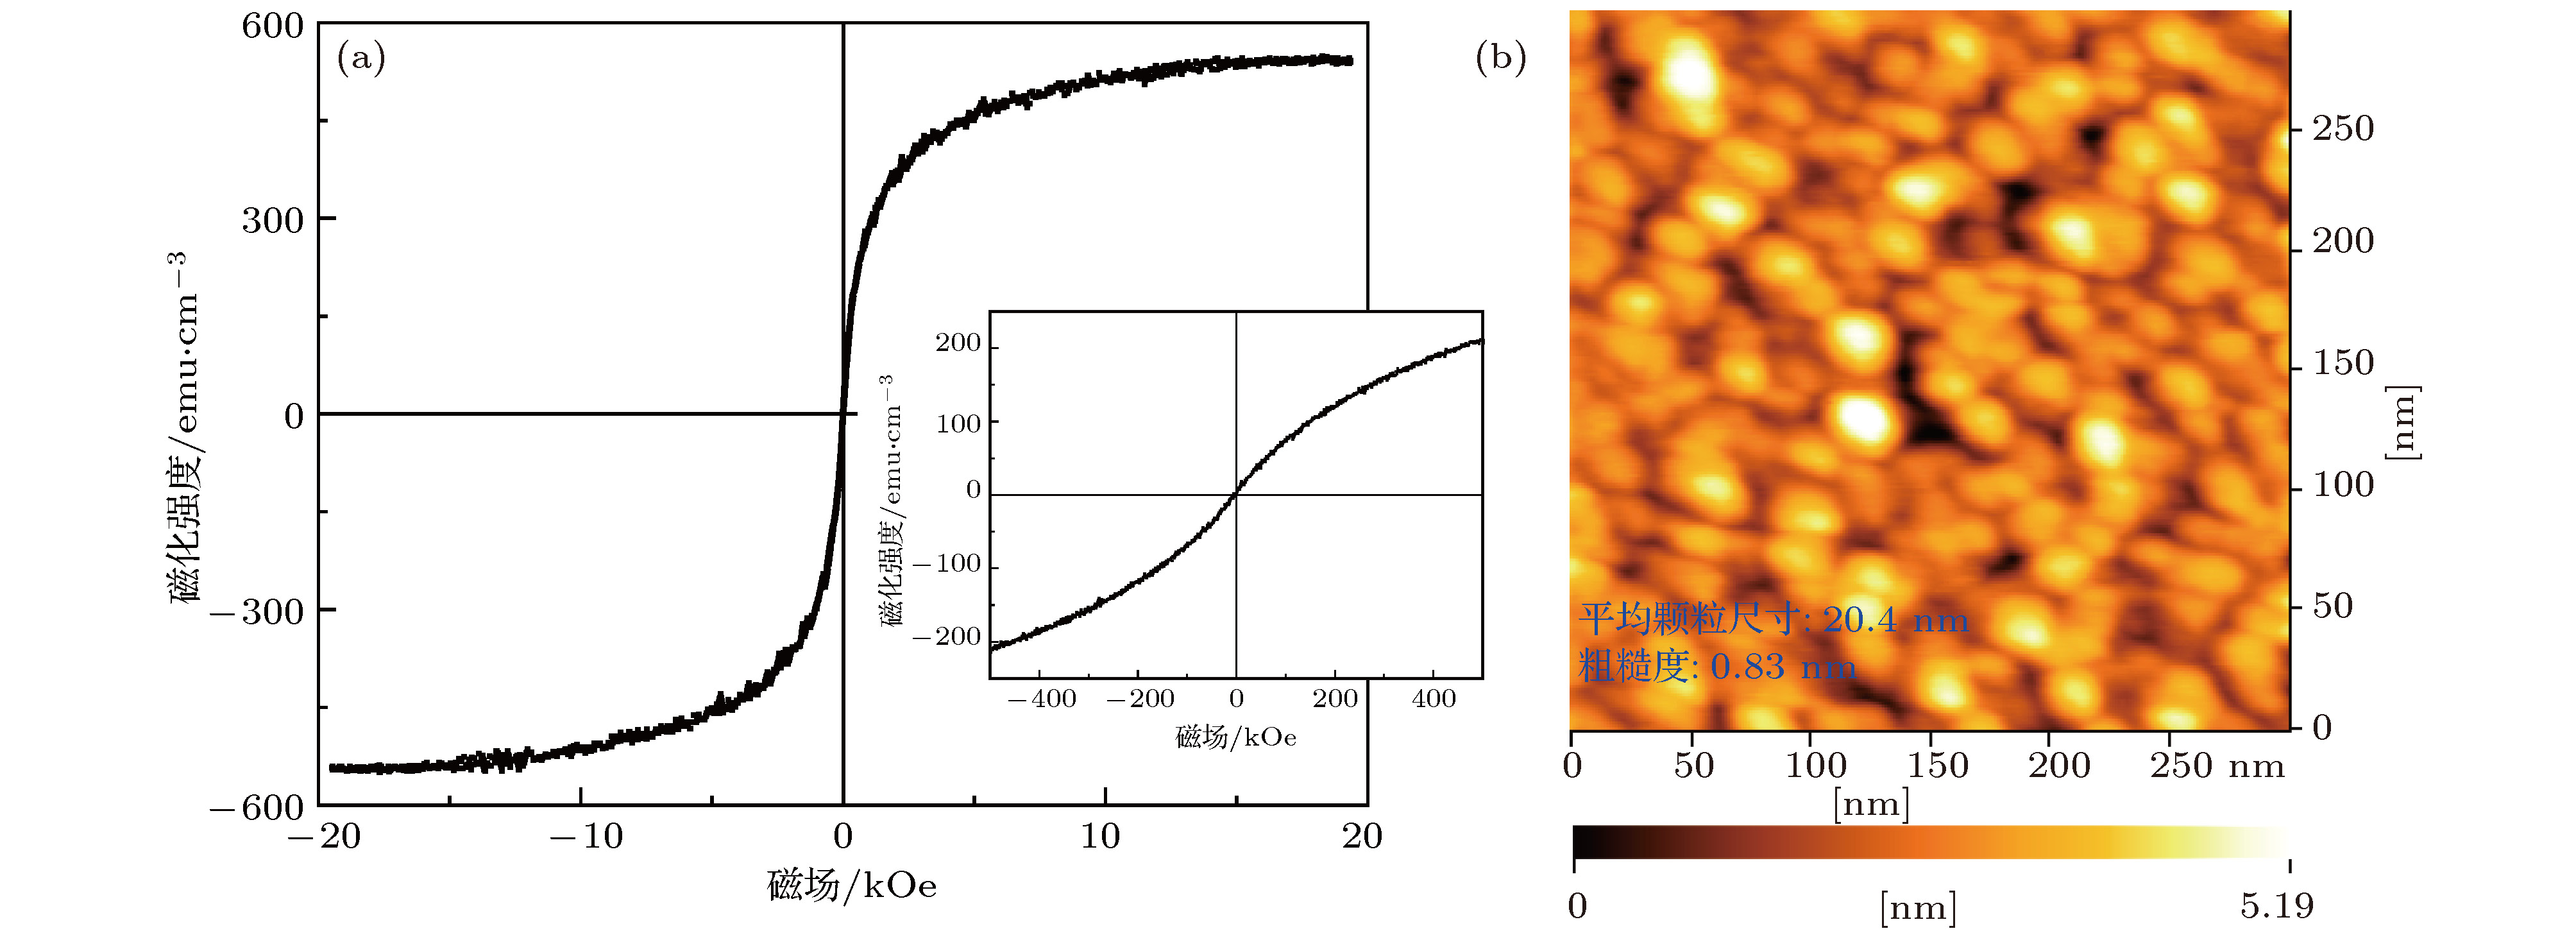 图 2 (a) 100 nm厚Co-GdOx薄膜在室温下20 kOe量程的面内磁滞回线, 插图为500 Oe量程的磁滞回线; (b)利用原子力显微镜使用Si探针测试100 nm厚Co-GdOx薄膜的表面形貌结果
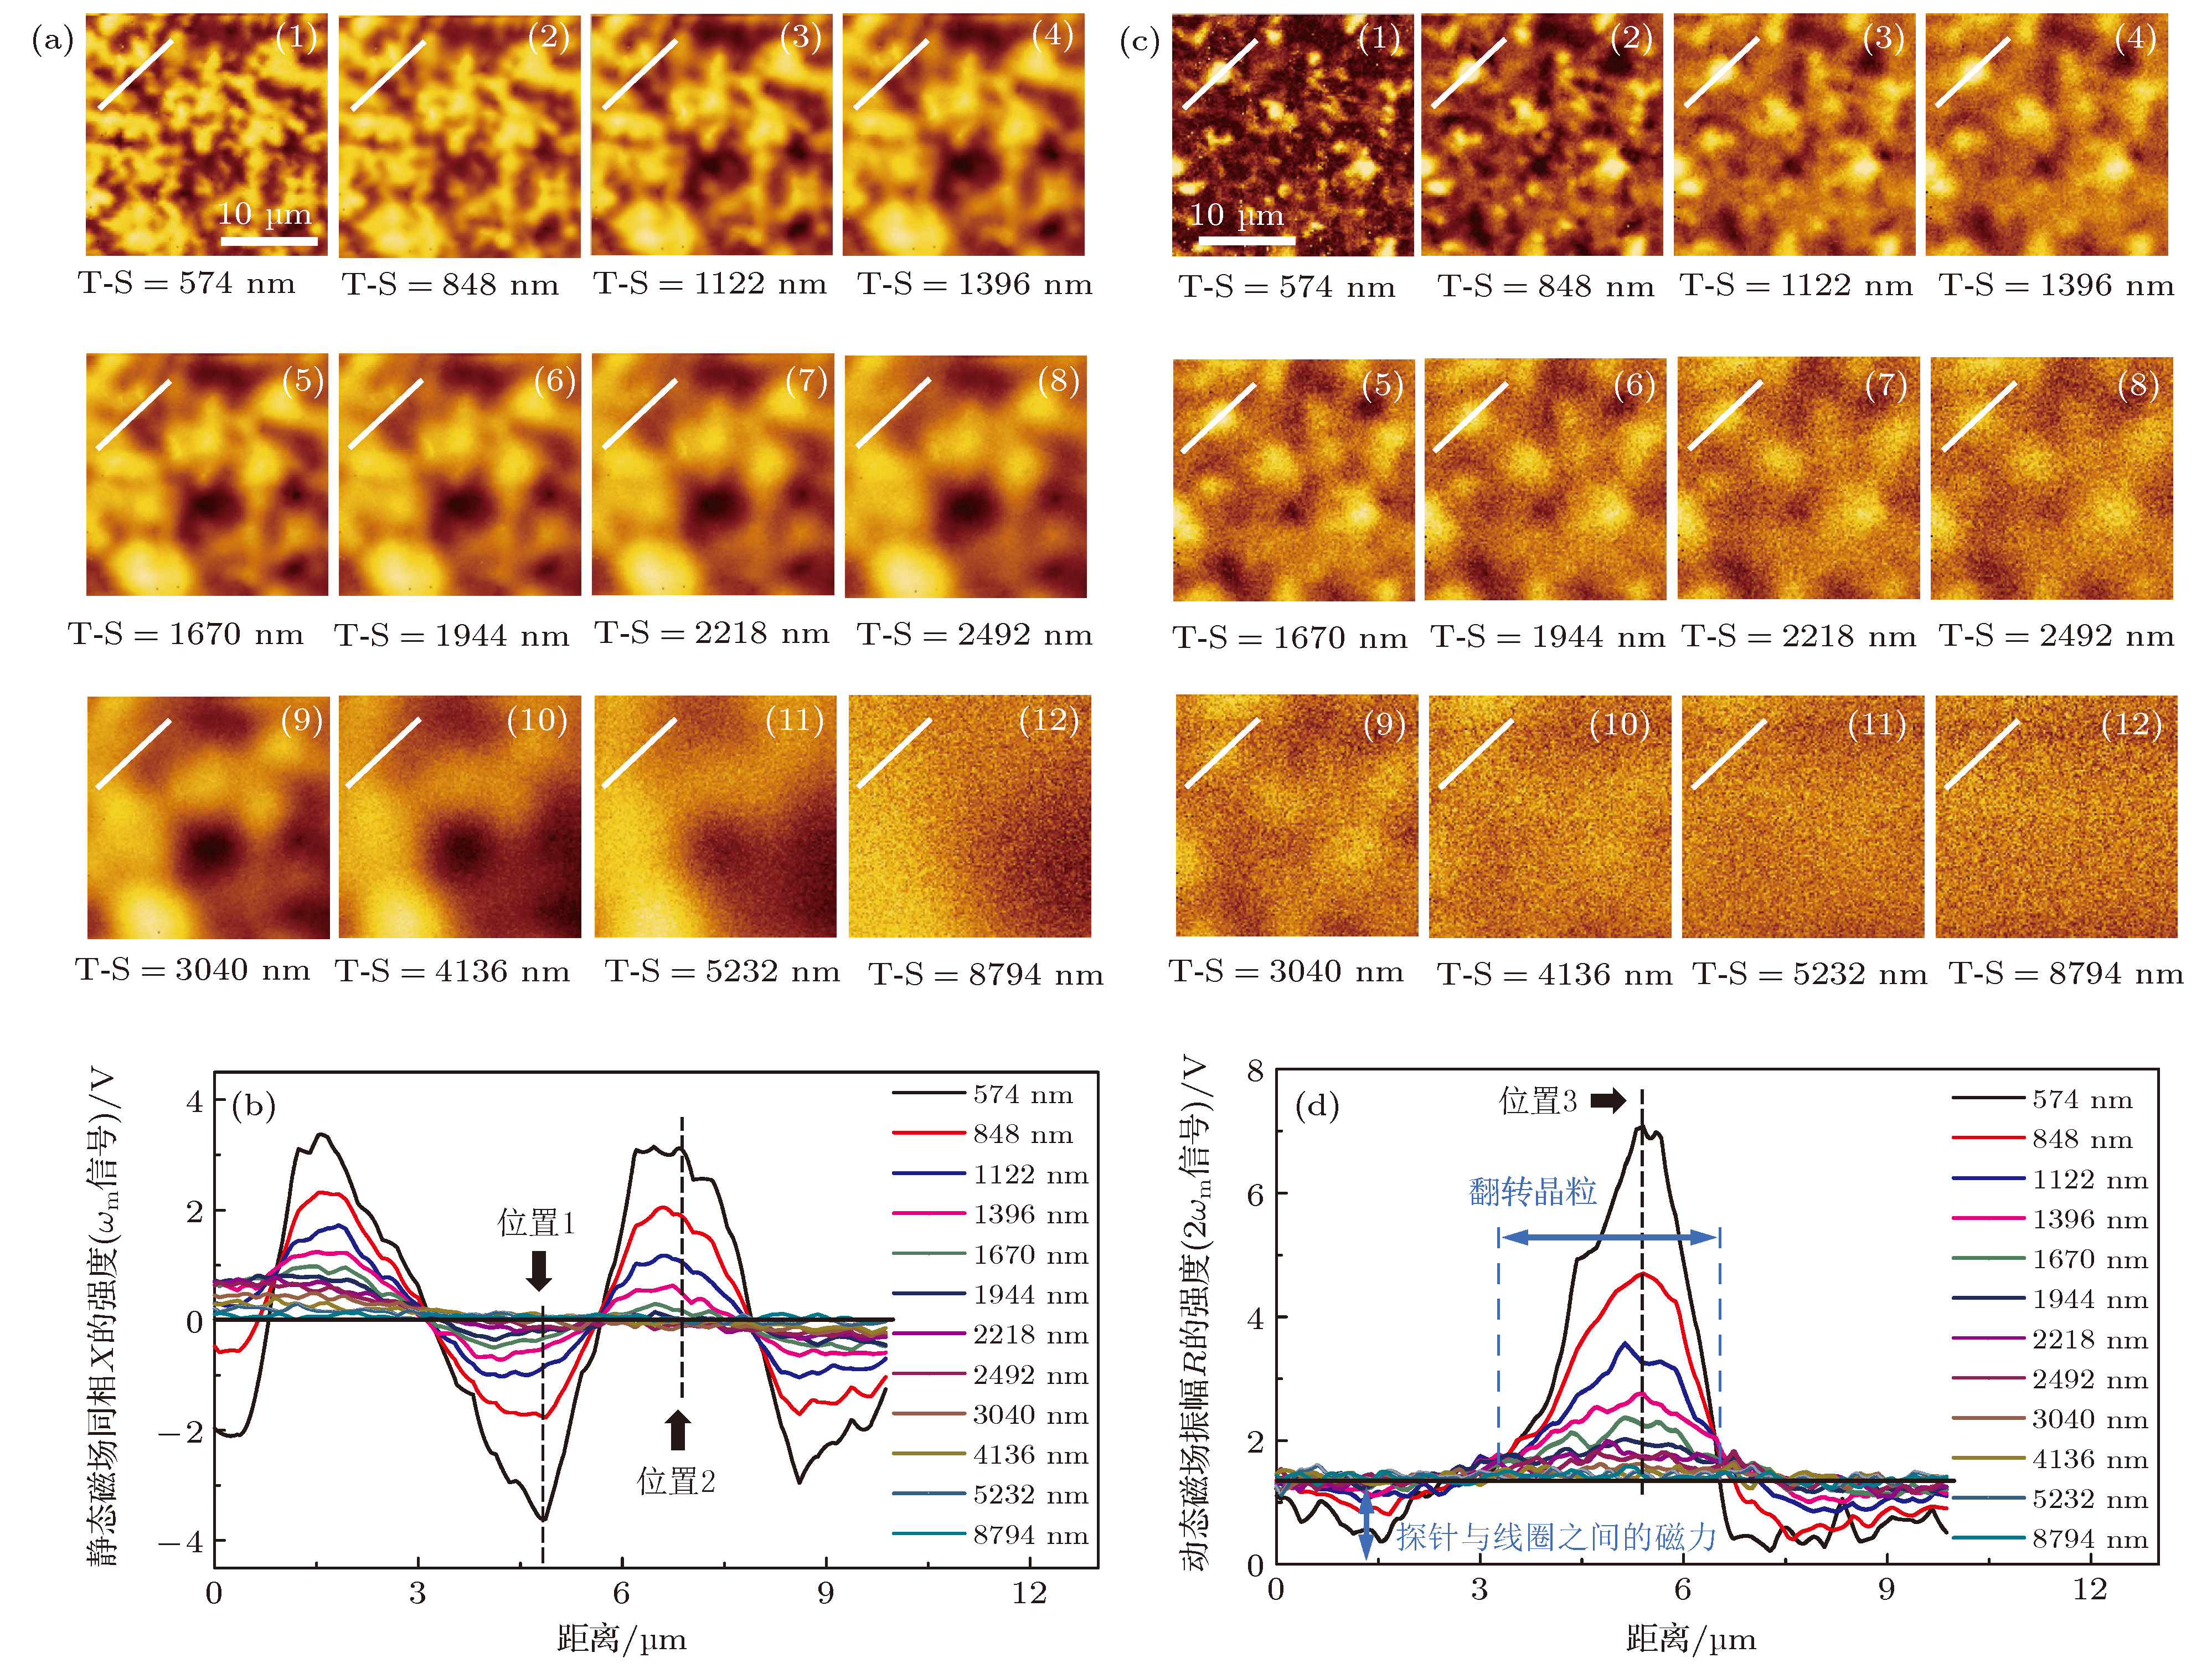 图 3 一系列不同探针和样品距离(T-S)的Sr铁氧体的静态磁场的同相X图像(ωm信号) (a) 和动态磁场振幅R图像(2ωm信号) (c); (b)和(d)是图(a)和(c)在相同位置的线扫描, 这里T-S距离从574 nm到8794 nm
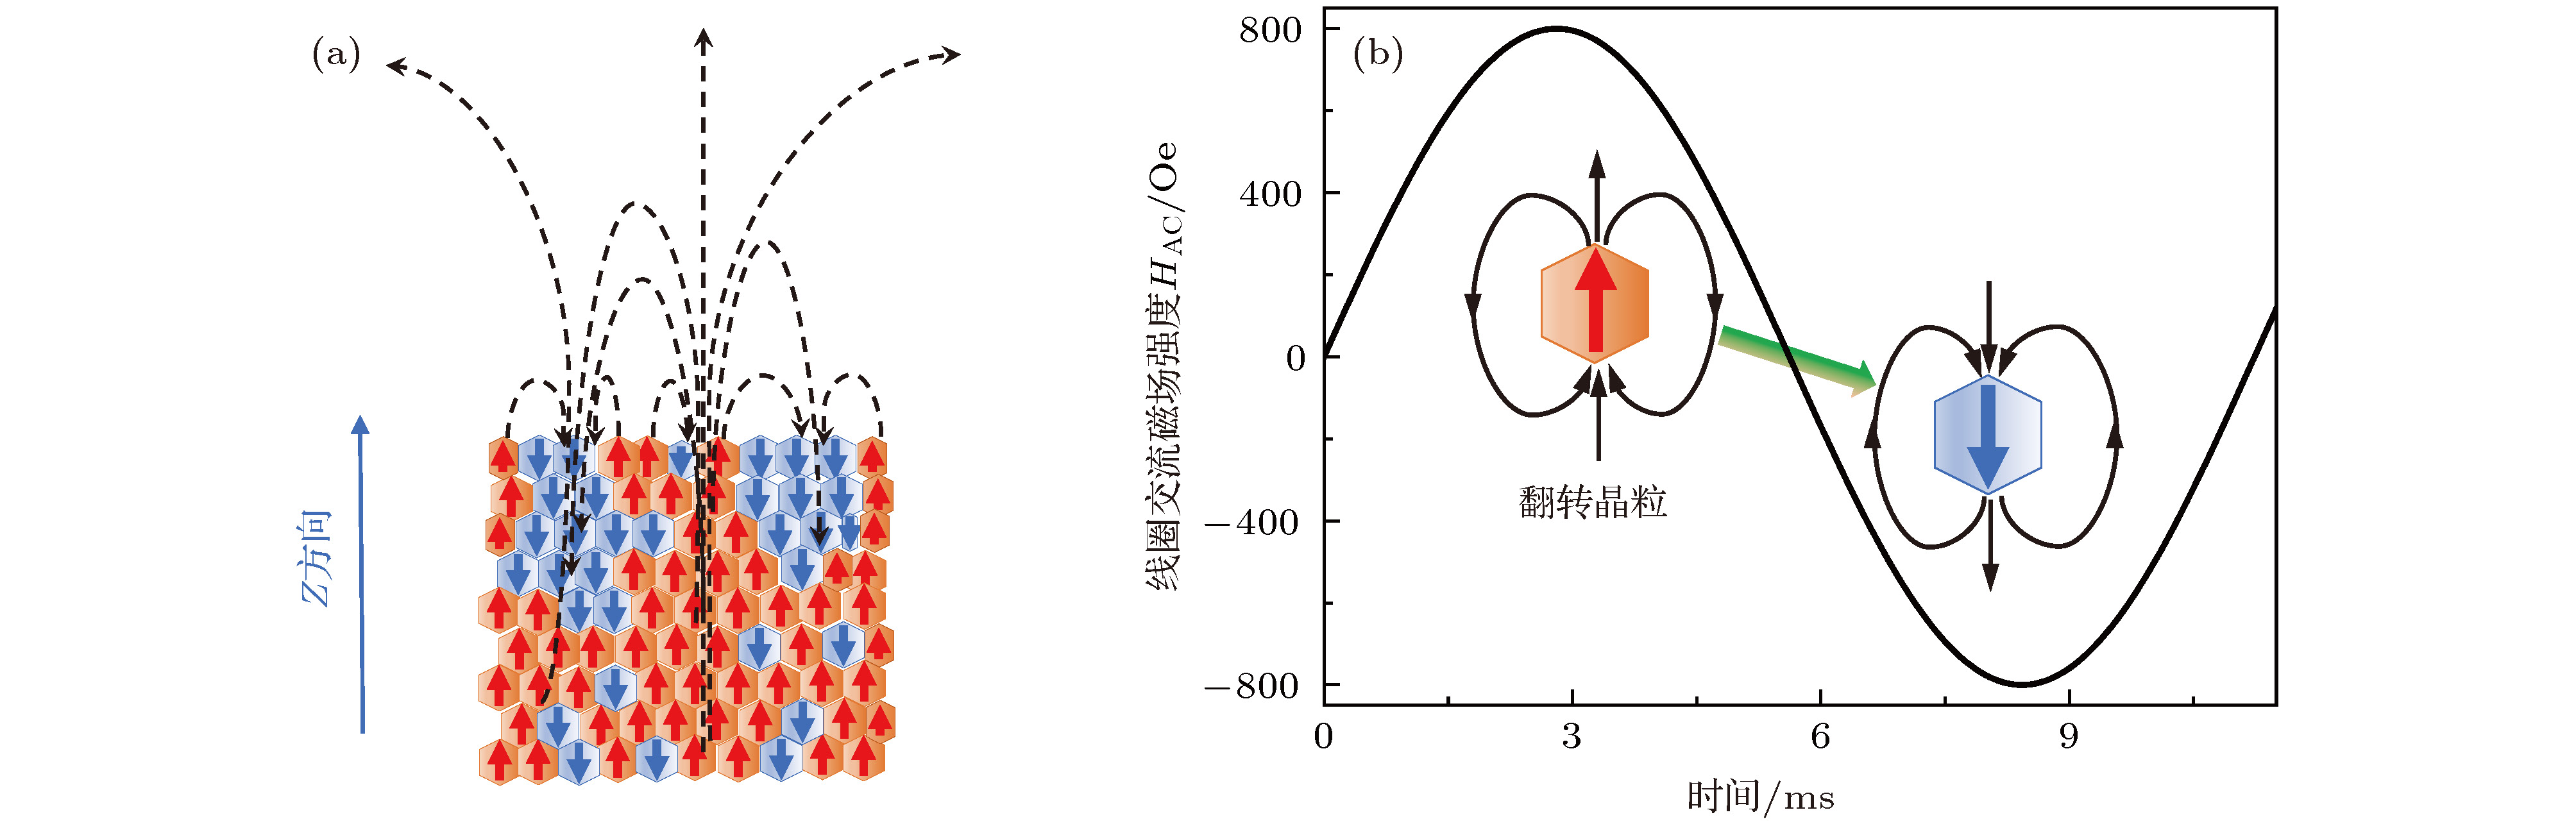 图 4 (a) Sr铁氧体的三维静态磁场分布示意图; (b)在线圈交流磁场作用下, Sr铁氧体矫顽力较小的晶粒的磁矩翻转示意图, 翻转的频率与线圈交流磁场频率相同, 这里线圈交流磁场频率是89 Hz, 振幅是800 Oe0-p(零点到峰值的强度)
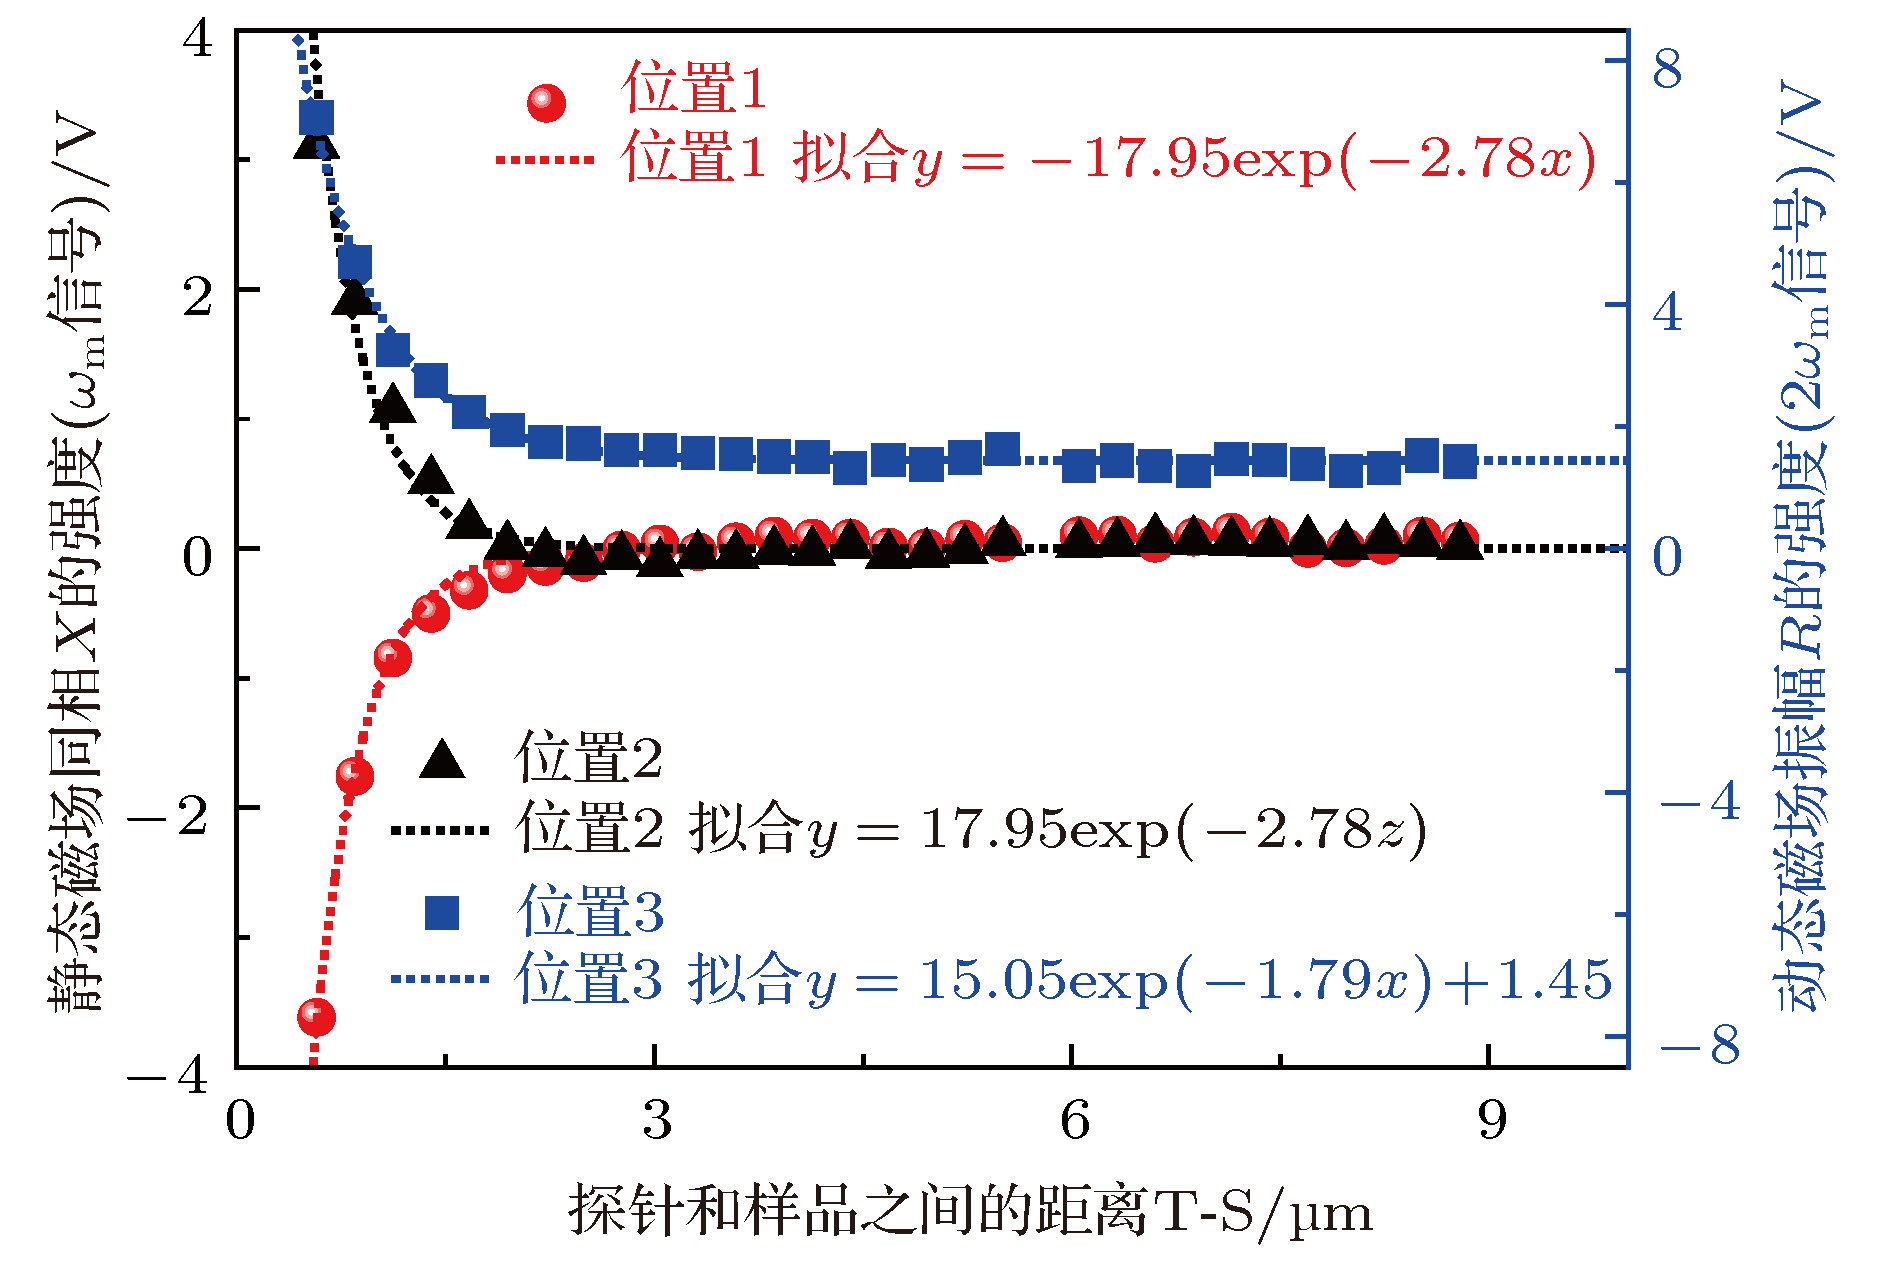 图 5 图3(b)和图3(d)中位置1, 2和3的X图像静态磁场和R图像动态磁场的强度值随探针与样品之间的距离T-S变化曲线