 ,, 柴康妮, 卓云霞, 冯长春,北京大学城市与环境学院,北京 100871
Spatial variation of migrant population's housing quality and its determinants in China's prefecture-level cities
WANG Yufan,, CHAI Kangni, ZHUO Yunxia, FENG Changchun,College of Urban and Environmental Sciences, Peking University, Beijing 100871, China通讯作者:
收稿日期:2020-09-10修回日期:2021-08-24
| 基金资助: |
Received:2020-09-10Revised:2021-08-24
| Fund supported: |
作者简介 About authors
王宇凡(1988-), 女, 天津人, 博士, 讲师, 研究方向为城市与经济地理。E-mail:

摘要
关键词:
Abstract
Keywords:
PDF (3765KB)元数据多维度评价相关文章导出EndNote|Ris|Bibtex收藏本文
本文引用格式
王宇凡, 柴康妮, 卓云霞, 冯长春. 中国城市流动人口住房质量的空间分异与影响因素. 地理学报, 2021, 76(12): 2944-2963 doi:10.11821/dlxb202112006
WANG Yufan, CHAI Kangni, ZHUO Yunxia, FENG Changchun.
1 引言
随着中国城镇住房制度改革和房地产市场的快速发展,城镇居民的住房质量不断改善,人均住房建筑面积于2019年达到了39.8 m2,比2002年增长了62.1%[1]。然而城镇的流动人口并不像当地居民可以从城市较好的基础设施和建设投资中直接受益[2]。相对于城市本地居民,流动人口无论是在居住面积、住房设施还是居住社区类型方面都处于弱势地位[3,4,5]。对流动人口而言,良好的居住条件是在城市安居乐业的重要前提[6,7]。对城市而言,改善流动人口的住房质量有利于促进流动人口的社会融入,提升城市的吸引力与竞争力[8,9]。现有研究已关注到流动人口内部出现的群体分化和地区分异。一方面,户籍类型、职业地位、受教育程度、收入水平、迁移类型等的分层影响流动人口的住房质量。与城—城流动人口相比,乡—城流动人口居住面积更小、住房设施更差[3]。职业地位、受教育程度和家庭人均年收入越高的流动人口人均居住面积越大[10]。工作不稳定、自雇者和家庭户流动人口更可能选择居住在村委会社区[11]。与智力型和投资型移民相比,劳力型移民不仅人均住房面积最低,设施条件也最差[12]。“独住型”改善住房质量的积极性不高,而“夫妻同住型”和“两(三)代同住型”家庭更具有改善住房质量的意愿[13]。更好的社会融合会提高流动人口居住在正规社区的概率并改善其住房消费水平[5]。另一方面,地方社会经济发展水平、流动人口相关政策和房地产市场的差异,使得流动人口的居住状况呈现出空间不平等。在全国范围内省级的住房拥有率和住房质量指数呈现出南北差异,而住房不受干扰指数和面积指数则表现为东西差异[4]。由于内陆地区住房成本相对较低,流动人口管理政策更具有包容性,流动人口的居住空间和住房设施均优于沿海地区[14,15,16]。
总体看来,现有研究对流动人口住房质量空间格局的关注较少,在为数不多的研究中,分析尺度为省级[4]。此外,现有研究较为充分地考察了流动人口个体和家庭属性、社会经济地位、流动特征等因素对住房质量的影响,但对流动人口所在城市的社会经济发展水平、房地产市场特征等宏观背景的探讨相对缺乏。因此,本文基于2015年全国1%人口抽样调查和2014年的流动人口动态监测调查(China Migrants Dynamic Survey, CMDS)数据,以城市为研究单元分析流动人口住房质量的空间格局,并进一步运用空间计量模型探究流动人口住房质量空间分异产生的原因。除流动人口内部特征外,还注重考察流入地外部特征对该城市流动人口住房质量的影响。随着中国住房市场从增量转向存量,维持房地产市场健康可持续发展主要依赖于激发居民的改善性需求,了解流动人口住房质量的空间格局和影响因素有助于今后制定因地制宜、因人制宜的住房更新政策,从而更好地帮助流动人口改善住房状况,向安居乐业的目标迈进。
2 研究思路框架与数据方法
2.1 研究框架与变量选择
梳理解释流动人口住房问题影响因素的经典理论,主要包括新古典经济学宏观及微观理论[13, 17-18]、效用经济学理论[12, 14, 19-22]、家庭生命周期理论[18-19, 22-23]、人力资本理论[12-15, 18-19, 21-26]、社会融合理论[11, 15-16, 26-29]、社会分层理论[10-11, 15-18, 26-32]、制度文化理论[12-15, 18-19, 21-22, 25-32]等。基于相关理论,本文选用流动人口和流入地的一系列内部和外部因素来分析流动人口住房质量及其空间差异特征的影响因素(表1)。流动人口特征包括户籍制度、家庭人口、流动属性、教育经济等方面,流入地特征包括人口、经济、住房市场等方面。Tab. 1
表1
表1流动人口住房影响因素分析框架
Tab. 1
| 类别 | 影响因素 | 研究理论基础 | 选取指标 |
|---|---|---|---|
| 流动人口特征 | 户籍制度因素 | 制度文化理论 | 户籍所在地、户籍性质 |
| 家庭人口因素 | 生命周期理论 效用经济学理论 | 性别、年龄、婚姻、子女数量、家庭规模、家庭迁移比例、迁移目的 | |
| 流动因素 | 社会融合理论 | 在流入地的停留时间、定居落户意愿、社会资本、居住社区 | |
| 教育经济因素 | 社会分层理论 人力资本理论 效用经济学理论 | 受教育程度、就业身份、职业类型、单位性质、社保、住房自有率、流出地资产、流出地收入、流入地收入、流入地支出 | |
| 流入地特征 | 人口因素 | 制度文化理论 住房市场供需理论 效用经济学理论 | 人口规模、人口结构 |
| 经济因素 | 经济水平、产业结构、公共服务 | ||
| 房地产市场因素 | 房价、房租、住房存量、新增住房供给、住房限购政策 |
新窗口打开|下载CSV
具体而言,根据制度文化理论,个体行为“嵌入”在其所处社会的制度文化之中。对于中国社会的制度环境,流动人口的住房不仅受其身份地位的特殊性所影响,并且与近几十年来的相关制度变革和宏观政策息息相关,其中户籍制度是影响流动人口住房质量的最重要因素之一。在实证过程中,选用户籍所在地(跨省或省内)和户籍性质(农业或非农业)两项指标测度户籍制度因素。一方面,现有研究发现跨省或跨地区流动者在流入地受到的制度性和结构性排斥通常更为强烈。另一方面,与城—城流动人口相比,来自于乡村的流动人口即农民工的住房状况通常比更差,他们更多居住在集体宿舍、建筑工地工棚、城乡结合部或城中村租赁住房等。因此,本文预期在跨省流动和农业户口流动人口占比更高的城市中,流动人口住房质量更低。
根据生命周期理论和效用经济学理论,处于不同生命周期阶段的家庭对居住具有差异性的需求,从不同住房质量中所得到的效用也不同。这对于包括流动人口在内的任何群体均成立,但很多流动人口在迁移过程中可能与家庭处于或长期或短期的分离状态[13]。因此,在实证过程中,除引入年龄、婚姻、子女数量等反映人口属性和生命周期的常规变量外,本文还通过引入流动人口家庭迁移比例(即本地家庭成员数量与家庭总规模之比)反映流动人口独特的家庭化迁移特征,以此分析因人口特征和家庭结构不同所导致的城市流动人口在住房质量上的分异。
流动人口的特殊性在于其流动的属性。社会融合理论认为社会中的异质性或外来群体与主流群体在文化习俗、价值观念、生活方式等方面存在着不同程度的差异,前者对后者的融合程度是决定其在社会中行为模式的关键因素。在流入城市停留时间长,打算长期定居的流动人口的心理和生活方式都接近本地居民,有能力也愿意在城市里的住房上进行投入,从而具有更高的住房质量[4, 11]。根据迁移目的的不同,流动人口对于住房质量的需求也将有所差异。在实证过程中,本文将流动人口特有的流动属性纳入分析框架,衡量指标包括流动人口的迁移目的、在流入地的停留时间和停留意愿。本文预期在迁移目的为务工经商、停留时间较长、具备长期停留意愿的流动人口占比更高的城市中,流动人口普遍会选择质量更好的住房。
流动人口的人力资本包括受教育程度、流动经历、培训、健康、年龄等多个方面。本文通过研究综述,结合数据可得性,着重考察受教育程度、收入和支出水平、就业情况等3个方面的影响。受教育程度高的外来人口在住房市场拥有更多的决策信息和更强的决策能力。不少超大城市将流动人口受教育程度与城市落户相挂钩[15],受教育程度高的流动人口更有可能获得购房机会。流动人口的就业岗位相对越好,收入越高,越有可能获得质量更好的住房。
社会分层理论认为在市场经济体制下,住房分配是对社会阶层分化的反映,人们的收入、职业等分层特点决定了其住房质量。随着中国住房市场化程度的提高,住房分化程度也随之加剧,城市的住房差异成为了阶层差异的重要标志之一[16],个人的政治资本、人力资本、职业状况及收入水平都显著影响了人们住房资源的获得[17]。收入水平、职业地位、受教育程度越高的流动人口掌握着相对较多的社会经济资源,从而增加个体获取质量更高的住房的机会。因此,本文将一系列流动人口的教育经济因素纳入分析,以考察城市流动人口在社会经济地位方面的分层特征在其住房质量中发挥的作用。
流动人口的住房不仅取决于自身的需求偏好和支付能力,还受到流入城市的诸多影响。个体和集体的住房选择不仅是简单的消费或投资决策,它们深深地“嵌入”在所在的社会中,与包括人口组成、经济结构、生活习俗等社会其他部分不可割裂。另外,城市住房市场的价格、供给和需求也影响着个体的住房消费能力和可以获取的住房质量。因此,本文纳入流入地的人口、经济发展、房地产市场等因素,以考察不同城市中流动人口住房质量的异质性特征。
2.2 研究数据
研究区域为中国地级及以上行政单元。无论是对流动人口住房质量空间格局与影响因素的描述分析,还是制定相应的人口和住房策略,地级及以上行政单元都是较适合的研究单元。研究数据包括宏、微观层面的流动人口数据以及宏观层面的城市数据,通过地级及以上行政单元作为公共字段相互关联,并汇总至地级及以上行政单元层面进行分析。流动人口数据主要来源于2015年全国1%人口抽样调查和2014年流动人口动态监测调查(CMDS)。2015年的全国1%人口抽样调查包括除港澳台以外的31个省(直辖市、自治区)的省内和省际流动人口,不把离开户口所在地半年以下的人口统计为流动人口。此外,流动人口中包含有数量相当可观的市区内人户分离人口,本文将此部分人口剥离。2014年的CMDS样本覆盖了313个地级及以上行政单元,由于拉萨市、日喀则市、林芝地区等3市缺失数据较多,研究单元为除以上城市外的310个地级及以上行政单元(含直辖市、地级市、地区、自治州、盟)。
2015年全国1%人口抽样调查详细询问了受访者的住房质量状况,包括住房面积、厕所类型、厨房类型、建筑年代等。2014年的CMDS数据包含受访者居住在村委会还是居委会,从而可以用来衡量城市流动人口居住社区性质。两个统计数据相隔一年,不存在明显差异。城市数据来源于《中国城市统计年鉴》、国信房地产信息网、北京国信达数据技术有限公司等。由于流动人口数据的调查时点为2015年10月,考虑滞后性,除特殊说明外,城市数据年份均选取2014年。
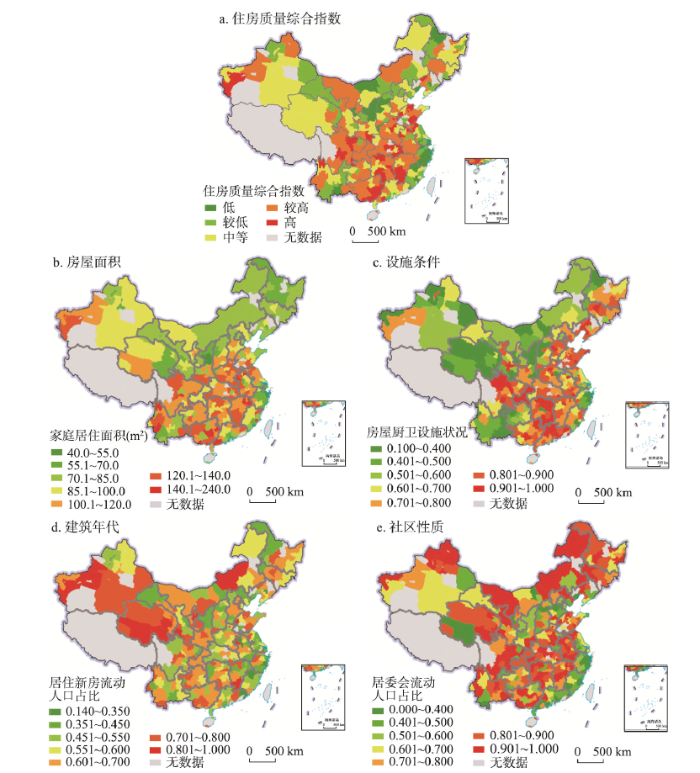
借鉴已有研究[11, 16-17],根据数据可得性,本文将城市流动人口的住房质量分为4个维度:① 房屋面积:反映流动人口居住的拥挤程度,房屋面积越大往往居住越舒适。选取城市中全部流动人口受访者家庭住房建筑面积的平均值作为房屋面积指标。② 设施条件:房屋内的设施条件反映流动人口居住的便捷程度,其中独立使用的厨房和厕所有利于实现家庭私密性生活,也是当前流动人口住房设施中较为欠缺的方面[4]。选取城市中有独立使用厨房的流动人口占全部流动人口之比与城市中有独立使用厕所的流动人口占全部流动人口之比的乘积作为设施条件指标。③ 建筑年代:建筑年代与住房质量密切相关,较早期的建筑可能存在年久失修、设施老化等问题。选取城市中住房建成年代在2000年后的流动人口占全部流动人口之比作为建筑年代指标。④ 社区性质:社区性质反映了流动人口居住的邻里环境,与村委会社区相比,居委会社区在治安环境和获得城市的公共设施配套等方面更具有优势,从而居住质量相对更高。选取社区性质为居委会的流动人口占全部流动人口之比作为社区性质指标。
将以上4项指标分别进行标准化后取平均值作为流动人口住房质量综合指数,以反映城市流动人口住房质量整体水平。
2.3 研究方法
(1)全局莫兰指数。通过衡量全局空间自相关的莫兰指数(Global Moran's I)分析表征流动人口住房质量的4项指标及综合指数在空间上的分布是否具有非随机的集聚性。计算公式如下:式中:xi、xj分别为城市i、j的流动人口住房质量4项指标及综合指数;
(2)空间回归模型。空间回归模型由于能够有效解决回归模型中复杂的空间自相关性问题,本文分别采用普通最小二乘线性回归模型(Ordinary Least Square, OLS)、空间滞后回归模型(Spatial Lag Model, SLM)和空间误差回归模型(Spatial Error Model, SEM)分析,并择优选用。SLM模型主要探讨各变量在一个地区是否有扩散现象(溢出效应),将空间依赖看作本质现象。SEM模型能够度量邻接地区因变量的误差冲击对本地区观察值的影响程度。对于上述两种模型的估计采用极大似然估计法(Maximum Likelihood Estimation, MLE)。当确信每个个体的观测值受其周围值的直接影响时,采用SLM模型更合适;当确信观测值并没有直接受到周围观测值的直接影响,而是因为某些在模型识别中忽略的空间聚集特征影响了个体的观测值及其周围值,采用SEM模型更合适。
3 中国流动人口住房质量空间分异特征
3.1 流动人口住房质量空间差异
2015年中国流动人口家庭房屋面积平均值为98 m2,低于城镇本地家庭平均房屋面积(123 m2)。但从人均角度看,2015年流动人口在流入地的平均家庭规模为2.61人[18],人均居住面积约为37 m2,甚至略高于同期城镇居民水平(33 m2)。住房内有独立使用的厨房的流动人口占比为86.2%,有独立使用的厕所的流动人口占比为81.6%,而2010年城镇居民拥有独立厨房和厕所的比例分别为87.1%和77.9%[19],可见流动人口与城镇居民独立厨卫拥有率差异较小。流动人口主要居住在居委会社区,占全部流动人口的比例为69.9%。居住在2000年以后建成的房屋的流动人口家庭占比为58.4%。总体而言,流动人口的住房质量与城镇本地居民差距并不悬殊。流动人口住房质量的空间差异明显(图1),中部、南部地区流动人口住房质量整体水平较高,东南沿海一带住房质量整体水平较低。分指标来看则呈现出房屋面积南高北低,设施条件东高西低,建筑年代以省内城市间差异为主,社区性质除东南沿海、京津冀和山陕地区外以居住在居委会而非村委会社区为主的特点。
图1
 新窗口打开|下载原图ZIP|生成PPT
图12015年中国城市流动人口住房质量的空间分布
注:基于自然资源部标准地图服务网站GS(2019)1825号标准地图制作,底图边界无修改。
Fig. 1Spatial distribution of migrant population's housing quality of prefecture- and provincial-level cities in 2015
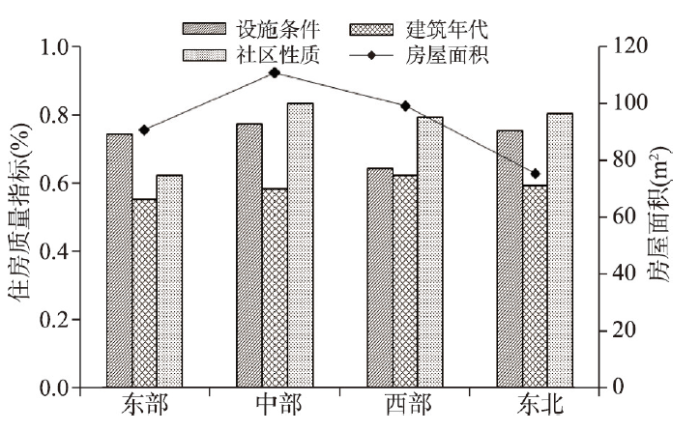
将样本按照东部、中部、西部、东北四大地理区域划分①(①东部、中部、西部、东北四大区按照国家统计局公布的《东西中部和东北地区划分方法》进行划分,详见
图2
 新窗口打开|下载原图ZIP|生成PPT
图22015年中国不同区域城市流动人口住房质量的差异
Fig. 2Differentiation characteristics of migrant population's housing quality of cities in different regions of China in 2015
3.2 流动人口住房质量城市等级差异
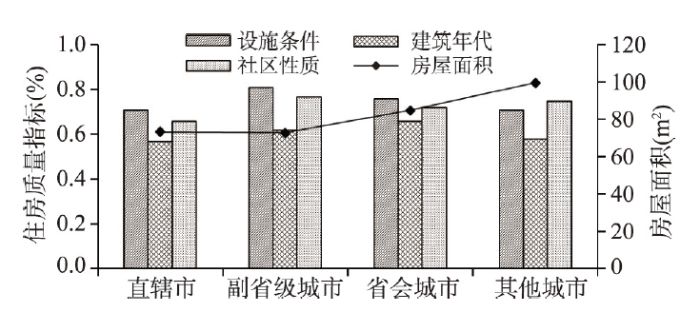
按照城市行政等级和规模等级划分,不同等级行政单元在住房质量的4个维度各有优劣势。如图3所示,房屋面积随着城市行政等级的提高而递减,设施条件和建筑年代随城市等级升高呈现出不对称的倒“U”型格局,社区性质随着城市等级变化出现了波动。综合来看,直辖市流动人口的房屋空间小、设施配置不齐全、建筑年代老、村委会社区比例大,整体质量最差。这一方面是由于其房价和房租偏高,流动人口退而选择城中村、城乡结合部居住,因而存在居住拥挤、设施不足和房屋老化等问题;另一方面,高等级城市落户门槛高,流动人口多将其作为临时工作地,具有较低的住房消费倾向。副省级城市和省会城市设施较为齐全、建筑年份新,但房屋面积居中。这是由于这些城市建设水平较好,住房成本居中。图3
 新窗口打开|下载原图ZIP|生成PPT
图32015年中国不同等级城市流动人口住房质量的差异
Fig. 3Differentiation characteristics of migrant population's housing quality of cities of China in different hierarchies in 2015
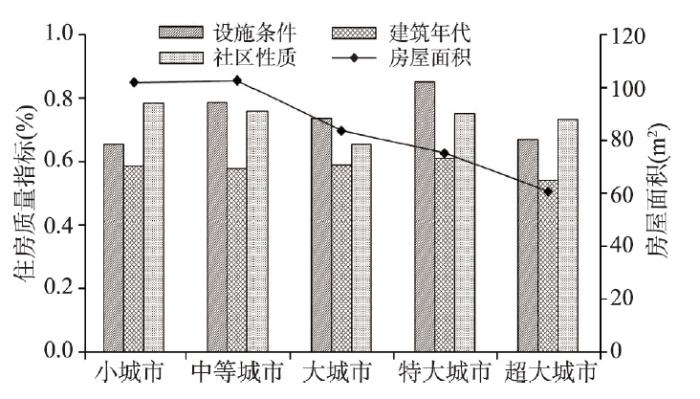
基于国务院于2014年发布的《国务院关于调整城市规模划分标准的通知》(国发[2014]51号),以城区常住人口为统计口径,将城市划分为5类。中等城市流动人口住房质量最佳,其次是小城市、大城市和特大城市,超大城市住房质量最差。随着城市规模增大,设施条件呈现出非对称的“M”型分布格局(图4),即中等城市和特大城市流动人口住房设施条件最优而小城市和超大城市设施条件最差。除超大城市流动人口住房建成年代较早外,建筑年代的分布相对均衡。社区性质方面各规模等级城市流动人口居住在居委会社区的比例均位于75%附近,但大城市例外,仅为66%。房屋面积则随着城市规模等级的增大而减小,即小城市流动人口房屋面积最大,达到103 m2,超大城市流动人口房屋面积最小,仅为61 m2。整体而言,在中等城市流动人口更容易获得面积较大、设施齐全、位于居委会社区的住房;小城市、大城市和特大城市分别在设施条件、社区性质、住房面积方面存在劣势;在超大城市,流动人口居住较为拥挤、房屋老旧、设施缺乏。
图4
 新窗口打开|下载原图ZIP|生成PPT
图42015年中国不同规模城市流动人口住房质量的差异
Fig. 4Differentiation characteristics of migrant population's housing quality of cities in China on different scales in 2015
3.3 流动人口住房质量空间集聚特征
流动人口住房质量呈现集聚分布模式,存在显著的空间自相关(表2)。流动人口的住房质量综合指数以及房屋面积、设施条件、建筑年代和社区性质指标的莫兰指数较高,且均在0.1%的水平上显著,说明中国城市流动人口的住房质量在统计学意义上存在明显的正向空间自相关,呈现集聚分布模式。其中房屋面积、设施条件集聚程度较高,而建筑年代集聚程度则相对较低。Tab. 2
表2
表2中国城市流动人口住房质量的全局莫兰指数检验结果
Tab. 2
| Moran's I | P值 | Z值 | |
|---|---|---|---|
| 住房质量综合指数 | 0.435 | 0.000 | 11.825 |
| 房屋面积 | 0.401 | 0.000 | 10.319 |
| 设施条件 | 0.422 | 0.000 | 10.856 |
| 建筑年代 | 0.132 | 0.001 | 3.448 |
| 社区性质 | 0.302 | 0.000 | 7.790 |
新窗口打开|下载CSV
利用Getis-Ord
图5
 新窗口打开|下载原图ZIP|生成PPT
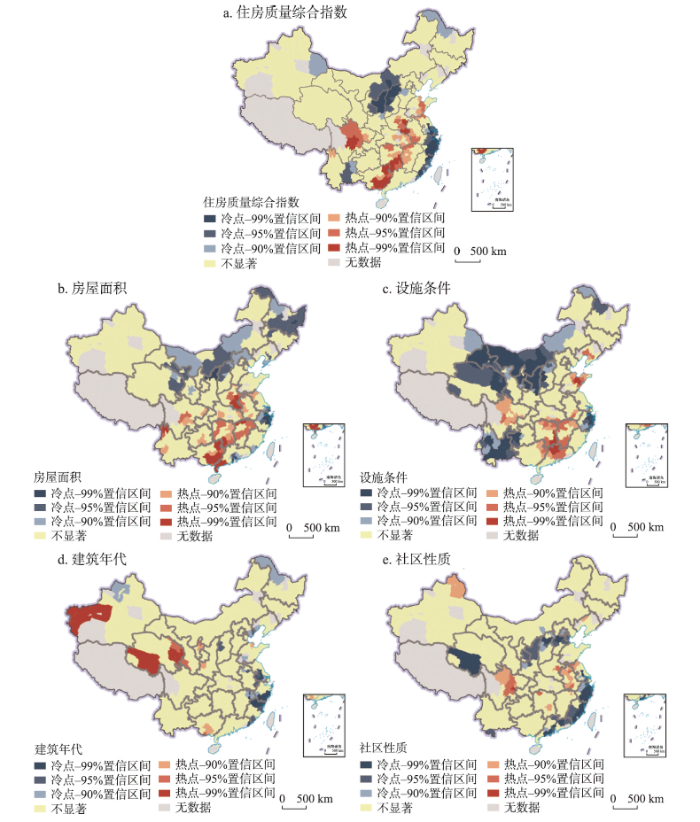
图52015年中国城市流动人口住房质量的热点分析
注:基于自然资源部标准地图服务网站GS(2019)1825号标准地图制作,底图边界无修改。
Fig. 5Hot spot analysis of migrant population's housing quality of prefecture- and provincial-level cities of China in 2015
(1)中部的鄂豫皖、鄂湘赣交界地区和四川中部、广西东南部以及山东中部形成了住房质量综合指数的热点区,这些地区多为欠发达地区,人口以净流出为主[20],城市可为有限的流入人口提供质量良好的住房。而东南部沿海一带和山西、陕西、内蒙古交界地区则形成了住房质量综合指数的冷点区。
(2)房屋面积热点区主要位于西南和中部地区,包含四川东南部、广西东部、湖南和江西大部分地区以及鄂豫皖交界地区。这些地区流动人口总量较少[21],住房供给相对充足,且多为中、低住房成本区域[22],流动人口能够负担较大面积住房。此外,这些地区的流动人口以省内流动为主[21],在流入地的家庭规模更大,代数更多[23],提高住房质量的动机更强。而珠三角、长三角的部分城市以及内蒙古高原,黑龙江大部分地区为流动人口住房面积的低值集聚区。
(3)住房设施条件的热点区主要分布在中南部以及川、鲁部分地区。而西部的云南、青海、甘肃部分地区,北部内蒙古、宁夏、陕西、黑龙江部分地区和浙江则是住房设施的冷点地区。湖南、江西、广西、四川等地住房成本较低,流动人口住房质量较高。而西南的贵州、云南,西北的青海、甘肃以及北部的内蒙古等地城镇居民住房设施水平整体偏低[24],作为外来者的流动人口更无法获得设施完备的住房。
(4)建筑年代的空间集聚程度相对较低,其热点地区主要分散在西部的宁夏、青海和新疆的部分地区,冷点地区分散在东部的长三角、黑龙江部分地区。长三角地区、东北老工业基地是中国工业发展和城市建设较早的地区,较多早期建成的住房为流动人口提供了相对廉价的住房。西部地区经济发展起步相对较晚,老旧住宅数量较少。但整体而言,流动人口住房的建筑年代的省际分异较小,省内城市间分异较大。
(5)住房社区性质在东南沿海和京津冀地区和山西、陕西北部形成了连绵的冷点地带,热点地区则相对分散在四川、安徽等地区。东南沿海地带、京津附近地区在城市的快速扩张中形成了较多的城中村、城乡结合部,这些地区还有较多跨省迁移人口,定居意愿相对偏低[21]。东南沿海的乡镇地区成为乡—乡流动人口的重要集聚地[25],有较多流动人口住在村委会社区。而四川、安徽等地区多为人口流出区,城市居委会社区的正规住宅能够满足流动人口的居住需求。
4 流动人口住房质量的影响因素分析
4.1 变量选择与回归分析
结合近年来国内外该领域的实证成果[10-12, 16, 26-32],本文从流动人口特征(内部因素)和流入地特征(外部因素)两个角度解释流动人口的住房质量[29, 31]。选取变量如表3所示。Tab. 3
表3
表3变量描述性统计
Tab. 3
| 类型 | 变量名称 | 变量描述 | 均值(标准差) |
|---|---|---|---|
| 房屋面积 | Area | 城市流动人口平均家庭住房建筑面积(m2) | 97.179(24.853) |
| 设施条件 | Facility | 住房内有独立使用的厨房的流动人口占比与住房内有独立使用的厕所的流动人口占比的乘积 | 0.717(0.191) |
| 建筑年代 | Buildage | 住房建成年代在2000年后的流动人口占比 | 0.585(0.118) |
| 社区性质 | Community | 社区性质为居委会的流动人口占比 | 0.749(0.224) |
| 户籍制度 | Crossprov | 流入地跨省迁移流动人口与总流动人口之比 | 0.389(0.239) |
| Rural | 流入地乡—城流动人口与总流动人口之比 | 0.844(0.095) | |
| 家庭人口 | Age | 流动人口平均年龄(岁) | 34.556(1.823) |
| Single | 从未结过婚的流动人口占比 | 0.196(0.091) | |
| Child | 流动人口平均子女数量(个) | 1.137(0.218) | |
| Family | 流动人口本地家庭成员数量与家庭总规模之比 | 0.852(0.084) | |
| 流动属性 | Purpose | 迁移目的为务工经商的流动人口占比 | 0.872(0.096) |
| Length | 流动人口平均停留时间(年) | 4.482(1.658) | |
| Stay | 拥有在流入地停留5年以上意愿的流动人口占比 | 0.563(0.158) | |
| 教育经济 | Education | 受教育水平在大专及以上的流动人口占比 | 0.117(0.073) |
| Job | 雇员流动人口占比 | 0.453(0.181) | |
| Security | 有社保的流动人口占比 | 0.209(0.130) | |
| lnIncome | 流动人口平均家庭月总收入(取对数) | 8.572(0.227) | |
| 住房特征 | Ownership | 流动人口住房自有率 | 0.194(0.168) |
| lnRentexp | 流动人口租户平均月租金支出(取对数) | 6.588(0.399) | |
| 人口 | lnPopulation | 流入地总人口(取对数) | 15.046(0.761) |
| Migrant | 流入地流动人口与总人口之比 | 0.091(0.119) | |
| 经济发展 | lnGDP | 流入地人均GDP(取对数) | 10.662(0.544) |
| Sector2 | 流入地第二产业占比 | 0.491(0.098) | |
| Sector3 | 流入地第三产业占比 | 0.386(0.091) | |
| lnPublic | 流入地人均公共财政支出(取对数) | 8.957(0.422) | |
| 房地产市场 | lnPrice | 流入地商品住宅平均售价(取对数) | 8.586(0.435) |
| lnRent | 流入地商品住宅平均租金(取对数) | 5.289(0.319) | |
| Land | 流入地居住用地面积与城镇建设用地总面积之比 | 0.322(0.085) | |
| lnInvest | 流入地地均商品住宅开发投资完成额(取对数) | 18.596(1.335) |
新窗口打开|下载CSV
首先构建传统OLS回归对各解释变量与被解释变量间的关系进行估计,在VIF检验中,所有变量的VIF值均小于6,平均VIF值为3.2,不存在多重共线性的问题。对OLS模型估计结果进行Lagrange Multiplier检验。对于Area、Buildage因变量,LM lag比LM error更显著,且Robust LM lag比Robust LM error更显著,说明SLM优于SEM;对于Facility因变量,LM error、Robust LM error比LM lag、Robust LM lag更显著,说明SEM优于SLM。而因变量为Community时,4项检验结果均不显著。因此,对于Area、Buildage因变量使用SLM进行回归,对于Facility因变量使用SEM进行回归,对于Community因变量使用OLS模型进行回归。
在Geoda平台下分别构建模型进行分析,将自变量分批逐步引入模型。首先,考察流入地本身的因素对流动人口住房质量的影响;其次,纳入城市流动人口的户籍属性和家庭人口变量;最后,进一步引入流动人口的流动属性、教育经济特征和住房相关因素进行分析。回归结果显示(表4),空间滞后系数λ及空间误差系数ρ均显著为正,说明中国城市流动人口的房屋面积和建筑年代存在显著且具有强烈的空间溢出效应,设施条件则存在相邻地区的误差冲击。
Tab. 4
表4
表4中国流动人口住房质量影响因素的模型估计结果
Tab. 4
| (1) 房屋面积 | (2) 设施条件 | (3) 建筑年代 | (4) 社区性质 | (5) 房屋面积 | (6) 设施条件 | (7) 建筑年代 | (8) 社区性质 | (9) 房屋面积 | (10) 设施条件 | (11) 建筑年代 | (12) 社区性质 | ||||||||||||
|---|---|---|---|---|---|---|---|---|---|---|---|---|---|---|---|---|---|---|---|---|---|---|---|
| Crossprov | -16.481*** | -0.184*** | -0.078** | -0.328*** | -21.724*** | -0.156** | -0.072* | -0.318*** | |||||||||||||||
| (5.682) | (0.054) | (0.036) | (0.063) | (6.707) | (0.062) | (0.042) | (0.069) | ||||||||||||||||
| Rural | -38.488*** | 0.014 | -0.057 | -0.588*** | -13.292 | 0.058 | 0.002 | -0.534*** | |||||||||||||||
| (13.526) | (0.121) | (0.087) | (0.154) | (18.198) | (0.157) | (0.118) | (0.193) | ||||||||||||||||
| Age | -3.837*** | 0.016** | -0.015*** | -0.005 | -2.573*** | 0.017** | -0.010 | 0.020** | |||||||||||||||
| (0.796) | (0.007) | (0.005) | (0.009) | (0.921) | (0.008) | (0.006) | (0.010) | ||||||||||||||||
| Single | 2.077 | 0.119 | 0.064 | -0.171 | 23.641 | 0.168 | 0.060 | 0.229 | |||||||||||||||
| (18.310) | (0.180) | (0.117) | (0.209) | (20.245) | (0.200) | (0.130) | (0.214) | ||||||||||||||||
| Child | 19.612** | -0.178** | 0.014 | -0.057 | 23.803*** | -0.182** | -0.005 | -0.176** | |||||||||||||||
| (8.177) | (0.084) | (0.052) | (0.093) | (8.395) | (0.088) | (0.054) | (0.088) | ||||||||||||||||
| Family | -77.287*** | 0.098 | -0.060 | 0.214 | -57.521*** | 0.090 | 0.000 | 0.133 | |||||||||||||||
| (15.481) | (0.141) | (0.098) | (0.175) | (18.480) | (0.162) | (0.119) | (0.196) | ||||||||||||||||
| Purpose | 25.092* | 0.229* | 0.202** | 0.128 | |||||||||||||||||||
| (13.989) | (0.126) | (0.090) | (0.148) | ||||||||||||||||||||
| Length | -1.110 | -0.010 | 0.002 | -0.015 | |||||||||||||||||||
| (0.913) | (0.008) | (0.006) | (0.010) | ||||||||||||||||||||
| Stay | -5.528 | 0.074 | 0.034 | 0.248** | |||||||||||||||||||
| (11.386) | (0.096) | (0.074) | (0.121) | ||||||||||||||||||||
| Education | 26.006 | 0.014 | 0.176 | -0.066 | |||||||||||||||||||
| (24.383) | (0.213) | (0.157) | (0.259) | ||||||||||||||||||||
| Job | -12.609 | -0.142* | -0.002 | -0.287*** | |||||||||||||||||||
| (9.666) | (0.086) | (0.062) | (0.102) | ||||||||||||||||||||
| Security | 26.831** | 0.110 | -0.076 | 0.066 | |||||||||||||||||||
| (13.346) | (0.115) | (0.086) | (0.141) | ||||||||||||||||||||
| lnIncome | 12.505* | -0.024 | -0.013 | 0.094 | |||||||||||||||||||
| (6.847) | (0.059) | (0.044) | (0.072) | ||||||||||||||||||||
| Ownership | 0.415 | 0.053 | -0.028 | -0.212* | |||||||||||||||||||
| (11.222) | (0.100) | (0.073) | (0.119) | ||||||||||||||||||||
| (1) 房屋面积 | (2) 设施条件 | (3) 建筑年代 | (4) 社区性质 | (5) 房屋面积 | (6) 设施条件 | (7) 建筑年代 | (8) 社区性质 | (9) 房屋面积 | (10) 设施条件 | (11) 建筑年代 | (12) 社区性质 | ||||||||||||
| lnRentexp | -3.425 | -0.047 | 0.042* | 0.122*** | |||||||||||||||||||
| (3.791) | (0.034) | (0.024) | (0.040) | ||||||||||||||||||||
| lnPopulation | -2.112 | -0.014 | 0.011 | 0.032 | -2.516 | -0.022 | 0.000 | -0.001 | -3.689* | -0.025 | -0.009 | -0.032 | |||||||||||
| (2.190) | (0.019) | (0.013) | (0.025) | (2.094) | (0.018) | (0.014) | (0.023) | (2.091) | (0.019) | (0.014) | (0.022) | ||||||||||||
| Migrant | -35.533** | -0.092 | 0.149* | -0.045 | -50.559*** | -0.015 | 0.112 | 0.179 | -63.468*** | -0.051 | 0.154 | 0.244 | |||||||||||
| (15.047) | (0.149) | (0.09) | (0.173) | (14.983) | (0.145) | (0.095) | (0.169) | (16.088) | (0.153) | (0.102) | (0.168) | ||||||||||||
| lnGDP | -1.734 | 0.085** | 0.011 | 0.000 | 6.963* | 0.053 | 0.027 | -0.060 | 8.401* | 0.072* | 0.020 | -0.021 | |||||||||||
| (4.188) | (0.041) | (0.026) | (0.049) | (4.199) | (0.040) | (0.027) | (0.048) | (4.288) | (0.041) | (0.028) | (0.045) | ||||||||||||
| Sector2 | -38.857 | -0.061 | -0.057 | -0.404 | -72.770*** | 0.031 | -0.161 | -0.158 | -80.689*** | -0.039 | -0.101 | -0.172 | |||||||||||
| (24.96) | (0.242) | (0.153) | (0.292) | (23.891) | (0.235) | (0.153) | (0.273) | (23.891) | (0.240) | (0.154) | (0.254) | ||||||||||||
| Sector3 | -52.515* | 0.072 | 0.145 | -0.711** | -58.003** | 0.190 | 0.118 | -0.407 | -62.054** | 0.170 | 0.164 | -0.385 | |||||||||||
| (27.429) | (0.262) | (0.168) | (0.320) | (25.718) | (0.252) | (0.165) | (0.293) | (25.433) | (0.254) | (0.164) | (0.269) | ||||||||||||
| lnPublic | -15.334*** | -0.110*** | 0.012 | 0.075 | -12.295*** | -0.115*** | 0.017 | 0.020 | -12.582*** | -0.118*** | 0.006 | -0.047 | |||||||||||
| (4.119) | (0.038) | (0.025) | (0.048) | (3.917) | (0.037) | (0.025) | (0.045) | (3.964) | (0.038) | (0.026) | (0.042) | ||||||||||||
| lnPrice | -3.200 | -0.005 | -0.093*** | -0.047 | -7.678 | 0.017 | -0.095*** | 0.009 | -7.853 | 0.016 | -0.102*** | 0.009 | |||||||||||
| (5.495) | (0.053) | (0.034) | (0.064) | (5.324) | (0.051) | (0.034) | (0.061) | (5.342) | (0.050) | (0.034) | (0.057) | ||||||||||||
| lnRent | 10.639 | 0.090 | 0.000 | -0.066 | 9.276 | 0.078 | 0.003 | -0.019 | 9.246 | 0.085 | 0.010 | -0.037 | |||||||||||
| (7.010) | (0.068) | (0.043) | (0.082) | (6.892) | (0.066) | (0.044) | (0.079) | (6.923) | (0.066) | (0.045) | (0.073) | ||||||||||||
| Land | 4.642 | 0.078 | -0.001 | 0.122 | 5.211 | 0.082 | 0.029 | 0.096 | 9.896 | 0.049 | 0.035 | 0.098 | |||||||||||
| (12.894) | (0.107) | (0.079) | (0.151) | (12.163) | (0.105) | (0.078) | (0.139) | (12.001) | (0.105) | (0.077) | (0.127) | ||||||||||||
| lnInvest | 0.519 | 0.004 | 0.001 | -0.005 | 0.142 | 0.004 | -0.001 | -0.005 | 0.019 | 0.005 | -0.002 | -0.009* | |||||||||||
| (0.466) | (0.004) | (0.003) | (0.005) | (0.439) | (0.004) | (0.003) | (0.005) | (0.437) | (0.004) | (0.003) | (0.005) | ||||||||||||
| λ | 0.339*** | 0.177*** | 0.252*** | 0.154** | 0.203*** | 0.150** | |||||||||||||||||
| (0.057) | (0.062) | (0.057) | (0.062) | (0.057) | (0.061) | ||||||||||||||||||
| ρ | 0.597*** | 0.578*** | 0.580*** | ||||||||||||||||||||
| (0.057) | (0.058) | (0.058) | |||||||||||||||||||||
| N | 275 | 275 | 275 | 275 | 275 | 275 | 275 | 275 | 275 | 275 | 275 | 275 | |||||||||||
| R2 | 0.451 | 0.388 | 0.094 | 0.109 | 0.535 | 0.446 | 0.155 | 0.298 | 0.564 | 0.461 | 0.200 | 0.452 | |||||||||||
新窗口打开|下载CSV
4.2 流入地流动人口属性的影响分析
户籍制度方面,省内流动人口、城—城流动人口占比越大,该城市流动人口住房质量越高。城市中省内流动人口占比越高,城市流动人口家庭住房面积越大,拥有独立使用的厨房和厕所的可能性越高,建筑越新,住在居委会社区的比例越大。城—城流动人口占比越大,则流动人口越可能居住在居委会社区。省内流动人口比跨省流动人口具有更强的城镇定居意愿[33],更愿意在流入地进行住房消费。乡—城流动人口比城—城流动人口社会经济地位更低、居留意愿更弱[34],在社区类型方面具有明显劣势,表明户口对乡—城流动人口获得社会保障造成了负面影响[33],迫使其压缩住房消费以应对未来的风险[35]。家庭人口方面,城市中流动人口年龄结构偏大时,住房面积更小,但设施条件更好,且居住在居委会社区的流动人口比例更高。结婚状况对流动人口的住房质量无显著影响。子女数量的增加则会显著增大居住的空间需求,但降低了设施条件水平,且增加了居住在村委会社区的流动人口比例。一同迁移的家庭成员比例越高,流动人口家庭住房面积平均值越小。
流动属性方面,出于家属随迁、婚姻嫁娶、投靠亲友、照顾父母或子女等目的而迁移的流动人口缺乏自主选择住房的能力,更可能居住在亲友提供的质量较差的住房中;而务工经商的流动人口则具备经济独立性,可以自由选择购买或租赁大面积、拥有独立厨卫的新建房屋。居留意愿能够促进流动人口居住在居委会社区。回归结果显示,城市中有在流入地长期定居意愿的流动人口占比越高,流动人口越可能住在居委会社区。居留意愿强烈的流动人口往往具有较高社会融入水平,其心理身份认同和生活方式与本地居民更加趋同,因而更愿意居住在城市公共设施配套更为完善的居委会社区。
教育经济方面,城市中雇员占比越高,住房中拥有独立厨卫设施的流动人口比例越低,居住在村委会社区的流动人口比例越大。有社保的流动人口比例越大,流动人口的收入越高,家庭住房面积越大。与雇主和自营劳动者相比,雇员的经济自主性往往更低,就业稳定性也更差。对这部分群体而言,设施条件较差的城中村住房不仅价格低廉,而且与正规的居委会社区相比,其租房市场具有更高灵活性。社保缺失的流动人口倾向于选择面积较小的住房以减少当期支出。收入水平的上升能够显著改善流动人口家庭的居住面积,但对设施条件、建筑年代和社区性质则无显著影响,可见流动人口在预算条件约束下优先偏好改善居住面积。
住房特征方面,流动人口住房自有率和租户租金支出是影响城市流动人口住房质量的重要因素。城市流动人口自有住房率越高,居住在村委会社区的流动人口比例越大;而流动人口租户的租金支出的增加能显著提高其居住在新建住房、居委会社区的可能性。流动人口的住房自有率对居住在村委会社区比例的促进作用表明购买小产权房是外来业主在流入地拥有自有住房的重要渠道[36]。2014年的CMDS数据显示流动人口中70.8%为租户,租户较高的月平均租金支出意味着较高的住房消费水平,流动人口更可能住在质量更好的新建成的居委会社区中。
4.3 流入地规模和市场的影响分析
流入地规模方面考虑人口规模和经济规模对流动人口住房质量的影响。从人口规模来看,城市总人口和流动人口占比均对流动人口住房面积具有负面影响。城市人口总量越大,流动人口占总人口的比例越大,则流动人口的平均家庭住房面积越小。城市人口总量越大则住房需求量也就越大,流动人口占比越高则流动人口间的住房竞争越激烈,在此情况下有较大比例的流动人口只能选择与他人合住,居住空间相对更加拥挤。从经济规模来看,人均GDP、第二、三产业占比和人均公共财政支出显著影响流动人口家庭住房面积和设施条件。城市人口GDP越高,流动人口家庭住房面积越大,设施条件越好;第二、三产业占比越大,流动人口家庭住房面积越小;人均公共财政支出对家庭住房面积和设施条件均存在负面影响。经济发达城市的流动人口收入水平更高,足以负担大面积住房的花费。在第二产业发达的城市,大量流动人口在制造业、建筑业工作,更可能在单位或雇主提供的住房中居住[37],空间狭窄。第三产业从业人员在位于城市核心的商业区和办公区工作,需要在周边租赁价格较高的住房而牺牲居住面积。较高的公共财政支出提升了城市的公共服务水平和住房吸引力,处于住房市场较低层次的流动人口可获得的住房面积相对较小,设施配置不足。
就房地产市场而言,住房售价和供给分别对流动人口住房质量的不同方面产生影响。住房售价越高,流动人口越可能居住在建成年代较早的住房中,而住房租金则无显著作用;商品住房开发投资完成额越高,居住在村委会社区的比例越大。根据经济学供求理论,当价格上涨时,人们会相应地减少消费量,住房售价越高,则愿意且能够购买商品房的流动人口越少,更大比例的流动人口选择租住老城区和城中村等地的老旧房屋。令人意外的是,流入城市地均商品住宅开发投资额的增加反而使更多流动人口选择村委会社区。可能的解释是当新开发的商品住宅位于城市郊区时,不是流动人口的选择;而一些通过城市更新开发的商品住宅虽位于城市中心,但其带来了房价上涨和绅士化效应[38],将原来居住在老城区的流动人口挤出,到住房较廉价的城中村、城乡结合部居住。
4.4 不同规模城市的影响及其异质性
除上述流入地人口、经济和房地产市场的影响外,流动人口的住房选择是还在特定的制度背景中做出的。在落户较高的流入地,流动人口面临更强的排斥,也更容易产生“过客心理”;反之,流动人口更可能实现社会融入,在流入地安定下来。从而这两类城市中流动人口的住房选择偏好各异,影响其住房质量的因素也就有所不同。根据《国家新型城镇化规划(2014—2020)》,城区常住人口小于100万的中小城市的落户限制被放开,而大城市、特大城市和超大城市的落户门槛则仍然存在。因此本文将所有地级市划分为中小城市、大城市两类,分别进行回归。参照连玉君等[39]的做法,采用基于似无相关模型(Seemingly Unrelated Regression, SUR)的检验估计组间系数差异(表5)。Tab. 5
表5
表5中国流动人口住房质量影响因素的模型估计结果:不同规模城市间的异质性作用
Tab. 5
| 房屋面积 | 设施条件 | 建筑年代 | 社区性质 | ||||||||||||
|---|---|---|---|---|---|---|---|---|---|---|---|---|---|---|---|
| (1) 中小城市 | (2) 大城市 | 组间系数差异 SUR检验 | (3) 中小城市 | (4) 大城市 | 组间系数差异 SUR检验 | (5) 中小城市 | (6) 大城市 | 组间系数差异 SUR检验 | (7) 中小城市 | (8) 大城市 | 组间系数差异 SUR检验 | ||||
| Ownership | -11.025 | 0.949 | -11.973 | 0.042 | 0.315 | -0.272 | -0.079 | 0.076 | -0.155 | -0.188 | -0.803* | 0.616 | |||
| (14.430) | (24.515) | (0.130) | (0.344) | (0.089) | (0.216) | (0.128) | (0.420) | ||||||||
| lnRentexp | -6.413 | 9.865 | -16.278** | -0.038 | 0.171 | -0.209** | 0.025 | 0.196** | -0.170*** | 0.149*** | 0.134 | 0.015 | |||
| (4.983) | (8.224) | (0.045) | (0.115) | (0.031) | (0.073) | (0.044) | (0.141) | ||||||||
| lnPopulation | -4.321 | 4.893* | -9.214** | -0.059* | 0.030 | -0.089** | -0.016 | 0.032 | -0.049* | -0.030 | 0.005 | -0.035 | |||
| (3.447) | (2.875) | (0.031) | (0.040) | (0.021) | (0.025) | (0.031) | (0.049) | ||||||||
| Migrant | -50.785 | -69.371*** | 18.586 | -0.330 | -0.355 | 0.025 | 0.347 | 0.054 | 0.293 | 0.653** | 0.063 | 0.590 | |||
| (36.403) | (17.248) | (0.327) | (0.242) | (0.225) | (0.152) | (0.324) | (0.295) | ||||||||
| lnGDP | 8.288 | 0.496 | 7.792 | 0.094* | 0.000 | 0.094 | 0.028 | -0.084 | 0.112** | 0.029 | -0.120 | 0.149 | |||
| (5.887) | (6.126) | (0.053) | (0.086) | (0.036) | (0.054) | (0.052) | (0.105) | ||||||||
| Sector2 | -100.477*** | 32.050 | -132.527** | -0.103 | 1.233 | -1.336** | -0.309 | 0.979** | -1.289*** | -0.332 | 0.040 | -0.372 | |||
| (31.572) | (54.407) | (0.283) | (0.764) | (0.196) | (0.480) | (0.281) | (0.932) | ||||||||
| Sector3 | -90.245** | 39.463 | -129.708** | 0.478 | 1.024 | -0.546 | -0.139 | 1.034** | -1.173*** | -0.682** | 0.208 | -0.890 | |||
| (36.797) | (53.789) | (0.330) | (0.755) | (0.228) | (0.475) | (0.327) | (0.921) | ||||||||
| lnPublic | -18.466*** | 4.272 | -22.738*** | -0.205*** | -0.047 | -0.158* | -0.030 | 0.087 | -0.117** | -0.094* | 0.054 | -0.147* | |||
| (5.751) | (6.632) | (0.052) | (0.093) | (0.036) | (0.059) | (0.051) | (0.114) | ||||||||
| lnPrice | -11.516 | 0.008 | -11.524 | -0.074 | 0.138 | -0.213** | -0.118** | -0.028 | -0.090 | -0.059 | 0.256* | -0.315*** | |||
| (7.556) | (7.468) | (0.068) | (0.105) | (0.047) | (0.066) | (0.067) | (0.128) | ||||||||
| lnRent | 13.241 | -25.951** | 39.192*** | 0.276*** | -0.136 | 0.412*** | -0.029 | -0.083 | 0.054 | -0.058 | -0.442** | 0.384** | |||
| (9.175) | (11.850) | (0.082) | (0.166) | (0.057) | (0.105) | (0.082) | (0.203) | ||||||||
| Land | 17.506 | 21.777 | -4.271 | -0.014 | 0.059 | -0.074 | -0.034 | 0.108 | -0.142 | 0.007 | 0.256 | -0.249 | |||
| (16.003) | (24.525) | (0.144) | (0.344) | (0.099) | (0.216) | (0.142) | (0.420) | ||||||||
| lnInvest | 1.323 | -2.114 | 3.437 | 0.003 | -0.012 | 0.016 | -0.011 | 0.030 | -0.041** | -0.036*** | -0.076 | 0.040 | |||
| (1.140) | (2.721) | (0.010) | (0.038) | (0.007) | (0.024) | (0.010) | (0.047) | ||||||||
| N | 204 | 66 | 204 | 66 | 204 | 66 | 204 | 66 | 204 | ||||||
| R2 | 0.481 | 0.818 | 0.314 | 0.656 | 0.176 | 0.641 | 0.479 | 0.678 | 0.481 | ||||||
新窗口打开|下载CSV
户籍制度的“内外之别”与“城乡差分”在中小城市和大城市有不同的作用表现,省内迁移的流动人口占比只对中小城市流动人口住房面积、设施条件和社区类型具有积极影响;乡—城流动人口比例的提升将减少流动人口居住在村委会社区的比例,但对大城市的作用程度更强。这表明省内流动人口的住房优势主要存在于中小城市,而乡—城流动人口在大城市处于更加弱势的地位。流动人口年龄、子女数量对住房质量的影响主要发生在中小城市。
迁移原因、迁移时长和定居意愿主要影响大城市流动人口的住房状况,这表明在落户难度高的大城市,“过客心理”是流动人口住房状况的重要决定因素。流动人口整体学历和收入水平的提升不会推动住房设施条件、建筑年代和社区类型的改善,尤其是在大城市,高学历和高收入的流动人口的集聚加大了住房竞争,反而使得流动人口整体居住在村委会社区的比例增加,住房设施条件变差。社保拥有率的提高促进了大城市流动人口住房设施条件改善,但对中小城市并不显著。这是因为获得社保有利于流动人口达到大城市的落户门槛,减少了不确定性和风险,从而增强了其住房消费意愿。月租金支出的提升分别推动了大城市流动人口住房建筑年代的改善和小城市居住社区类型的改善。
流入地总人口的增加使得大城市流动人口住房面积增加而中小城市流动人口住房设施条件变差。第二、三产业占比提升降低了中小城市流动人口的住房面积,但使得大城市流动人口住房建筑年代更新。在公共财政支出较高的中小城市,流动人口整体的住房条件更差。较高的房租水平使得大城市流动人口住房面积更小,居住在村委会社区的比例更大,但使得小城市流动人口的住房设施条件改善。
5 结论与讨论
本文基于2015年全国1%人口抽样调查和2014年的流动人口动态监测调查(CMDS)数据,分析了中国流动人口住房质量的空间分布格局及其影响因素,并重点考察了城市流动人口特征、人口、经济和房地产市场因素对流动人口住房质量的影响。研究发现:(1)根据房屋面积、设施条件、建筑年代和社区性质衡量流动人口的住房质量,中国城市流动人口住房质量的整体水平并不低。2014年中国流动人口家庭居住面积约为98 m2,住房内有独立使用的厨房和厕所的流动人口家庭占比分别为86.2%和81.6%,有69.9%的流动人口居住在居委会社区,居住在2000年以后建成的房屋的流动人口占比为58.4%。
(2)中国城市流动人口的住房质量的空间差异明显,存在城市等级、城市规模与东、中、西和西北四大地区的分异。从空间分布上看,房屋面积南高北低,设施条件东高西低,建筑年代以省内城市间差异为主,社区性质除东南沿海、京津冀和山西、陕西外,多以居委会社区为主。从城市等级来看,直辖市流动人口住房质量最差,副省级城市、省会城市和其他城市在住房质量的四个维度各有优劣。从城市规模来看,随着规模等级增大,房屋面积和社区性质呈现非对称倒“U”型模式,设施条件改善,建筑年代分布相对均衡。从地理分区来看,中部地区流动人口整体住房质量最高。
(3)中国城市流动人口住房质量呈现出显著的空间自相关,但各指标高、低值集聚区的分布格局存在一定差异。房屋面积热点区主要分布在西南和中部地区,冷点区分布在珠三角、长三角以及北方的内蒙古和黑龙江部分城市。住房设施条件在中南部以及四川、山东部分城市形成了高值集聚区,而在西部的云南、青海、甘肃,内蒙古北部、宁夏、陕西、黑龙江和浙江的部分城市则形成了低值分布带。建筑年代的空间集聚程度相对较低,热点地区分散在西部的宁夏、青海和新疆的部分城市,冷点地区则分散在东部的长三角以及东北的黑龙江部分地区。住房社区性质在东南沿海和京津冀、山西和陕西北部地区形成了两大连绵的低值分布带,热点地区相对分散在四川和安徽的部分城市。
(4)流动人口群体类型影响了城市流动人口住房质量的整体水平,但各因素对住房质量4个指标的影响方向并不完全一致。省内流动人口在住房质量的各个方面均优于跨省流动人口,而城—城流动人口比乡—城流动人口在社区性质方面更具有优势。居留意愿与居住在居委会社区的比例显著正相关。流动人口平均年龄越大,住房面积越小,但设施条件越好,且越可能居住在居委会社区;流动人口子女数量越多,住房面积越大,但厨卫独立性越低,居住在村委会社区的比例更高;随着流动人口家庭化迁移程度提高,家庭平均居住面积将明显减少;以务工经商为目的的流动人口占比越高,居住在大面积、拥有独立厨卫的新建房屋的比例越大。稳定的就业状态有利于促使流动人口居住在设施完善的居委会社区,而拥有社保和较高的收入则能有效提升流动人口的住房面积。
(5)城市人口、经济和房地产市场因素对流动人口的住房质量具有显著影响,但分别作用于不同的方面。城市总人口数量的增加和流动人口占比增大使各流动人口家庭居住空间更加拥挤。城市经济发展水平对住房面积和设施条件具有积极影响,而人均公共财政支出则对这两个指标具有消极影响,第二、三产业占比越大的城市流动人口家庭住房面积越小。高房价将阻碍流动人口居住在新建成的房屋中;城市商品住房开发投资增高迫使流动人口选择城中村、城乡结合部等村委会社区作为居住场所。
(6)中小城市和大城市流动人口住房质量的决定因素及作用强度不尽相同。内部因素层面:省内迁移的流动人口占比只对中小城市流动人口住房条件具有积极影响;乡—城流动人口比例对大城市流动人口社区类型的作用更强;流动人口年龄、子女数量对住房质量的影响主要发生在中小城市;迁移原因、迁移时长和定居意愿主要影响大城市流动人口的住房状况;高学历和高收入的流动人口在大城市的集聚加大了住房竞争,反而使得流动人口住房设施条件变差;社保拥有率的提高促进了大城市流动人口住房设施条件改善,但对中小城市并不显著;月租金支出的提升分别推动了大城市流动人口住房建筑年代的改善和小城市居住社区类型的改善。外部因素层面:流入地总人口增加使大城市流动人口住房面积增加而中小城市流动人口住房设施条件变差;第二、三产业占比提升降低了中小城市流动人口的住房面积,但使大城市流动人口住房建筑年代更新;公共财政支出较高的中小城市流动人口整体住房条件更差;较高的房租水平使大城市流动人口住房面积更小,居住在村委会社区占比更大,但使小城市流动人口的住房设施条件改善。
本文结论对于全国及地方制定面向流动人口的住房政策具有一定的启示性:① 流动人口的住房质量存在明显的地区分异,政府在分配保障性财政转移支付时应对此予以充分考虑。当前中央财政保障性转移支付的补助重点在中西部财政困难地区,这与人口流动规律相背[40]。中西部地区流动人口住房质量不是最低的,反而在东部沿海,尤其是京津冀、长三角和珠三角等经济较发达地区在住房面积、设施条件和社区性质的一个或多个方面存在明显的低值集聚。这些地区流动人口密集,地方政府大规模改善流动人口住房质量的动力和能力有限,需要中央政府提供资金支持和政策激励。因此要建立面向流动人口住房保障的中央财政转移支付制度,缩小地区间流动人口住房水平差异,并激励地方政府加大对流动人口的住房保障投入。② 各地在流动人口住房质量的不同维度各有优劣势,应因地制宜,明确各自的政策重点。如东部地区、超大城市和特大城市重在改善流动人口居住的邻里环境,在城中村改造中充分考虑流动人口的居住需求,为其提供可支付的正规住房;西部地区、中小城市应提高城市住房建设水平,为流动人口提供住房设施完善的健康住房;东北地区则需要推进存量住房更新改造、提高住房品质,缓解流动人口居住拥挤的问题。③ 流动人口的住房质量具有群体差异,城市政府应针对当地流动人口的群体特征,满足流动人口多层次的住房需求,如对于跨省流动人口、乡—城流动人口比例大,流动人口平均居住时间短,流动性强的城市,可以在流动人口聚居区建设一批价格低廉但符合基本安全卫生标准,设施相对完善,能够满足流动人口健康生活需要的简易住房,简化租房手续,鼓励流动人口租住,改善其居住条件;而对于省内流动人口、城—城流动人口比例大,流动人口平均居住时间长,定居意愿强烈的城市,应加大商品住房的供给,并通过政策优惠降低流动人口购买、租住高质量住房的门槛。
参考文献 原文顺序
文献年度倒序
文中引用次数倒序
被引期刊影响因子
[本文引用: 1]
URL [本文引用: 1]
[本文引用: 1]
[本文引用: 1]
[本文引用: 2]
[本文引用: 2]
DOI:10.11821/dlyj201405008 [本文引用: 5]

China's rapid urbanization and economic development have given rise to the fast growth of the floating population, and housing is a key issue in the process of their integration into the destination cities. This paper intends to explore this topic by analyzing the spatial patterns of housing conditions of the floating population. Based on the sixth census data, the paper selects six indicators to measure housing conditions of the floating population: the home-ownership rate, the rental-housing rate, the floor area index, the housing facilities index (constructed by summing up the situation of five variables: availability of running water, washroom, bathroom, kitchen, and the type of fuel), the index of privacy (constructed by summing up the situation of two variables: the function of the dwelling and the number of the dwelling's floors), and the housing consumption index. It uses the methods of Spatial Autocorrelation Analysis and Hierarchical Cluster to examine the spatial distribution and agglomeration patterns of the floating population's housing conditions. The results of the calculation show that compared with urban permanent residents, members of the floating population are much more likely to live in rental homes;their housing conditions are generally worse;and their rental expenses are higher. The spatial variation of the homeownership rate, the rental-housing rate, and the housing facilities index is mainly manifested as north-south differences;the floor area index, and the index of privacy show marked difference between eastern and western China. The low-value centers of the housing consumption index are located in Inner Mongolia, Shaanxi, Hubei and Anhui provinces, while the high-value centers are located in Beijing. Furthermore the results of Spatial Autocorrelation Analysis demonstrate that there is a significant positive spatial correlation in the indicators of the floating population's housing conditions on a national scale, and identify the phenomenon of their spatial clustering and the centers of such spatial clustering. The analysis of Hierarchical Clustering identifies the housing conditions of the floating population into four distinctive groups, and suggests that the housing conditions of the floating population in the inner and east parts of China are better than those in the outer and west parts, and such a spatial variation extends from the north to the south. Finally, on the basis of the above findings, the paper puts forward some policy suggestions for improving the housing conditions of the floating population.
[本文引用: 5]
[本文引用: 2]
[本文引用: 2]
[本文引用: 1]
DOI:10.1177/0042098019836918URL [本文引用: 1]
[本文引用: 1]
[本文引用: 1]
[本文引用: 1]
[本文引用: 1]
[D].
[本文引用: 3]
[D].
[本文引用: 3]
[本文引用: 5]
[本文引用: 5]
DOI:10.11821/xb201202005 [本文引用: 5]
With a database based on 3168 copies of questionnaires collected from six Chinese cities of Guangzhou, Dongguan, Shenyang, Chengdu, Hangzhou and Zhengzhou, this study examines housing conditions, patterns and determinants of second-generation migrants of urban China. With a series of quantitative analysis, it is found that three types of Chinese new migrants, labor migrants, intellectual migrants, and investor migrants have different housing conditions. For instance, the average housing area of new migrants is about 20.69 sq. m., while that of the intellectual migrants is the biggest (24.87 sq. m.) and that of the labor migrants is the smallest (16.26 sq. m.). In terms of the quality of housing facilities, the score of the facility index for the new migrants in general is by no means high, about 0.35. Moreover, investor migrants hold the best facilities, while labor migrants hold the worst, and intellectual migrants is in between. It is indicated that housing conditions of new migrants are largely differentiated. Second, after three decades of market reform, housing conditions and patterns of new migrants are still mainly determined by institutional factors such as hukou. In addition, housing facility qualities are mainly influenced by such factors as hukou status, income, educational background, marriage, age and migrant types, and hukou is the major determinant for the housing facility quality of second generation migrants.
[本文引用: 5]
DOI:10.11821/dlyj201704003 [本文引用: 3]
Nowadays family migration has become the main migration pattern of floating population in China, which may raise new requirements for residential independence, tenure and quality in the cities. For some researchers, the migrant households were generally considered as passive recipients of housing inequality, and the institutional barrier of Hukou were no doubt still the decisive factors for migrants' housing outcomes. However, other researchers start to challenge this perspective, and argue that migrants should be considered as enabling agents with coping strategies in the housing market since the influence of Hukou system in migrants' housing outcomes is declining. Under this context, this paper tries to explore the role of family strategy in family migrants' housing outcomes, and whether this conclusion differentiates among various households. Based on a questionnaire survey which covered 2394 migrants and their households in 12 cities of the Bohai Rim Region, the Yangtze River Delta Region, the Pearl River Delta Region, and the Chengdu-Chongqing Region, this paper uses logistic regression model to explore family migrants' urban housing outcome in terms of housing tenure and quality and the mechanism for this. The result shows, different household arrangements lead to diversification of housing outcome, which means that the ownership and housing quality differs significantly among sole migrants, couple migrants, two-generation migrants, and three-generation migrants. The three-generation migrant households, as expected, have the highest ownership percentage and residential quality among all types of migrant households, while the sole and couple migrants suffer from the poor residential conditions. This housing outcome should be explained by factors such as socio-economic characteristics, household arrangements, geographic environment, migrants' connection with the original hometown and adaptation to current destination. Especially, when considering the effect of migrants' sense of belonging, plan to settle down in the destination and connection with hometown, the effect of Hukou is weakened. Different household arrangements have different barriers and strategies, which leads to the divergence of housing outcomes. The implication from this research is that the governments should make gradient regulation policy for the diverse family migrants, and lead them to settle stably step by step.
[本文引用: 3]
DOI:10.1080/02673037.2017.1351924URL [本文引用: 2]
[本文引用: 6]
[本文引用: 6]
[本文引用: 5]
[本文引用: 5]
[本文引用: 3]
[本文引用: 3]
[本文引用: 6]
[本文引用: 6]
[D].
[本文引用: 5]
[D].
[本文引用: 5]
[D].
[本文引用: 1]
[D].
[本文引用: 1]
DOI:10.11821/dlxb201504005 [本文引用: 5]
China has witnessed unprecedented urbanization over the past decades. The rapid expansion of urban population has been dominated by the floating population from rural areas, of which the spatiotemporal patterns, driving forces, and multidimensional effects have been scrutinized and evaluated by voluminous empirical studies. However, the urban and economic development mode has been reshaped by the globalization and marketization processes and the socioeconomic space has been restructured as a consequence. How has the spatial pattern of floating population evolved against these backdrops? How has the evolution been driven by the interaction of state and market forces? What have been the contribution of population mobility to the urbanization of origin and destination regions and the evolution of China's urban system? The latest national censuses conducted in 2000 and 2010 offer the opportunity to systematically answer these questions. Analysis based on the county-level data comes to conclusions as follows. (1) The spatial pattern of floating population remained stable over the first decade of the 21st century. Three coastal mega-city regions, namely the Yangtze River Delta, the Pearl River Delta, and the Beijing-Tianjin-Hebei Region, were major concentration areas. As the emergence and rapid development of other coastal mega-city regions, the coastal concentration area of floating population tended to geographically united as a whole, whereas the spatial distribution within each region variegated significantly. (2) Floating population gradually moved into provincial capitals and other big cities in interior regions and its distribution center of gravity moved northward around 110 km during the study period. (3) Compared with extensively investigated inter-provincial migrants, intra-provincial migrants had higher intention and ability to permanently live in cities they worked in and thus might become the main force of China's urbanization in the coming decades. (4) The spatial pattern of floating population was shaped jointly by the state and market forces in transitional China. While the impacts of state forces have been surpassed by market forces in the country as a whole, they are still important in shaping the development space of central and western China. (5) The massive mobility of population contributed a large proportion to the increase of urbanization levels of both origin and destination regions and reshaped China's urban system in terms of its hierarchical organization and spatial structure.
[本文引用: 5]
[本文引用: 4]
[本文引用: 4]
[本文引用: 2]
[本文引用: 2]
[本文引用: 1]
[本文引用: 1]
[本文引用: 2]
[本文引用: 2]
[本文引用: 4]
[本文引用: 4]
[D].
[D].
DOI:10.11821/dlxb201610003 [本文引用: 2]
Based on data from the 2012 national migrant population dynamic monitoring survey and related statistics, this article examines the spatial pattern and its determinants of migrants' intention of hukou transfer of China's 276 prefecture- and provincial-level cities, using GIS spatial analysis and statistical modelling. The results show that the overall level of migrants' hukou transfer intention of the cities is not high, and varies significantly among different cities. The intention of migrants' hukou transfer increases as the administrative level and/or the size of their destination cities increase. Meanwhile, migrants' hukou transfer intention is generally higher in coastal mega-city regions than in other cities, but it is also relatively high in some provincial capital cities and small and medium-sized cities in some inland regions with good transport location and resource endowment. The spatial pattern of migrants' intention of hukou transfer is shaped jointly by both the characteristics of the destination cities and migrants themselves characteristics, with the former exerting more influence than the latter. High level of socioeconomic development and good location of the destination cities can effectively promote their migrants' intention of hukou transfer; however, their level of basic public services does not have the same effect. The degree of migrants' social integration in the destination cities also exerts positive effects on their hukou transfer intention. However, having medical insurance, the concentration in the secondary labor market and higher household income are negatively related to such intention; furthermore, the individual and family characteristics of migrants do not have a significant impact on it. Finally, on the basis of the above findings, we put forward some suggestions for relevant policy making.
[本文引用: 2]
DOI:10.11821/dlyj020180473 [本文引用: 1]
In China, population migration has an influence on the level of economic and social development in various regions. In 2016, the scale of migrant population reached 245 million, which became an important factor affecting population changes. From the perspective of migrant populations' destinations, with the control of population scale in some big cities in China, and the sustained economic growth in the central and western regions, the problem of population reflux is attracting more and more attention from the society. The spatial differentiation and influencing factors of migrant populations' return intention are vital issues which are urgent to be investigated. Based on data from the 2016 China Migrant Population Dynamic Survey (CMDS), this paper discusses the phenomenon about spatial differentiation of migrant populations' return intention in 279 prefecture and provincial level cities in China, using GIS spatial analysis methods such as Moran's I coefficient, Getis-Ord Gi *. Besides, we investigate the influencing factors of migrant populations' return intention. Study comes to the following conclusions: (1) Compared with the residence intention and hukou transfer intention, the return intention of migrant population in China is lower (6.17%), and the majority of migrants (74.05%) are eager to take their own home towns as refluxing destination. The scale of cities, the level of cities and the return intention of migrant population present an asymmetric "U"-shaped pattern. (2) The spatial distribution of return intention presents an aggregation pattern with marked spatial differentiation. The return intention of migrant population in Yangtze River Delta Urban Agglomeration, Beijing-Tianjin-Hebei Urban Agglomeration and Zhongyuan Urban Agglomeration is higher than that in Chengdu-Chongqing Urban Agglomeration and Harbin-Changchun Urban Agglomeration. Among the four main geographical divisions, the return intention of urban floating population in the eastern region is the highest while that of the northeast region is the lowest. South China, central-south China and part of East China are hot spots of return intention while Northeast and North China are in a weak corner. (3) The return intention is influenced by both internal factors of migrant population and external factors of in-flow area. Educational level and economic development are both internal and external factors that simultaneously play different roles in return intention. (4) Family connection, social networks, housing and economic factors of migrant population are main forces that shape the spatial pattern of return intention. Family scale in in-flow area and home-ownership rates inhibit return intention while variables such as family scale in non-in-flow area, migrant times and the family's income and expenditure proportion exert a positive influence on return intention. Based on the above conclusions, this paper proposes strategies for relevant departments on the management of migrant population.
[本文引用: 1]
DOI:10.11821/dlxb202002003 [本文引用: 3]
It is demonstrated that the determinants of China's urban floating population's settlement intention are different among geographic units, which seems to be ignored by previous researches. Based on the data from the 2015 national migrant population dynamic monitoring survey (CMDS) and related statistics, this article uses the Semiparametric Geographically Weighted Regression (SGWR) model and k-means cluster method to examine the spatial variation of the factors influencing floating population's settlement intention in 282 prefecture- and provincial- level cites of China. Results provide the following conclusions. (1) The settlement intention of urban floating population is mainly influenced by the floating population characteristics instead of the destination characteristics. (2) Social and economic factors are closely related to the floating population's settlement intention. Meanwhile, the demographic, family and mobility factors exert a significant impact on such an intention. To be specific, there exists an inhibitory effect on floating population's settlement intention in factors such as income, marriage, and cross provincial mobility. However, housing expenditure, participation rate, number of children and other factors can effectively contribute to such intention. (3) Zonal spatial differentiation patterns of the influencing factors' coefficients are illustrated by the SGWR model, which can be further divided into four categories ("E-W", "N-S", "NE-SW" and "SE-NW"): The positive influences of ethnic and family factors are decreasing from the northern to southern regions, while the influence of employment ratio in the secondary industry is declining from the northwest to the southeast regions, and the impacts of factors such as the number of children and per capita GDP are diminishing from the northeast to the southwest regions. In eastern developed areas, the settlement intention of floating population with higher income is comparatively lower, while migrants with higher housing expenditure in southern China have a stronger intention to settle down. (4) Four influencing zones are detected by the k-means method: Floating population's settlement intention in North China, Central China and East China is significantly affected by multiple factors; In the northwest region and part of the southwest region, migrants' settlement intention is mainly influenced by demographic and social factors; The northeast region and the eastern part of Inner Mongolia's floating population's willingness to stay is mainly related to economic and family factors; Apart from housing expenditure, coefficients of other factors are relatively small in southern China and part of the central, eastern and southwestern regions. Additionally, this paper puts forward some suggestions on the service and management of the floating population in China.
[本文引用: 3]
[本文引用: 2]
[本文引用: 2]
[本文引用: 1]
[本文引用: 1]
DOI:10.1016/j.chieco.2017.11.005URL [本文引用: 1]
DOI:10.1016/j.habitatint.2014.07.013URL [本文引用: 1]
[本文引用: 1]
[本文引用: 1]
[本文引用: 1]
[本文引用: 1]
[本文引用: 1]
[本文引用: 1]
[本文引用: 1]
[本文引用: 1]
