 ,1,2,3, 何坚坚1, 张佳琪1
Analysis of the Bole-Taipei Line as the divide for regional coordinated development: Evidence from greenhouse gas emissions of Chinese cities
FANG Kai,1,2,3, HE Jianjian1, ZHANG Jiaqi1收稿日期:2020-11-16修回日期:2021-07-15
| 基金资助: |
Received:2020-11-16Revised:2021-07-15
| Fund supported: |
作者简介 About authors
方恺(1986-), 男, 浙江杭州人, 博士, 研究员, 博士生导师, 中国地理学会会员(S110010745M), 主要从事环境管理与区域可持续发展研究。E-mail:

摘要
关键词:
Abstract
Keywords:
PDF (5440KB)元数据多维度评价相关文章导出EndNote|Ris|Bibtex收藏本文
本文引用格式
方恺, 何坚坚, 张佳琪. 博台线作为中国区域发展均衡线的佐证分析——以城市温室气体排放为例. 地理学报, 2021, 76(12): 3090-3102 doi:10.11821/dlxb202112015
FANG Kai, HE Jianjian, ZHANG Jiaqi.
1 引言
缓解区域发展矛盾,缩小区域发展差距,实现区域协调发展,既是中国经济社会和谐发展的长期目标,也是国家重大战略之一[1]。西部大开发、东北全面振兴、中部地区崛起、京津冀协同发展、长三角一体化发展等方针政策的实施对于缩小区域差距,实现高质量发展具有重要作用[2]。同时也应看到,由于资源环境的约束和发展模式的差异,中国经济社会发展水平总体以“胡焕庸线”为界呈现东南部相对发达而西北部相对落后的空间格局[3]。胡焕庸线是中国地理学家胡焕庸发现的一条连接黑龙江黑河和云南腾冲的中国人口分布的特征线[4],这条线以东地区仅占国土面积的43%,却聚集着中国约94%的人口和95%的GDP[5]。如何突破胡焕庸线成为****和决策者们共同关注的热点问题[6,7]。鉴于此,有必要识别出一条新的能表征中国区域发展格局的标志线,并以此为主轴串联起经济社会发展的各个分区,推动国家朝着更平衡、更协调的方向发展。在此背景下,方创琳于2020年2月提出了一条垂直于胡焕庸线、连接新疆博乐市和台湾台北市的“博台线”[8]。通过对博台线西南半壁与东北半壁各项主要经济社会指标的计算发现,博台线两侧国土面积、人口、经济总量、人均GDP、人口密度、经济密度和城镇化水平占比均趋向1:1的均衡发展格局,因此博台线可以作为支撑中国区域均衡发展的战略主轴线[8],为破解胡焕庸线、缩小地区差距提供了新思路,具有重要的科学价值和现实意义。当前,相关研究多集中于从人口分布、经济增长和城镇化进程等视角评估中国各区域间的均衡程度[9,10]。随着气候变化问题日益凸显,联合国政府间气候变化专门委员会(IPCC)第五次评估报告指出,由于全球气候变暖导致的极端天气增多、海平面上升、生物多样性减少、粮食安全问题等将对人类生存和发展产生严重和不可逆转的后果[11]。相关研究表明,过去百年来人类活动所产生的温室气体排放被认为是引起全球变暖的主要原因[12,13]。由此可见,温室气体排放量在很大程度上反映了人类经济社会活动的强度水平[14]。随着中国工业化、城镇化进程不断加快,温室气体排放连续数十年显著增长[15,16,17]。以温室气体排放水平表征中国经济社会发展程度,并对其空间分布的均衡性进行分析,对于科学研判区域协调均衡发展态势、助推绿色低碳转型具有重要意义。
不少****基于不同空间尺度分析了二氧化碳(CO2)排放的分异特征[18,19,20]。城市作为人类经济社会活动的主要载体,其排放的温室气体约占全部人为排放量的85%[21],因而近年来城市尺度的碳排放公平性成为研究热点之一[22,23]。杨青林等对中国城市尺度的CO2排放进行了分析,发现中国城市CO2排放在空间上呈现“西北高、东南低”的分布特征[24];王少剑等发现中国城市CO2排放强度存在空间集聚性,且集聚水平随时间不断变化[25];Su等利用夜间灯光数据测算了中国314个城市的CO2排放,发现北方城市的人均CO2排放量总体高于南方城市[26]。但是,已有研究主要关注CO2单一排放,鲜少结合其他温室气体进行综合分析,更未见从区域协调发展视角探讨博台线两侧CO2排放均衡性的成果报道。
为此,本文基于中国338个城市的CO2、甲烷(CH4)、氧化亚氮(N2O)和含氟温室气体等4类温室气体排放清单数据,通过计算泰尔指数和基尼指数,分析博台线两侧CO2、CH4、N2O和含氟温室气体的区域间和区域内均衡性,并进一步对农业、工业过程、工业能源、服务业、交通、城镇生活和农村生活等7个部门CO2排放的空间均衡性进行评估。本文旨在论证博台线作为中国区域发展均衡线的科学依据,以不断丰富区域协调发展的理论与策略,为促进中国向高质量发展迈进提供一些参考。
2 数据来源与研究方法
2.1 数据来源
温室气体排放数据来自中国高空间分辨率排放网格数据(China High Resolution Emission Database, CHRED),涵盖中国338个地级以上城市(行政区划以2015年为准进行数据归并,包括293个地级市、30个自治州、8个地区、3个盟和4个直辖市。限于数据的可得性,暂未包含香港、澳门和台湾)的2005年、2012年和2015年的CO2以及2015年的CH4、N2O和含氟温室气体等4类温室气体排放清单,其中,含氟温室气体包括氢氟碳化合物(HFCs)、四氟化碳(CF4)、六氟乙烷(C2F6)和六氟化硫(SF6)[27]。此外,不同温室气体的排放来源存在一定差异,CO2排放普遍存在于各产业中,而CH4、N2O主要来自农业排放,含氟温室气体则主要来自电子产品制造、电力工业和金属冶炼行业。限于数据可得性,本文仅对2015年的CO2排放进一步做部门尺度的分析,分为农业、工业过程、工业能源、服务业、交通、城镇生活和农村生活排放共7个部门。其中,农业主要包括农作物种植和畜牧养殖,工业过程主要包括水泥、石灰、钢铁、玻璃和氨生产以及废弃物处理,工业能源主要包括电力、热力、水服务产业,服务业主要包括通信、金融、房地产和公共服务业,交通主要包括公路、铁路、水上运输和航空运输,城镇生活和农村生活主要包括住宿、餐饮、医院、学校和家庭的取暖、烹饪和粪便管理活动[28]。各城市人口、GDP和其他经济社会数据来自CHRED、《中国城市统计年鉴》、国民经济与社会发展统计公报、政府工作报告等。2.2 研究方法
2.2.1 区域间均衡性测度 引入泰尔指数测度博台线两侧西南半壁和东北半壁温室气体排放的区域间均衡性。泰尔指数(T)取值范围为[-1, 1],当其绝对值越接近于1时,说明组间温室气体排放的均衡性越低;反之,其绝对值越接近0,说明组间温室气体排放的均衡性越高[29]。泰尔指数的计算公式如下:式中:T为温室气体排放强度差距程度的泰尔指数;n为区域总数;xi为区域i的温室气体排放量;
2.2.2 区域内均衡性测度 基尼系数是国际上通用的度量经济不平等状况的指标[30]。相较于泰尔指数,基尼系数有较为系统的分级标准,其中,[0, 0.2)为绝对平均,[0.2, 0.3)为比较平均,[0.3, 0.4)为相对合理,[0.4, 0.5)为差距较大,[0.5, 1]为差距悬殊。此外,通过绘制洛伦兹曲线得出的基尼系数能够更为直观地展现区域内均衡性变化趋势,因此本文进一步采用基尼系数度量博台线两个半壁内温室气体排放的均衡程度,基尼系数越小,表明区域内温室气体排放的均衡性越高,反之亦然。通过模拟温室气体排放在GDP和人口维度的洛伦兹曲线,用定积分法求解基尼系数,计算公式如下[31]:
式中:n为区域i内的城市总量;j为区域
3 结果与分析
3.1 博台线两侧温室气体排放的均衡性
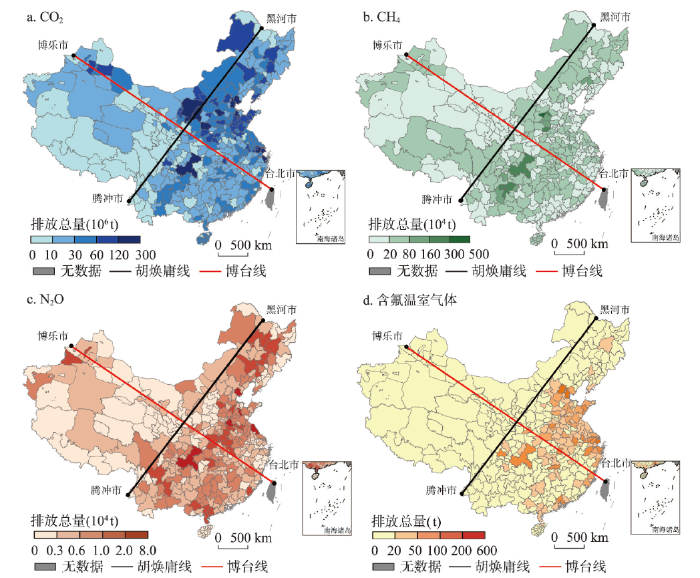
3.1.1 温室气体排放的区域间均衡性 2015年CO2、CH4、N2O和含氟温室气体排放总量以博台线为界呈现较为对称的空间分布格局(图1)。其中,西南半壁与东北半壁的CO2、CH4、N2O和含氟温室气体排放总量占比分别为27:73、44:56、43:57和31:69,可见,CH4和N2O排放总量的空间均衡性高于CO2和含氟温室气体。为进一步探讨博台线两侧温室气体排放的空间均衡性,采用泰尔指数从温室气体排放强度和人均排放量两个维度进行分析(表1)。博台线两侧各类温室气体排放强度和人均排放量的泰尔指数均小于0.05,空间分布总体较为均衡。无论从排放强度还是人均排放上看,CH4和N2O的泰尔指数均小于CO2和含氟温室气体。《中华人民共和国气候变化初始国家信息通报》指出[32],农业活动(动物反刍、水稻种植、施肥及废弃物管理等)排放的温室气体占全国温室气体排放总量的17%,其中农业活动产生的CH4和N2O分别占全国排放量的50.15%和92.47%。可见,农业活动是大气N2O和CH4的重要来源。博台线两侧种植业和畜牧业在空间上的均衡分布使得博台线两侧的N2O和CH4排放较为均衡。图1
 新窗口打开|下载原图ZIP|生成PPT
图12015 年中国博台线两侧各类温室气体排放的空间格局
注:基于自然资源部标准地图服务网站GS(2016)1594 号标准地图制作,底图边界无修改。
Fig. 1Spatial distribution of greenhouse gas emissions on both sides of the Bole-Taipei Line, 2015
Tab. 1
表1
表12015年中国博台线两侧各类温室气体排放的泰尔指数
Tab. 1
| 温室气体类型 | 强度泰尔指数 | 人均泰尔指数 |
|---|---|---|
| CO2 | 0.0346 | 0.0484 |
| CH4 | 0.0040 | 0.0008 |
| N2O | 0.0029 | 0.0004 |
| 含氟温室气体 | 0.0163 | 0.0262 |
新窗口打开|下载CSV
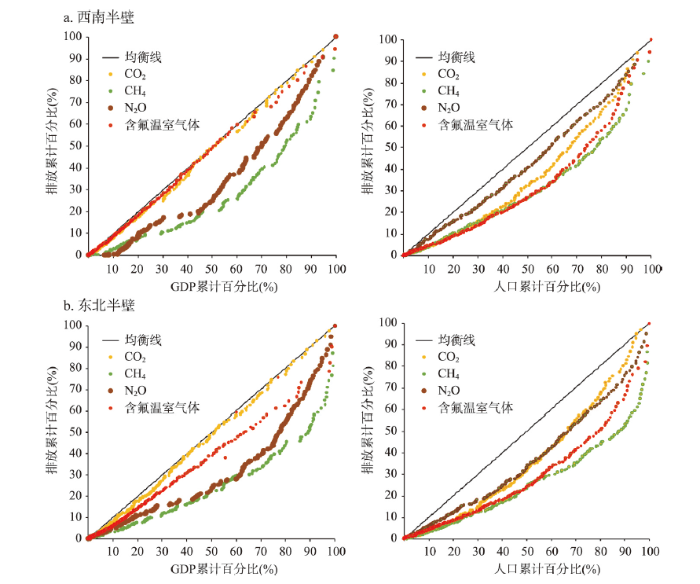
3.1.2 温室气体排放的区域内均衡性 对于博台线西南半壁和东北半壁而言,基于GDP和人口两个维度得到的CO2、CH4、N2O和含氟温室气体的基尼系数均小于0.25,表明博台线两侧区域内各类温室气体排放总体呈现均衡分布态势(图2)。从GDP维度上看,西南半壁和东北半壁内分布均衡性最高均为CO2,主要得益于能源强度在中国东中西部的趋同变化态势[33];最低均为CH4,反映出中国农业技术水平仍具有显著的空间异质性[34]。从人口维度上看,博台线两侧区域内分布均衡性最高分别为含氟温室气体和CO2,最低分别为N2O和CH4,西南半壁与东北半壁内农业发展的不均衡是导致后两者排放均衡性较低的原因[34]。总体而言,GDP和人口与温室气体排放呈显著正相关关系,即三者在空间分布上具有一致性[35,36]。由于西南半壁和东北半壁的GDP和人口的基尼系数为分别为0.13和0.16,因此西南半壁因经济增长和人口集聚导致的温室气体排放的空间均衡性高于东北半壁。
图2
 新窗口打开|下载原图ZIP|生成PPT
图22015年中国博台线西南(a)和东北(b)半壁各类温室气体排放的洛伦兹曲线
Fig. 2Lorentz curves for greenhouse gas emissions to the southwest and the northeast of the Bole-Taipei Line, 2015
3.2 博台线两侧CO2排放的均衡性
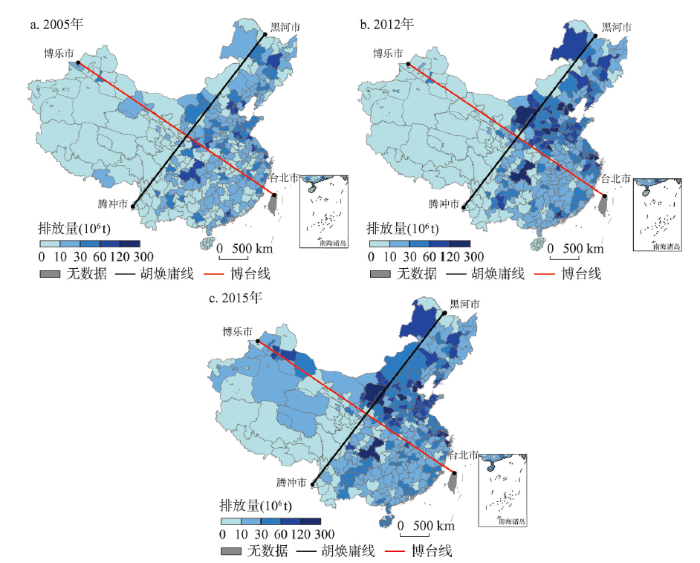
3.2.1 CO2排放的区域间均衡性 2015年博台线两侧CO2排放量较2005年分别增长了1.70倍和1.72倍(图3),增速较为接近,可见未来一个时期CO2排放的空间均衡性将继续存在。此外,2005—2015年博台线两侧CO2排放强度和人均CO2排放的泰尔指数均显著上升,分别从0.007和0.030增至0.035和0.048(表2),表明两者在西南半壁和东北半壁间总体呈现均衡分布态势,但均衡性随时间推移有所降低。图3
 新窗口打开|下载原图ZIP|生成PPT
图32005—2015年中国博台线两侧CO2排放的空间格局
注:基于自然资源部标准地图服务网站GS(2016)1594号标准地图制作,底图边界无修改。
Fig. 3Spatial distribution of greenhouse gas emissions on both sides of the Bole-Taipei Line, 2005-2015
Tab. 2
表2
表22005—2015年中国博台线两侧CO2排放的泰尔指数
Tab. 2
| 年份 | 强度泰尔指数 | 人均泰尔指数 |
|---|---|---|
| 2005 | 0.0072 | 0.0304 |
| 2012 | 0.0151 | 0.0424 |
| 2015 | 0.0346 | 0.0484 |
新窗口打开|下载CSV
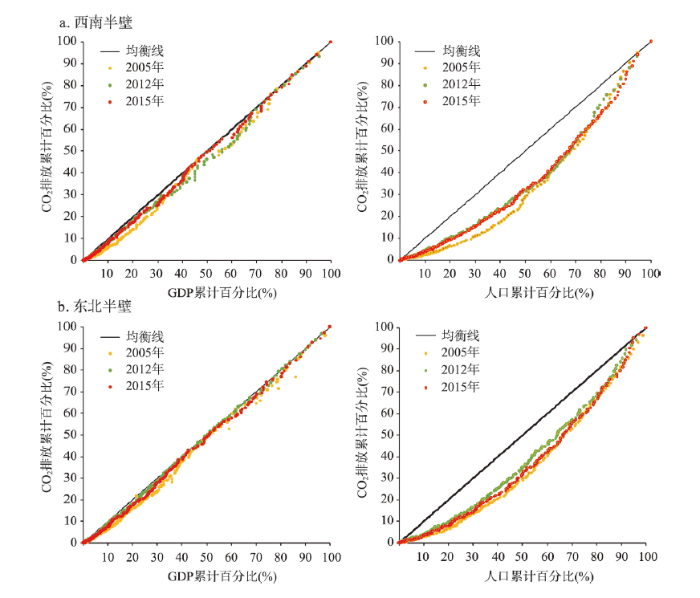
3.2.2 CO2排放的区域内均衡性 在GDP和人口两个维度上刻画2005—2015年博台线西南半壁和东北半壁CO2排放的洛伦兹曲线,以反映区域内部CO2排放的均衡性(图4)。博台线两侧CO2排放的基尼系数在GDP和人口两个维度上均呈现下降趋势,表明在西南半壁和东北半壁内,CO2排放强度和人均CO2排放的空间均衡性日益增强。近年来中国各地区加快转变经济发展方式,积极落实节能减排举措,使得CO2排放强度和人均排放量的区域差异不断缩小[37]。无论是西南半壁和东北半壁,其CO2排放强度的基尼系数均小于人均CO2排放,这说明相较于经济发展水平,技术水平的提高对CO2排放的空间均衡性影响更大,总体上技术水平越高,则CO2排放的均衡性越高。
图4
 新窗口打开|下载原图ZIP|生成PPT
图42005—2015年中国博台线西南(a)和东北(b)半壁CO2排放的洛伦兹曲线
Fig. 4Lorentz curves for CO2 emissions to the southwest and the northeast of the Bole-Taipei Line, 2005-2015
3.3 博台线两侧不同部门CO2排放的均衡性
3.3.1 不同部门CO2排放的区域间均衡性 为更细致地考察博台线两侧CO2排放的变化情况,对2015年农业、工业过程、工业能源、服务业、交通、城镇生活和农村生活等7个部门CO2排放量的空间格局进行分析(图5)。总体上,博台线两侧各部门CO2排放呈现较为均衡的空间分布态势,其中农业、工业过程、工业能源、服务业、交通、城镇生活和农村生活部门在西南半壁与东北半壁的排放量之比分别为42:58、53:47、47:53、58:42、55:45、57:43和42:58,表明中国西南半壁和东北半壁的产业分布相对均匀。进一步地,博台线两侧各部门CO2排放强度和人均CO2排放的泰尔指数均小于0.07(表3),其中农业部门的区域间均衡性最高,其强度和人均泰尔指数均不超过0.001;而服务业部门的区域间均衡性最低,其强度和人均泰尔指数分别为0.068和0.050。究其原因,与农业相比,服务业受经济和城镇化水平驱动显著。图5
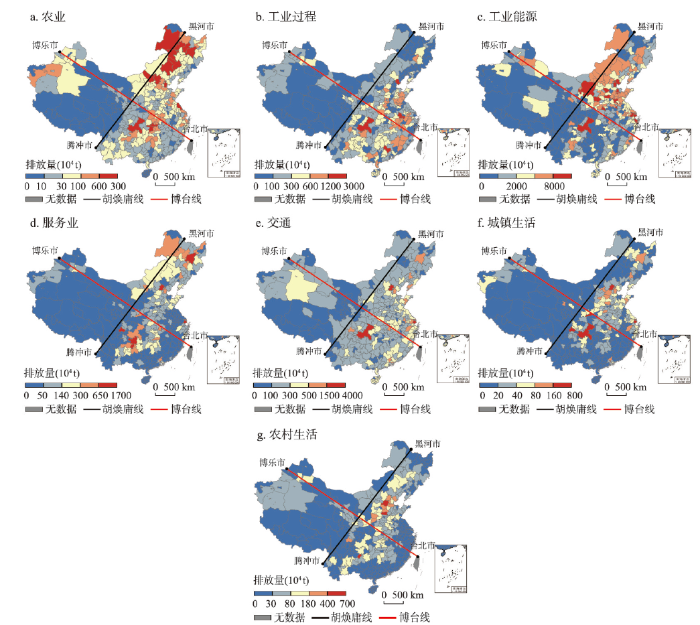 新窗口打开|下载原图ZIP|生成PPT
图52015年中国博台线两侧不同部门CO2排放的空间格局
注:基于自然资源部标准地图服务网站GS(2016)1594号标准地图制作,底图边界无修改。
Fig. 5Spatial pattern of sectoral CO2 emissions on both sides of the Bole-Taipei Line, 2015
Tab. 3
表3
表32015年博台线两侧各部门CO2排放的泰尔指数
Tab. 3
| 部门 | 强度泰尔指数 | 人均泰尔指数 |
|---|---|---|
| 农业 | 0.0009 | 0.0000 |
| 工业过程 | 0.0386 | 0.0260 |
| 工业能源 | 0.0117 | 0.0053 |
| 服务业 | 0.0675 | 0.0504 |
| 交通 | 0.0487 | 0.0344 |
| 城镇生活 | 0.0594 | 0.0434 |
| 农村生活 | 0.0016 | 0.0000 |
新窗口打开|下载CSV
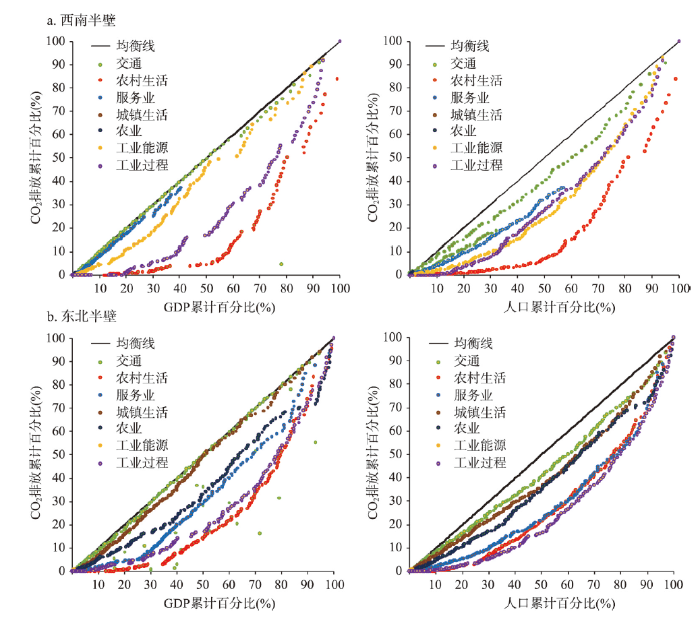
3.3.2 不同部门CO2排放的区域内均衡性 博台线两侧各部门CO2排放在GDP和人口两个维度上的区域内均衡性相对较高,但不同产业部门之间差异较大(图6)。其中,交通部门CO2排放强度和人均CO2排放的区域内均衡性最高,而农村生活部门则最低。总体而言,东北半壁各部门CO2排放在GDP和人口两个维度上的均衡性高于西南半壁。博台线东北半壁拥有长江三角洲、京津冀等较为典型的“先发型”城市群,其他如山东半岛等城市群也有较好的经济和工业基础,整体发展水平较高,故其人均GDP相比西南半壁更为均衡[2];而西南半壁除了成渝和珠江三角洲城市群外,其他城市群发育程度普遍不高,集聚效应不甚显著。值得一提的是粤港澳大湾区仍处于规划论证阶段,其距离区域均衡乃至一体化发展尚需时日。
图6
 新窗口打开|下载原图ZIP|生成PPT
图62015年博台线西南(a)和东北(b)半壁不同部门CO2排放的洛伦兹曲线
Fig. 6Lorentz curves for sectoral CO2 emissions to the southwest and the northeast of the Bole-Taipei Line, 2015
此外,博台线横穿了长江中游城市群和关中平原城市群等6个城市群[8],故难以将它们归入某一半壁。由此可见,西南半壁的城市群呈现出“少强多弱”的发展态势,均衡性有待提升,从而使得其内部的技术和经济差异大于东北半壁。
4 结论与讨论
4.1 结论
本文基于中国338个城市CO2、CH4、N2O和含氟温室气体排放清单,借助泰尔指数和基尼系数分别测度了2015年博台线两侧各类温室气体的区域间和区域内均衡性,以及2005年、2012年和2015年博台线两侧CO2排放的区域间和区域内均衡性,并进一步对2015年农业、工业过程、工业能源、服务业、交通、城镇生活和农村生活等7个部门CO2排放的空间均衡性进行了探讨,得到以下主要结论:(1)从区域间均衡性来看,CO2、CH4、N2O和含氟温室气体排放量以博台线为界总体呈现南北对称的分布格局,且CH4和N2O的空间分布更为均衡;博台线两侧各类温室气体的排放强度和人均排放量差异不大;博台线两侧各部门的CO2排放也较为均衡,其中均衡性最高为农业部门,最低为服务业部门。
(2)从区域内均衡性来看,博台线西南半壁和东北半壁内各类温室气体排放量总体呈现均衡分布态势,且西南半壁在GDP和人口维度上的空间均衡性均高于东北半壁;博台线两侧CO2排放在GDP和人口两个维度的时间变化基本一致,且CO2排放强度的空间均衡性显著高于人均CO2排放;与此同时,东北半壁各部门CO2排放在GDP和人口两个维度上的均衡性高于西南半壁,但不同部门间差异较大,交通部门的均衡性最高,而农业生活部门则最低。
(3)博台线两侧区域间和区域内的各类温室气体排放均呈现显著的空间均衡性,且CO2排放强度和人均排放的均衡性持续增强,表明垂直于胡焕庸线的博台线有理由建成中国区域发展的均衡线,为推动形成优势互补高质量发展的区域发展新格局提供了新路径。
4.2 讨论
胡焕庸线作为人地关系的重大地理发现之一,反映出中国东西部地区发展的不均衡性。本文关注与胡焕庸线垂直的博台线,有助于跳出如何突破胡焕庸线的争论,为实现区域协调发展战略提供了新的思考路径。基于上文分析,得出如下政策建议:① 从博台线两侧的区域间均衡性来看,CO2和含氟温室气体的区域间均衡性均低于N2O和CH4,而工业是CO2和含氟温室气体的主要排放源,农业是N2O和CH4的主要排放源。因此,博台线两侧应加快工业能源、工业过程和交通相关产业低碳转型升级,并以博台线为发展轴,将西北内陆地区和东南沿海地区有机连接在一起,为培育形成内外联动、优势互补的产业经济发展格局提供行动路线[38]。② 从博台线两侧的区域内均衡性来看,西南半壁和东北半壁内分布均衡性最高均为CO2,主要得益于能源强度在中国东中西部的趋同变化态势[33];最低均为CH4,反映出农业技术水平仍具有显著的空间异质性[34]。因此,对于两个半壁内部而言,应持续加大对农业部门尤其是高CH4排放活动的研发投入,进一步提高能源效率,促进农业部门可持续发展。
诚然,中国发展的不平衡不充分是普遍存在的。本文从温室气体排放视角论证了博台线作为中国区域发展均衡线的科学性和合理性,但本研究并非追求博台线两侧区域各项指标的完全均等分布,而是旨在从博台线来探讨中国均衡发展的态势和实现路径,表明博台线具备跃升为国家经济社会均衡发展战略主轴的潜力,对于缩小东中西部和南北方的地区差距,促进高质量发展具有重大的理论和现实意义。未来应从以下几方面继续深化相关研究:① 在理论内涵方面,有必要将更多的资源环境和社会经济要素纳入均衡性分析,全方位、多维度论证博台线存在的科学依据,并探寻特定人类活动或要素分布在空间上呈现的“博台亚线”,以丰富和完善对于博台线的科学认知;② 在区域协同方面,博台线呈西北—东南走向,胡焕庸线呈东北—西南走向,二者将中国版图划分为四大象限,须重点探讨如何实现各象限内部以及各象限之间的协调发展和良性互动,不断深化有关国家区域协调发展战略的规律性认识;③ 在战略延伸方面,积极探索与“一带一路”倡议等重大区域发展战略相结合,倡导博台线西北端由过去对外开放的后方向前沿转变,促进“一带一路”成为更具国际影响力的开放合作平台[39]。同时鼓励博台线东南端继续深化两岸互利合作,增进两岸同胞福祉,释放博台线在推动祖国和平统一事业中的潜能。最后需要指出的是,温室气体排放只是人类活动的一个侧面,博台线在引领中国区域协调发展方面的作用还须进一步论证和检验。期待****同仁围绕这一主题开展更多的争鸣与探索。
参考文献 原文顺序
文献年度倒序
文中引用次数倒序
被引期刊影响因子
[本文引用: 1]
[本文引用: 1]
[本文引用: 2]
[本文引用: 2]
DOI:10.11821/dlyj201502004 [本文引用: 1]

Regional economic disparity has been a highly debated topic since the 1990s. Many domestic and foreign scholars have completed various aspects of studies in this field. The analyses of the economic disparities and their spatio-temporal evolution are of great significance for the government to generate balanced and non-balanced development strategy of regional economy. This paper integrated the methods of two-stage nested Theil decomposition and ESDA. Based on the three-level hierarchical structure (economic zone-province-district), regional disparities were decomposed into three components: the between-region, between-province and within-province components. Also, the paper explored spatial autocorrelation at the district level using ESDA method. The results showed that, (1) the economic disparities increased slightly since 2000 and then decreased continuously after 2004. The degree of within-province disparity was the highest, followed by the between-region component, while the between-province component was the lowest. (2) Compared with other economic zones, the Middle Reach of Yellow River Economic Zone, the Northeast Economic Zone, the Southwest Economic Zone and the Northeast Economic Zone had relatively great economic disparities. (3) The number of provinces with a decline within-province economic disparities was increasing. (4) China's regional economic disparities showed a significant spatial polarization trend with a rising change of HH type districts, a stable trend of LL type districts and a relatively small number of HL and LH type districts.Finally, the paper briefly analyzed the impact factors of regional economic disparities since 2000. This paper argued that the difference of Chinese regional development policy was the main macro factor, such as strategies of Western China Development, Revitalizing the Northeast Old Industrial Bases and the Rise of Central China. Location and infrastructure difference were the factors that objectively led to regional economic disparities. Differences of resource endowments were the initial factors causing economic disparities, which were also influenced by the allocation and efficiency of resource utilization. Differences of investment in fixed assets were the direct factor that contributed to economic disparities. Division of executive power was another important factor leading to the concentrated distribution of poverty zones.
[本文引用: 1]
DOI:10.11821/xb193502002 [本文引用: 1]
China is the most populous country of the world.Besides her great numberof population she has also the most densely inhabited regions which are notcomparable with any other country of the world.
[本文引用: 1]
DOI:10.1360/N072014-00514URL [本文引用: 1]
[本文引用: 1]
DOI:10.11821/dlyj201605001 [本文引用: 1]
Hu Huanyong, a famous geographer, discovered a divide of population geography in China in 1935 (hereinafter referred to as the Hu Line), which was an important achievement in the development of the discipline of geography in China, and was widely accredited and cited. In November, 2014, Premier Li Keqiang raised a question about the Hu Line, when he visited the exhibition of sciences of human settlements in the National Museum of China. This question is whether the Hu Line can be broken or not again caused a stir. Hereby we invited some geographers to have academic discussion on this question, aiming to demonstrate their understanding and reflection on the Hu Line from different perspectives. Thus, the scientific value and practical significance of the Hu Line are deepened, and furthermore, the Hu Line can provide reference for the implementation and regional planning of the new-type urbanization in China.
[本文引用: 1]
DOI:10.11821/dlxb201602001 [本文引用: 1]
In November, 2014, Premier Li Keqiang raised a problem about Hu Huanyong population line (hereinafter referred to as "Hu line"), when visiting the exhibition of sciences of human settlements in National Museum of China, which was called "Premier's Question" by the press. Hence, Hu line has become a highlight currently, and aroused great controversy and different views. Aiming at such dilemma of cognition, this paper gives a general review of the origins of Hu line, which was put forward by the famous population geographer Hu Huanyong in 1935, under the background of a debate on the surplus of domestic population. Based on population census data and GIS platform, the paper analyzes the change of population scale, proportion and density in both southeast and northwest sides of Hu line. The results indicate that the population urbanization and migration do not change the pattern of population distribution determined by Hu line. On such basis, the pattern that the population density of southeast part is large, while that of northwest part is relatively small will not radically change over a longer period, and the pattern that urban agglomeration is mainly located in southeast part as well. The long-term existence of Hu line depends on integrated physical geographical conditions, like climate. At the meantime, this paper argues that the core issue of the Premier's concern is solvable, by positive policy guidance and reasonable spatial organization. It is definitely promising for western China to realize a higher level of modernization and a better quality of urbanization, and central region as well.
[本文引用: 1]
DOI:10.11821/dlxb202002001 [本文引用: 3]
Promoting regional coordinated development strategy is one of the most important strategies in the new period of China. Faced with the reality of unbalanced and insufficient regional development in China, it is objectively necessary to construct one or more main axes supporting the coordinated and balanced development of regions to become the identification line representing the pattern of coordinated regional development. The results show that the Bo-Tai line, the northwest-southeast axis connecting Bole of Xinjiang and Taipei of Taiwan, can be built into a national development backbone line and regional balanced development line, just perpendicular to the Hu Line. In 2016, the area of southwest half and northeast half of Bo-Tai Line accounts for 59:41, while the population accounts for 45:55, the economic aggregate accounts for 40:60, the per capita GDP ratio accounts for 44:56, the population density ratio accounts for 38:62, the economic density ratio accounts for 32:68, and the urbanization level ratio accounts for 48:52. The main average indicators gradually tend to present a balanced development pattern. Further analysis shows that Bo-Tai Line is a strategic shoulder pole connecting two core zones of the Belt and Road, and is the peaceful reunification line of China's national tranquility and Taiwan's return. The Bo-Tai Line is also a solid line supported and connected by comprehensive transportation channels and a Pipa type symmetrical line for the development of cities and urban agglomerations. It is the backbone of the two-way opening up and the linkage development line between land and sea. It is also an important dividing line that promotes the coordinated development of the eastern, central and western regions, and addresses the imbalance and inadequacy of regional development. The Bo-Tai Line plays an irreplaceable strategic role in promoting the coordinated and balanced regional development. It is suggested that the construction of Bo-Tai Line should be included in the national development strategy, and the development strategic plan of Bo-Tai Line should be formulated to fully release the multiple potential functions. We should build three strategic support points (the northwest endpoint, the central strategic node and the southeast endpoint), carry out a comprehensive scientific investigation of the Bo-Tai Line, and strengthen the scientific cognition and publicity, and promote China's development in a higher-level, higher-quality, more coordinated, safer and more civilized direction. And we should make the Bo-Tai Line known to China and the world, and let the Bo-Tai Line truly become the backbone of the great rejuvenation of the Chinese nation.
[本文引用: 3]
DOI:10.11821/dlxb201701012 [本文引用: 1]
Hu Line uncovers one of China's most important characteristics of population paper distribution: East is dense, while west is sparse. Different from most previous research, this paper examined the differentiation and changes of population distribution on both sides of Hu Line from a perspective of spatial stratified heterogeneity instead. Geodetector was employed based on the spatial database of China's census data of 1953, 1982, 1990, 2000 and 2010 to reconfirm spatial position of Hu Line and analyzed changes of spatial stratified heterogeneity of population between southeast and northwest sides of Hu Line in different periods. Changes of population distribution since the founding of New China were found and the reasons for these changes were discussed. Major findings include: (1) From the spatial stratified heterogeneity perspective, Hu Line could be improved and optimized, at least, in some periods. Although the ratio of total population on both sides of Hu Line has roughly been kept at 94:6 since 1953, spatial stratified heterogeneity of population between the two sides (the southeastern side: the northwestern side) increased when Hu Line moves to south slightly in 1953, 2000 and 2010, which means population distribution was more homogeneous within either southeastern or northwestern region and heterogeneity was more remarkable between the two regions. (2) Heterogeneity decreased gradually since the reform and opening up. We found characteristics of population distribution converged on the two sides, especially since the 1990s when convergence between the two sides became apparent. This finding is significantly different from the conclusion of "remain unchanged" from most literatures. The reasons why heterogeneity reduced were: pattern of population distribution on the southeastern side changed from relatively even distribution among cities before 1990 to agglomeration in a few huge cities after 2000, while the degree of spatial agglomeration of population decreased slightly after the reform on the northwestern side. These changes have been confirmed by the analysis from cumulative distribution function and Gini coefficient. (3) On the whole, the effect of economic factors on population distribution has become more and more important, while the effect of natural environment and institution reduced. Combined effect from economic development, natural environment and institution resulted in two opposite directions of changes of population spatial distribution on the two sides. It should be emphasized that although general effect of natural environment has decreased, some natural factors, such as Three Gradient Terrains, still have significantly influence on population distribution in China.
[本文引用: 1]
DOI:10.11821/dlyj201605002 [本文引用: 1]
The Hu Huanyong Line, which is also called the Aihui-Tengchong Line, is drawn by Hu Huanyong and marks a striking difference in the distribution of China's population. It has been accepted and used for the last 81 years, and has had a considerable influence on Chinese population distribution research at home and abroad. With rapid new urbanization, research on the Hu Huanyong Line has increased sharply. In the context of new urbanization, an urgent question for us is how to understand the Hu Huanyong Line accurately. As a divide between the distribution patterns of the population in China, the Hu Huanyong Line has not changed substantially in the past 81 years. It represents a divide not only for the ecological environment, but also for climate. There are mainly prohibited development areas and restricted development areas in the Major Function Oriented Zones Planning west of the Hu Huanyong Line. It is not only the region east of the Hu Huanyong Line, but also includes some parts of the central and western regions of China. The formation of the line was the result of long-term interactions between the natural environment, economic development and social and historical conditions. Therefore, it would not be changed by what we think and do to break through. New urbanization emphasizes that the rural population migrates to the towns and cities nearby, rather than a large-scale transfer of population. Due to a local transfer of 100 million people in the central and western regions, new urbanization will accelerate the process of the population gathering in these regions. New urbanization has a significant impact on the population structure of different sizes of cities and towns, but little effect on the national spatial pattern. It is healthy urbanization in harmony with nature, therefore, rational thinking is required during the process of new urbanization, in order to optimize the spatial distribution pattern of urbanization. Pushed by the two-child policy issued recently, the population in the eastern and central China is predicted to increase with the western region increasing slowly due to the unbalanced population birth policy. With the implementation of the Belt and Road Initiative, urbanization in the western region will accelerate, opening up and expanding border cities, thus posing new challenges to the population distributed either side of the Hu Huanyong Line.
[本文引用: 1]
[本文引用: 1]
[本文引用: 1]
DOI:10.1080/14693062.2012.693392URL [本文引用: 1]
DOI:10.1016/j.socnet.2016.03.001URL [本文引用: 1]
[本文引用: 1]
[本文引用: 1]
URL [本文引用: 1]
DOI:10.11821/dlxb201609012 [本文引用: 1]
Water, land, energy and carbon are key elements of earth's surface system. Researches on regional water-land-energy-carbon system (WLEC system) will not only help to reveal the impact mechanism of resource coupling exploitation on carbon emissions, but also has great significance to explore low-carbon development mode based on water, land and energy saving. Based on the literature review, this paper analyzed the element relationship of regional WLEC system, discussed the coupling interaction mechanism, research perspectives and impact factors of regional WLEC system, and put forward the future research points in this field. The main conclusions are as follows: (1) Regional WLEC system reflects the interactions among different spheres of earth's surface system. Through water cycle, land use, energy flow and carbon cycle, WLEC system becomes the core of regional natural-economic-social system. It not only reflects the matching relationship and exploitation efficiency of regional resources, but also embodies the impact extent of human activities on environment. (2) Regional WLEC system can be divided into three subsystems: water system, land system and energy system. They interacted with each other and together formed the resource base for the regional socio-economic development. Regional carbon emission intensity is mainly determined by the need relationship among three subsystems, industrial activities and energy structure. (3) Regional WLEC system can be studied from different perspectives such as microscopic view, industrial activities and land use. (4) Regional WLEC system is influenced by natural, economic, social and pressure factors, in which economic factor, especially economic development level, production efficiency and technology, is the determinant factor of the function and efficiency of regional WLEC system. (5) In the future, modeling of regional WLEC system, relationship between WLEC system and climate change and food security, carbon emission efficiency of resource coupling exploitation and the integrated evaluation and regulation of WLEC system should be strengthened.
[本文引用: 1]
[本文引用: 1]
[本文引用: 1]
DOI:10.1038/ngeo3031URL [本文引用: 1]
[本文引用: 1]
[本文引用: 1]
DOI:10.1016/j.jclepro.2017.06.075URL [本文引用: 1]
DOI:10.1016/j.enpol.2011.05.021URL [本文引用: 1]
URL [本文引用: 1]
[本文引用: 1]
[本文引用: 1]
DOI:10.11821/dlxb201906005 [本文引用: 1]
Since the Paris Climate Change Conference in 2015, reducing carbon emission and lowering carbon intensity has become a global consensus to deal with climate change. Due to different economic development stages, carbon intensity is regarded as a better index to measure regional energy-related carbon emissions. Although previous scholars have made great efforts to explore the spatiotemporal patterns and key driving factors of carbon intensity in China, the results lack the perspective from city level because of limited availability of statistical data of city-level carbon emission. In this study, based on carbon intensity of 283 cities in China from 1992-2013, we used the kernel density estimation, spatial autocorrelation, spatial Markov-chain and quantile regression panel model to empirically reveal its spatial spillover effects and explore the critical impact factors of carbon intensity at the city level. Our result indicates that although the total carbon emission increased during the study period, carbon intensity saw a gradual decline and regional differences were shrinking. Secondly, the city-level carbon intensity presented a strong spatial spillover effect and diverse regional backgrounds exerted heterogeneous effects on regions. Thirdly, quantile panel data analysis result showed that for low-intensity cities, on the one hand, FDI and transport sector were main contributing factors, and economic growth, technical progress and high population density negatively affected carbon intensity. On the other hand, industrial activity, extensive growth of investment and urban sprawl were key promoting factors for high-intensity cities, and population density was beneficial to emission reduction task. Furthermore, technological advance has not exerted negative influence on carbon intensity in high-intensity cities. At last, we suggested that Chinese government should take different carbon intensity levels into full consideration before policy making.
[本文引用: 1]
DOI:10.1016/j.rser.2014.04.015URL [本文引用: 1]
DOI:10.1021/es405369rURL [本文引用: 1]
[本文引用: 1]
[本文引用: 1]
[本文引用: 1]
DOI:10.11821/dlxb201910003 [本文引用: 1]
China's tourism development has made significant progress since the reform and opening-up policy officially launched in 1978. Now it is high time to conduct research on how and why the geographical pattern of China's tourism development has evolved in the previous four decades on national and regional scales. Employing grounded viable data sets (namely the inbound tourism data from 1979 to 2017 and the domestic tourism data from 1991 to 2017) and multiple vibrant data analysis approaches (including the Gini coefficient, the primacy index analysis, the hot spot analysis and the Pearson correlation analysis), this paper can draw three findings. (1) China's tourism can present a distribution pattern of "high in the eastern and southern parts, but low in the western and northern parts." Meanwhile, China's inbound tourism development has long been polarized, Guangdong is the "core" of inbound tourism, Beijing and Shanghai belong to the second tier, while Gansu, Xinjiang, Qinghai, Tibet and Ningxia lag behind. Meanwhile, the domestic tourism development has transferred from polarization to equilibrium distribution. (2) Different stages of China's tourism development exhibit various features and characteristics. Specifically, at the so-called initial modern tourism stage, inbound tourism was subject to extreme polarization, with Guangdong province taking a fatal and strategic role. Whereas, at the domestic tourism cultivating stage, the domestic tourism development in this nation was polarized spatially, though the landscape of the inbound tourism was hardly transformed (Guangdong the first, Beijing the second and Shanghai the third). When it came to the rapid development stage, Beijing was gradually surpassed by Shanghai in the realm of inbound tourism. In contrast, domestic tourism development was reasonably balanced. By the new normal stage, the landscape of the inbound tourism improved, and the first tier provinces began to take an increasing share in terms of domestic tourist reception capacity. Moreover, China's outbound tourism increased steadily at this stage, with Beijing and Shanghai playing leading roles in the citizens' overseas spending. (3) This research has identified multiple factors underlying the inbound and domestic tourism development in China, including policies, management systems, tourism demand, tourism attractions, economic level, consumption level, industrial development, investment status, traffic conditions, accommodation services, intermediary services and degree of openness.
[本文引用: 1]
[本文引用: 1]
[本文引用: 1]
[本文引用: 1]
[本文引用: 2]
[本文引用: 2]
[本文引用: 3]
[本文引用: 3]
[本文引用: 1]
DOI:10.1073/pnas.1908513117URL [本文引用: 1]
[本文引用: 1]
[本文引用: 1]
DOI:10.11821/dlxb202102002 [本文引用: 1]
Large regional differences and uneven regional development is fundamental of China. Regional balanced development is an important topic in the field of development geography. This study reviews the course of regional balanced development in China and summarize the characteristics of regional balanced development in each period. This study suggests that inter- regional development of China shows a state of succession between balanced development and non-balanced development. Each succession brings the quality of social development to a new level and gradually make social development move towards the state of high- quality development and balanced regional development. Then, this study discusses the scientific connotation of regional balanced development. Under the guidance of sustainable development theory, we should pay attention to the resource endowment difference in different area, solve the problem among economy, human and nature and promote spatial balance of regional development and green development of ecological economic coordination. The balanced promotion of regional people's well-being is the ultimate goal of regional balanced development. In the end, based on the thinking of development geography, this study discusses the path of regional balanced development in China from three aspects of society, economy and ecology. Suggestions are put forward for the balanced development of China's regions and the improvement of people's well-being.
[本文引用: 1]
URL [本文引用: 1]
