 ,1, 张晓平,1, 陈明星1,2, 高珊珊1, 李润奎1
Regional variation of urban air quality in China and its dominant factors
ZHAO Yanyan,1, ZHANG Xiaoping,1, CHEN Mingxing1,2, GAO Shanshan1, LI Runkui1通讯作者:
收稿日期:2020-09-7修回日期:2021-04-20
| 基金资助: |
Received:2020-09-7Revised:2021-04-20
| Fund supported: |
作者简介 About authors
赵艳艳(1995-), 女, 河北邢台人, 硕士生, 专业方向为产业与区域可持续发展。E-mail:

摘要
关键词:
Abstract
Keywords:
PDF (6113KB)元数据多维度评价相关文章导出EndNote|Ris|Bibtex收藏本文
本文引用格式
赵艳艳, 张晓平, 陈明星, 高珊珊, 李润奎. 中国城市空气质量的区域差异及归因分析. 地理学报, 2021, 76(11): 2814-2829 doi:10.11821/dlxb202111015
ZHAO Yanyan, ZHANG Xiaoping, CHEN Mingxing, GAO Shanshan, LI Runkui.
1 引言
随着中国工业化和城市化进程的推进,区域经济发展取得显著成效;但与此同时,也面临着生态环境等问题的严峻挑战,尤其是在人口高度密集的城市化地区,雾霾和PM2.5、PM10等空气污染问题突出,严重地影响到居民的健康及日常的生产和生活。自2014年以来,中国通过实施《空气污染防治行动计划》、京津冀、长三角等重点地区的重点行业空气污染限期治理等措施,不断深化对于大气环境的监测与污染防治工作。同期,经济“新常态”和高质量发展导向下结构转型也日益深化。对这一转型期城市空气质量时空演变特征进行总结分析,有助于对政策实施效果进行评估;在此基础上,对城市空气质量影响因素的进一步探究,可为空气污染的防治提供更有针对性的政策建议和决策参考,以提高城镇化发展质量并推动城市治理的精细化。学术界围绕区域空气质量这一热点问题开展了广泛的研究并取得了丰富的成果,研究视角主要集中在两个方面。一是对区域空气质量时空变化规律的研究。研究中,空气质量的表征指标通常包括单项污染物(如SO2、NO2,O3、PM10、PM2.5等[1,2,3])以及空气质量综合指数(如API[4]、AQI[5,6]等)。时间尺度涉及日、月、季节、年际演变规律等[7,8],地域尺度和空间范围也较为多样,包括国家、省域、城市群[9,10]、部分典型区域如京津冀及周边地区[11]、长三角地区[12]等,揭示了空气污染的空间集聚效应、空间溢出效应[13]等特征。二是对空气质量影响因素的研究。空气污染是在自然气象因素及人类社会经济活动因素的双重作用下形成的,其作用机理较为复杂。研究认为,沙尘[14]、风[15]、降水[16]、气温[17]等气候气象因子及地形[18]、植被指数[19]等自然地理因子对于污染物的滞留时间和污染物浓度产生直接影响,可以强化或减缓污染物之间的相互作用,通过影响空气污染物的区域传输扩散及空气自净等过程最终影响区域空气质量。与此同时,人类社会经济活动是空气污染物的主要排放源,是空气污染形成的主因。已有****探讨了经济增长、产业结构[20]、城市化[21]、工业化[22]、土地利用[23]、外商直接投资(FDI)[24]、人口密度[25]等社会经济因素对空气质量的影响作用;其研究方法包括空间计量模型[26,27]、地理加权回归(GWR)模型[28]、地理探测器模型[29]、主成分分析与多元线性回归模型[11]等。总体而言,现有对区域空气质量的研究多以单项污染物为研究对象或是分析单年份多项污染物的时空特征,相对缺少基于多项污染物多年份的综合评估研究。在影响因素的研究方面,较少关注不同种类空气污染物之间的相互影响作用;此外,多数模型受变量之间共线性的影响,模型的解释力和稳健性受到制约,且未能对主导影响因子进行有效识别。城镇化是人类活动主导的地理过程,它与环境系统之间互馈机理复杂[30]。城市大气环境系统是人与自然交互作用的结果,城市空气质量影响因素及其驱动机制研究仍需深化。
结合学界现有研究进展,本文围绕两个问题进一步深入探讨:一是采用新的《环境空气质量标准》(GB3095-2012)及2014年全面实施《空气污染防治行动计划》以来,中国城市6种空气污染物浓度的区域差异格局及演变态势如何?二是城市6种空气污染物浓度的主导影响因素有何不同?其中人类社会经济活动对其影响强度如何?对上述问题的回答,有助于理解城市空气污染的形成原因和演化机制,进而制定更加精准的空气污染防治方案,以提升城市精细化管理水平和治理效率、实现城市的高质量发展。鉴于此,本文采用CO、NO2、O3、PM10、PM2.5、SO2共6种分项空气污染物,以中国286个地级以上城市为样本,对2014—2019年中国城市空气污染状况进行综合评估;并利用面板回归模型分析污染物之间的相互影响作用,进而利用随机森林模型对6种空气污染物浓度与13个自然和社会经济影响因素的关联强度进行探究,从中提取关键影响因子。研究中采用的随机森林模型,可对大量数据进行处理,其运算速度快、运算结果稳健[31,32];预期可以克服传统研究中指标多重共线性的制约,并在城市空气质量影响因素分析及主导因子筛选方面取得良好的拟合效果和更深入的探究。
2 研究区域、数据来源与研究方法
2.1 研究区域及数据来源
考虑到中国行政区划调整变动和部分城市的数据缺失情况,本文选取286个地级以上城市作为研究对象。研究中,城市空气污染物数据来源于2014—2019年中国环境监测总站对于CO、NO2、SO2、PM10、PM2.5、O3的分时站点监测数据(表1),并依据《环境空气质量标准》(GB3095-2012)[33]中对数据有效性的规定,剔除部分无效数据,整理为年度数据。其中O3相关评价指标为O3的8小时最大滑动平均值的年均浓度值(表示为O3_8h),其余5种污染物为年均浓度值。城市污染物年均数据由城市内各监测站点(去除对照点)数据的算数平均值得到[34];部分城市有效站点数据缺失较多无法汇总时,采用该市当年环境质量公报的数据或者时间序列数据线性插值进行弥补。因2014年地级市O3_8h数据缺失较多,本文的O3_8h数据选取的研究时段为2015—2019年。Tab. 1
表1
表12014—2019年中国城市空气质量监测站点数量
Tab. 1
| 年份 | 2014 | 2015 | 2016 | 2017 | 2018 | 2019 |
|---|---|---|---|---|---|---|
| 站点数量(个) | 902 | 1446 | 1446 | 1545 | 1553 | 1589 |
新窗口打开|下载CSV
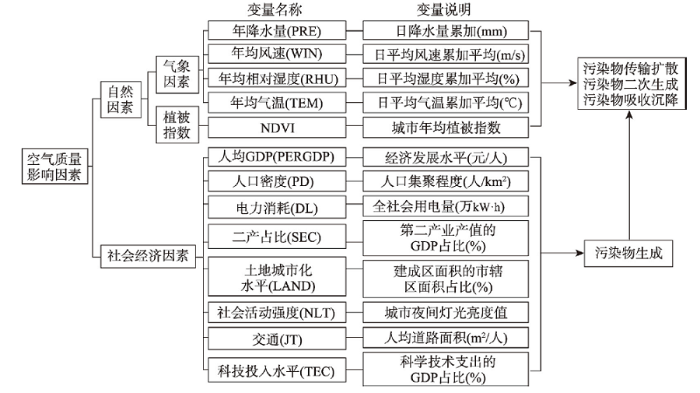
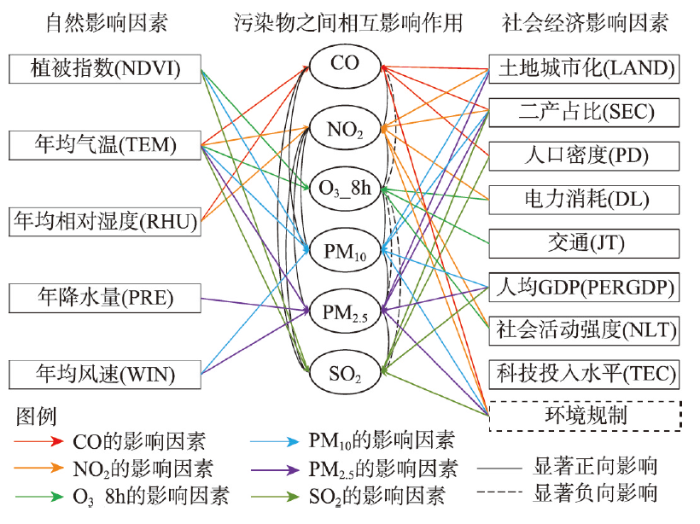
在城市空气污染物浓度的归因分析中,本文把影响因素分为自然因素和社会经济因素两大类(图1)。自然因素重点考虑了4个气象因子(年降水量、年均风速、相对湿度、年均气温)及植被指数因子,这些因素影响到空气污染物的传输、扩散、二次污染、沉降和消解等过程。其中气象因素数据来源于各省市统计年鉴、统计公报,部分缺失数据采用中国气象数据网(
图1
 新窗口打开|下载原图ZIP|生成PPT
图1本文建模选取的城市空气质量影响因素和变量说明
Fig. 1Explanatory variables for urban air quality in China and their descriptions
2.2 研究方法
2.2.1 核密度估计 核密度函数是一种非参数估计方法,用于分析数据分布的均衡程度。本文采用核密度估计模型刻画城市空气污染物浓度的总体分布及区域集聚差异:式中:n为地级城市数量;
2.2.2 面板回归分析模型 城市不同种类大气污染物之间存在显著的相互影响关系,可产生二次污染,但现有研究中对此分析有限。本文运用2015—2019年286个城市6种大气污染物,构建面板回归分析模型,进一步探究空气污染物之间的相互影响和作用关系。模型表达如下:
式中:Yit是从6种大气污染物(即CO、NO2、O3_8h、PM10、PM2.5、SO2)中选定的某一类污染物浓度在第i个城市(i = 1, 2, …, 286)第t年的值;Xmit表示第i个城市第m个解释变量在第t年的值,m = 1, 2, …, 5个解释变量,这里分别对应除被解释变量外的其余5种污染物的浓度;θit是随机干扰误差项;αi代表个体效应,随不同城市而变,如果模型检验结果表明αi = α,则表明不存在个体间差异;如果β显著不为0,则表明各污染物之间存在显著的相互影响和作用关系。
2.2.3 随机森林回归模型 随机森林模型是一种包含多个决策树分类器的机器学习方法。一般采用Bootstrap抽样方法,从原始样本中抽取多个样本,对每个Bootstrap样本进行决策树建模,然后将这些决策树组合起来,通过投票得分规则获得最终结果[39]。随机森林对于大数据集的处理十分方便,对于多重共线性不敏感,对缺失数据和非平衡的数据也比较稳健,能够提供相对精度较高的预测结果[31, 40]。其不仅可用于分类,也可用于回归分析,并进一步探究影响因素的相对重要性。本文采用R语言进行随机森林模型的运算,构建各污染物与相关影响因素的回归分析模型,并基于均方误差增加量、节点纯度增加量筛选不同污染物的主导影响因子。
3 结果分析
3.1 中国城市空气质量的时空特征
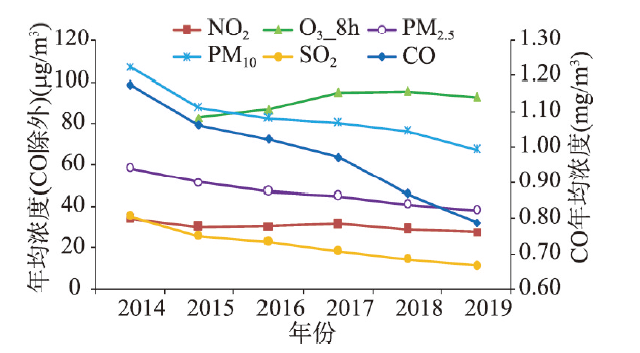
3.1.1 时间演变特征 2014—2019年中国城市6种分项空气污染物中,除O3_8h外,其余5种空气污染物浓度均呈下降趋势(图2)。其中SO2年均浓度的降幅最为显著,下降约70%;PM2.5、PM10、CO浓度降幅均在30%以上;而NO2浓度降幅相对较低,下降约19%。O3_8h的年均浓度在2015—2018年呈现逐年上升趋势;仅2019年的年均浓度较2018年略有下降。总体来看,中国空气污染治理取得阶段性成果,SO2、CO传统污染物浓度降幅较为明显,但O3污染形势相对较为严峻。图2
 新窗口打开|下载原图ZIP|生成PPT
图22014—2019年城市6种空气污染物年均浓度
Fig. 2Annual average concentrations of six urban ambient air pollutants from 2014 to 2019
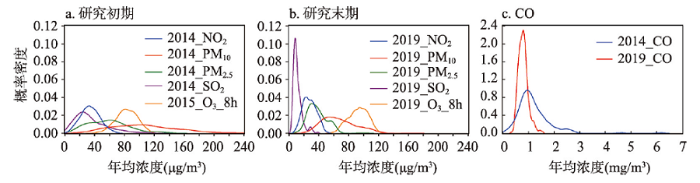
全国城市空气分项污染物浓度集聚态势及变化见图3核密度曲线对比。从各项空气污染物的核密度曲线的波峰位置来看,2019年除O3_8h外,其余5种空气污染物的核密度曲线波峰均较2014年向左侧收敛,表明研究期内O3_8h的浓度上升,其余5种空气污染物浓度总体降低,与图2结果吻合。2019年各污染物核密度曲线拖尾较2014年明显缩短,表明污染物浓度较低的城市数量增多,污染物浓度较高的城市数量减少。从各污染物浓度核密度曲线形态的时间演变特征来看,SO2、CO曲线形态由2014年的“矮胖型”明显地向2019年“瘦高型”转变,表明传统煤烟型空气污染在城市间存在显著差异;多数城市主要存在的是大气颗粒物、氮氧化物和O3的污染问题。
图3
 新窗口打开|下载原图ZIP|生成PPT
图3城市6种空气污染物浓度的核密度函数曲线形态对比
Fig. 3Comparison of kernel density curves of six urban ambient air pollutants
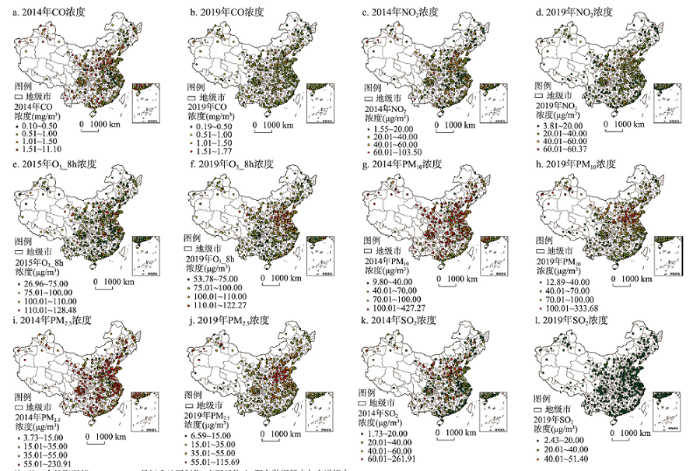
3.1.2 空间演变特征 图4刻画了中国城市间6种空气污染物浓度的区域差异性。空气CO浓度较高的城市主要以资源密集型的工业城市最为突出,如鹤岗、鞍山、本溪、包头、大同、长治、晋城、唐山、邢台、邯郸、淄博、汉中等市。到2019年,传统的CO典型污染区,如咸阳、宝鸡、郑州、洛阳、株洲、郴州、韶关等市污染状况显著改善。SO2浓度的空间分布格局与CO具有一定相似性,以资源型城市最为突出。虽然2019年SO2浓度较2014年相比显著降低,但仍有部分城市,如唐山、济南、淄博、太原、大同、朔州等城市SO2浓度相对较高。
图4
 新窗口打开|下载原图ZIP|生成PPT
图4城市监测站点6种空气污染物浓度时空分布及变化
注:基于自然资源部GS(2016)1569号标准地图制作, 底图无修改; 研究数据暂未包含港澳台。
Fig. 4Spatiotemporal variation of concentrations of six urban ambient air pollutants at monitoring stations
2019年较2014年相比大气NO2浓度整体降低,但NO2浓度较高的地区整体空间变动不大;相对较高的地区主要集中于人口密集和社会经济活动强度较高的大都市区和经济圈,如京津冀、长三角、珠三角、中原城市群、济南都市圈、成都都市圈等。
城市空气污染物中,PM10和PM2.5浓度相对较高的地区的空间分布范围较广,且二者空间分布格局具有一定的耦合性,京津冀城市群、山东半岛城市群、中原城市群以及山西省中部和南部等典型的能源重工业城市的污染物浓度相对较高。2019年,PM10浓度较2014年显著下降,浓度较高的地区分布范围在南方明显收缩,“北高南低”的空间分异特征更加显著。2019年多数城市站点PM2.5浓度显著下降,但其相对高值区分布范围较PM10相对高值区较广。
O3_8h浓度在空间分布上呈东高西低的特征。研究初期与末期O3_8h浓度相对较高的地区集中于北京、长三角城市群、山东省会城市群以及东莞市等地。2019年与2015年相比,臭氧污染相对较高的地区范围显著扩大,京津冀城市群、山东半岛城市群、长三角城市群及中原城市群的臭氧污染进一步加剧,部分城市如邯郸、郑州、开封、焦作、濮阳、徐州等城市臭氧浓度显著上升。中国主要的城市群地区,面临着细颗粒物PM2.5污染和臭氧污染的双重压力,空气污染治理任务依然艰巨。
3.2 中国城市空气质量影响因素分析
3.2.1 各污染物之间相互影响关系 为进一步理解城市间不同种类空气污染物的时空耦合效应,根据前文中的公式(2)构建面板回归模型,对污染物之间的相互作用关系进行量化分析。从各模型的拟合结果(表2)来看,R2值均在0.7以上,模型总体拟合优度较好,且均适宜采用个体固定效应模型进行运算。多数污染物之间存在显著的正向影响关系,表明污染物之间具有显著的关联效应和增强效应;其中,CO、NO2、SO2、PM2.5、PM10之间的正向影响关系格外显著。O3_8h浓度与CO、PM2.5、SO2浓度之间存在显著负向影响关系;与NO2、PM10浓度存在显著正向影响关系。各污染物浓度均与NO2浓度之间存在显著正向影响关系,表明氮氧化物与其他污染物之间存在复杂的反应关系,控制其污染水平对于提升空气质量较为关键。PM10与PM2.5两类颗粒物的浓度在99%的置信水平下呈显著的正向影响关系,表明二者的相互影响表现为增强效应。PM2.5浓度与NO2、SO2浓度呈显著的正向影响关系,大气反应生成的硫酸盐、硝酸盐、铵盐等无机化合物可在一定条件下形成PM2.5,相互之间存在明显的二次转化过程[41],进一步表明PM2.5污染演化机理的复杂性。Tab. 2
表2
表2城市6种空气污染物之间相互影响关系的面板回归模型结果
Tab. 2
| 变量 | CO | NO2 | O3_8h | PM10 | PM2.5 | SO2 |
|---|---|---|---|---|---|---|
| CO | - | 2.397*** | -11.662*** | 3.228*** | 0.808 | 15.944*** |
| NO2 | 0.00470*** | - | 0.636*** | 0.320*** | 0.0787** | 0.150*** |
| O3_8h | -0.00305*** | 0.0848*** | - | 0.0586*** | -0.0373*** | -0.171*** |
| PM10 | 0.000197*** | 0.0997*** | 0.137*** | - | 0.489*** | 0.0458 |
| PM2.5 | 0.00124 | 0.0616** | -0.219*** | 1.229*** | - | 0.349*** |
| SO2 | 0.0100*** | 0.0482*** | -0.412*** | 0.0473 | 0.144*** | - |
| Constant | 0.681*** | 8.467*** | 89.084*** | 5.296** | 3.576** | -4.619** |
| Observations | 1430 | 1430 | 1430 | 1430 | 1430 | 1430 |
| R2 | 0.861 | 0.935 | 0.741 | 0.972 | 0.965 | 0.878 |
| 变量个数(个) | 286 | 286 | 286 | 286 | 286 | 286 |
新窗口打开|下载CSV
3.2.2 基于随机森林模型的自然和社会经济影响因素 本文分别将CO、NO2、O3_8h、PM10、PM2.5、SO2年均浓度作为被解释变量,以图1中所列的变量作为解释变量构建6个回归分析模型,以解析主要的自然和社会经济因子对城市空气质量的影响作用。因2019年的解释变量中,社会经济统计数据滞后故缺失较多,因此建模分析时段为2015—2018年。采用随机森林模型对城市空气污染物的影响因素进行分析,其中,随机森林的参数决策树数量ntree选取依照带外误差较小同时计算量较小的原则,特征数量mtry选取依照平均误差最小的原则。结果表明,对应6类大气污染物浓度的6个模型,其拟合度分别为63.05%、77.59%、56.63%、82.50%、76.78%、61.81%,总体拟合优度较好。
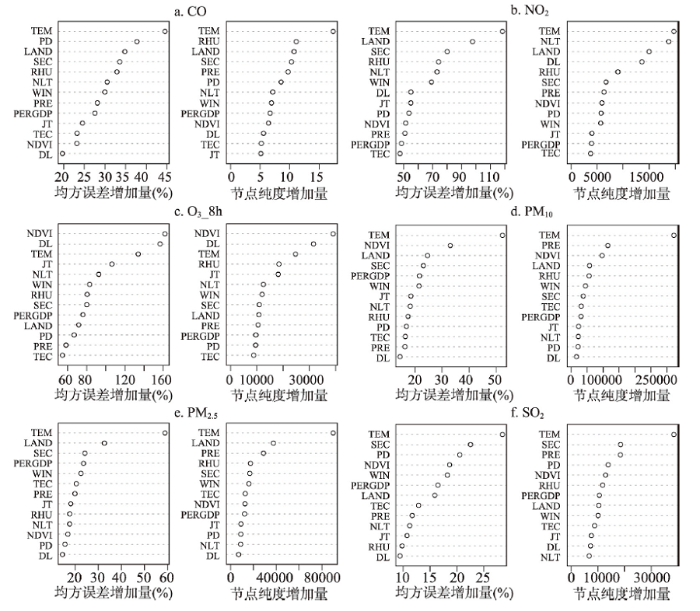
图5为6种污染物分别作为被解释变量时,随机森林方法对13个影响因素的重要性排序结果。其中,均方误差增加量是对每一变量值进行随机赋值,随机森林模型的估算误差较原来误差的增加量;节点纯度增加量表明变量对各个决策树节点的影响程度,两种方法均是值越大表明变量的重要性越强[42]。两种方法的侧重点各有差异,但如果两种方法中排序均靠前的影响因素,可以判定该因素为主导影响因子。整体来看,气象因素对于污染物的影响程度相对较高;社会经济因素中科技投入水平对于各污染物浓度的影响较小,这是因为技术转化需要一定的时间,存在一定的滞后性,在短时间内并未表现出较大影响。
图5
 新窗口打开|下载原图ZIP|生成PPT
图5城市6种空气污染物相关影响因子的重要性排序
Fig. 5Importance ranking of the impact factors on six urban ambient air pollutants
囿于文章篇幅,本文仅提取各污染物影响强度较大的前4位因素进行详细分析,分析中重点参考均方误差增加量的排序结果。汇总来看,气象因素中年均气温对于除O3_8h外其余5种空气污染物浓度的影响最大,植被指数对于O3_8h、PM10和SO2浓度影响较强;社会经济影响因素中土地城市化对于除O3_8h、SO2外的其余污染物的影响普遍较强,影响强度排名均在第2、3位;二产比重对于CO、NO2、PM2.5、SO2、PM10浓度影响较大,其影响程度仅次于城市化因子;电力消费、交通因素对于O3_8h污染物影响较大。分污染物来看,CO浓度影响因素作用强度的排序为年均气温>人口密度>土地城市化>二产比重(图5a);区别于其他污染物,自然因素中除年均气温外,相对湿度对于NO2浓度影响较强(图5b);O3_8h的浓度影响因素排序为植被指数>电力消耗量>年均气温>交通(图5c);PM10浓度受自然因素中的年均气温、植被指数的影响最大,社会经济因素中土地城市化及二产比重对其影响较大,CO、NO2、PM2.5表现出类似特征(图5d);图5e揭示了对PM2.5浓度影响作用最大的4个因素中除年均气温外,其余3个主导因子均为社会经济因素,即土地城市化水平、二产比重和经济发展水平;对于SO2而言,除却气温和植被指数外,人口密度、二产比重对其影响作用相对较大(图5f)。
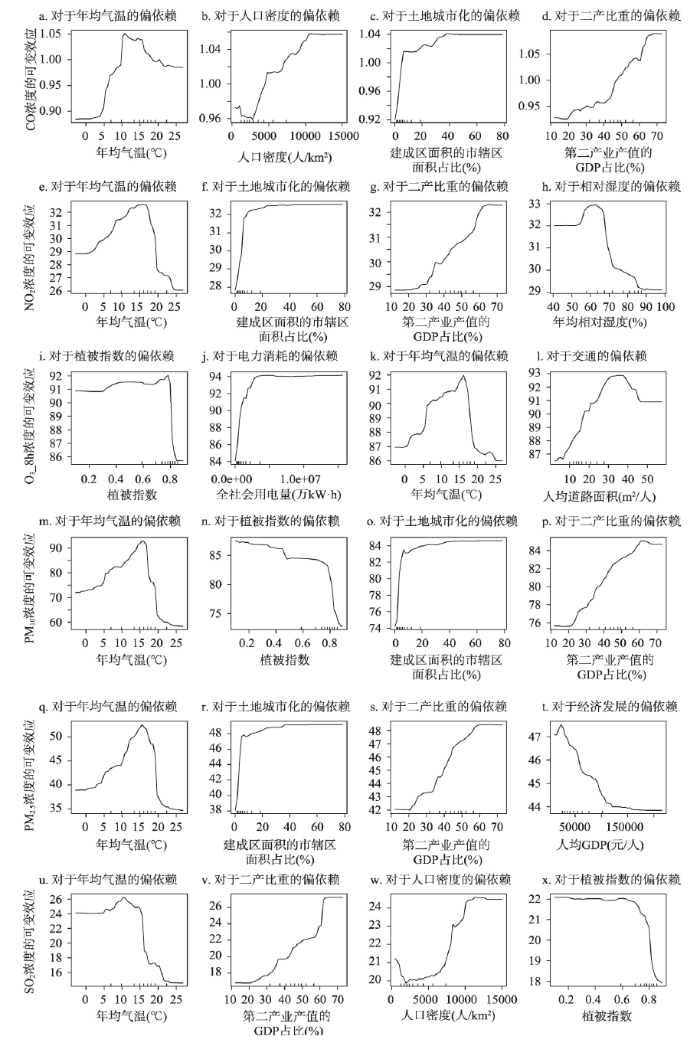
为进一步探究主导影响因素的作用强度,本文利用影响因子偏依赖图来展现差异性,结果如图6所示,其中仅列出6种大气污染物前4位影响因子的作用结果。由图6可知,影响因素与污染物浓度之间呈非线性响应关系。从自然因素来看,年均气温对于各污染物浓度的影响呈“先上升后下降”的非线性趋势,各污染物浓度响应突变的阈值有所差异。以气温为例,当年均气温低于< 15 ℃时,NO2、O3_8h、PM10、PM2.5浓度随气温升高其浓度也逐渐升高;当年均气温> 15 ℃时,上述污染物浓度随气温升高其浓度逐渐降低;而CO、SO2浓度则在< 10 ℃时呈上升的正向响应,在> 10 ℃时呈下降的负向响应。NO2浓度对于相对湿度呈“先平稳后上升再下降”的响应关系,当相对湿度约在54%~64%,随着相对湿度的增加,NO2浓度显著上升。O3_8h、PM10、SO2浓度对于植被指数的响应趋势有所差异,其中O3_8h浓度随植被覆盖度的提升呈“先波动上升后急剧下降”的响应趋势;究其原因,植被指数提高有助于降低风速、阻碍污染物的跨区域传输、促进颗粒物的沉降,可显著降低大气中污染物浓度,与其他****对此的研究结论一致[26, 43-44]。
图6
 新窗口打开|下载原图ZIP|生成PPT
图6城市6种空气污染物影响因素偏依赖图
Fig. 6Plots of partial dependence of the impact factors on six urban ambient air pollutants
从社会经济因素的角度,CO、NO2、PM10和PM2.5浓度对于土地城市化因素响应呈“先上升后稳定”的趋势,即当城市化水平由较低水平逐步提高时,其产生的大气环境污染效应不断上升;当城市化水平较高时,城市扩张特征变弱,因此当其对于大气污染的影响程度达到最大后,其影响强度保持相对稳定状态。CO、NO2、PM10、PM2.5和SO2浓度对二产比重的响应均为正向,且在二产比重超过20%后进入加速影响期;表明二产比重的增加会加剧多种大气污染物的浓度的增加,判断其原因为工业化加速期重化工业的发展引致大气污染物排放强度的增加。CO、SO2浓度对于人口密度的响应呈“先波动下降后波动上升再稳定”的趋势,二者浓度对应的人口密度响应突变阈值分别约为3200 人/km2、1800 人/km2;人口密度适度增加使得人类活动强度加强,但此时大气环境具有一定的承载力,并不会造成大气污染的同步加重;而当人口密度超过阈值时,此时大气承载能力达到一定上限,加之生产和生活活动强度持续引致污染物排放强度的增大,致使大气污染加剧。O3_8h浓度对全社会用电量呈“逐渐上升”的正向响应;O3_8h浓度对于交通的响应呈“先上升后下降”的趋势,其机理可能与机动车尾气排放的氮氧化物复合污染和二次污染有关。PM2.5浓度与城市经济发展水平呈“先正向后负向”的响应趋势,表明经济发展与环境保护并非对立关系,通过提升经济发展质量,可以实现经济发展与环境保护的协调统一;该结果与环境库兹涅茨曲线倒“U”型观点相吻合,但有待于更多论据的支撑及后续研究的进一步验证。
3.2.3 环境规制因素的影响 环境规制和规划调控对于城市空气质量综合治理起着重要的引导和调控作用。2007年国务院发布的《国家环境保护“十一五”规划》中明确了113个城市为环保重点城市,对这些重点城市和城市群地区的大气污染进行综合防治。2014年以来,中央先后出台了《国家新型城镇化规划》《生态文明体制改革总体方案》以及各类环境规划,实施的“关、停、并、转”等短期管控措施以及结构优化与经济转型等长期发展战略,均对环境质量产生影响。本文通过对比113个环保重点城市及173个非环保重点城市2015—2019年空气污染物浓度的变化量来反映环境规制因素对于空气质量的综合影响。2019年与2015年相比,113个环保重点城市除O3_8h外其余污染物浓度下降幅度均高于非环保重点城市(表3),表明区域环境规制措施对于多数污染物的控制具有显著作用。但当前区域环境规制因素对于O3污染的治理成效相对不明显,这与O3本身是典型的二次型污染物相关,其前体物来源较广,当前环境政策对于其前体物之间的协同影响控制作用有限。
Tab. 3
表3
表32019年相较于2015年城市6种空气污染物浓度变化量(按城市分类)
Tab. 3
| 污染物浓度 | CO (mg/m3) | NO2 (μg/m3) | O3_8h (μg/m3) | PM10 (μg/m3) | PM2.5 (μg/m3) | SO2 (μg/m3) | |
|---|---|---|---|---|---|---|---|
| 变化量 | 环保重点城市 | -0.278 | -3.624 | 10.228 | -23.512 | -14.384 | -16.140 |
| 非环保重点城市 | -0.269 | -1.926 | 9.457 | -18.305 | -12.302 | -13.277 | |
| 变化率 (%) | 环保重点城市 | -25.29 | -10.3 | 12.13 | -25.18 | -26.56 | -58.38 |
| 非环保重点城市 | -25.92 | -7.10 | 11.54 | -21.84 | -24.84 | -54.19 | |
新窗口打开|下载CSV
汇总上述第3部分的分析结果,城市空气质量受自然因素和社会经济因素的综合影响,与此同时也受不同种类污染物之间的相互影响和作用。因影响因素多样且污染物种类较多,本文对于城市空气污染物的影响因素进行梳理,结果如图7所示。各类空气污染物浓度的主导影响因素有一定的相似性,但也表现出较大的差异性。自然因素中年均气温是各污染物的主导影响因素之一,植被指数、年均相对湿度、降水、风速等为特定污染物的主导因素;社会经济影响因素中,土地城市化、二产比重为影响各污染物浓度的主导因素,人口密度、电力消耗、交通等对部分污染物浓度的影响强度较大。
图7
 新窗口打开|下载原图ZIP|生成PPT
图7城市空气污染主导因子归因分析结果示意图
Fig. 7Diagrammatic sketch of core impact factors on urban ambient air pollutants
4 结论与讨论
4.1 结论
城市大气环境是一个多尺度、多要素复合作用的系统,要素间的驱动关系和互馈机理复杂。本文基于2014—2019年中国环境监测总站分时站点监测数据,利用CO、NO2、O3、PM10、PM2.5、SO2共6种大气污染物浓度,全面刻画中国286个地级以上城市的大气污染特征,并尝试对城市大气污染物的影响因素及主导因子进行探讨。研究结论如下:(1)研究期内,中国城市大气污染整体改善。6种分项空气污染物中,除O3_8h外,其余5种空气污染物浓度均呈下降趋势,其中SO2的降幅最大;O3浓度总体呈现上升趋势,其驱动机制有待于深入研究。传统煤烟型空气污染问题有明显改善,但在城市间存在显著差异,部分资源型重工业城市SO2和CO浓度依然偏高。多数城市主要存在的是大气颗粒物、氮氧化物和O3的污染问题;典型的重污染区空间范围有所减小,但京津冀晋鲁豫等城市和部分大都市区的空气污染问题仍然突出。
(2)6种空气污染物浓度之间存在显著的相互影响关系,城市空气复合污染特征明显。多数污染物之间存在显著的正向影响关系,表明污染物之间具有显著的关联效应和增强效应。空气污染物之间相互作用产生的二次污染,加大了空气污染的治理难度,对联防联控和综合治理提出了新的要求。
(3)自然因素和社会经济因素对不同种类空气污染物浓度的影响差异较大,且与污染物浓度之间存在非线性响应关系。自然因素中,城市年均气温与空气污染物浓度的关联强度最大,其次是植被指数。社会经济影响因素中,土地城市化水平和二产比重是主导影响因子,其次是电力消耗总量和交通因子。偏依赖分析法进一步刻画了不同污染物浓度与主导影响因子的响应突变阈值。本文结论进一步支持了在自然本底和城市环境容量的约束下,人类生产和生活方式与区域环境质量之间存在复杂的互馈效应,未来需要针对关键的社会经济影响因子,开展更有针对性的理论探索和实证研究。
4.2 讨论
(1)实现城市经济―环境系统的协调与可持续发展,需要对城市化多维过程进行解构,只有从人口、土地、经济与社会等多维度采取科学应对措施,才能推动可持续发展目标的实现。城市空气污染是自然因素与人文因素共同作用下产生的,其形成和演化的机制十分复杂,需要从多学科思维角度深入探讨。特别是中国提出“碳达峰”和“碳中和”目标后,城市地区面临碳减排和大气污染防控等多重目标,未来研究中应进一步加强自然与人文学科的交叉融合,构建跨学科的思维体系和研究视角,以规划设计切实可行的城市全面可持续发展实现路径。(2)本文结果表明,自然因素中,气温、植被覆盖度对城市空气污染状况的影响强度排序靠前;而风速、降水等因素可能短时作用强度明显,但取年均值后其综合作用强度排序靠后。未来全球气候变化和增暖效应会影响城市空气污染治理的大尺度环境,人类可通过建设海绵城市、植树造林、改善城市微循环、减缓城市热岛效应等多种方式调适城市自然环境因子的变化幅度,从而提高城市空气污染治理成效。
(3)社会经济活动因子中,城市化、工业化、交通和能源消耗仍旧是影响城市空气污染物浓度的主导因子。研究中揭示出关键影响因子的阈值效应,如人口密度为1800 人/km2和3200人/km2存在的拐点效应等,对于规划调控具有直接的参考价值。未来可进一步对城市进行分类分级研究,探究不同等级城市空气污染物影响因素的差异性,进行精准决策。以经济高质量发展为契机,有效发挥政策调控和规划引导的机制,促进社会经济空间布局的优化和产业结构的升级,从而实现经济发展与环境质量的全面改善。
(4)区域经济―环境系统是多尺度耦合的复合体。未来可开展多区域尺度分析和交叉验证;可考虑增加解释变量、延长研究时段和增加研究样本,并结合机器学习等新方法和大数据分析等手段,进一步拓展研究视角,以深入理解城市化地区高质量发展的实现机制,并为制定更加精准高效的治理对策提供参考。
参考文献 原文顺序
文献年度倒序
文中引用次数倒序
被引期刊影响因子
[本文引用: 1]
[本文引用: 1]
[本文引用: 1]
[本文引用: 1]
[本文引用: 1]
[本文引用: 1]
[本文引用: 1]
[本文引用: 1]
DOI:10.11821/dlxb201608006 [本文引用: 1]

Air pollution is a serious problem brought by the rapid urbanization and economic development in China, imposing great challenges and threats to population health and the sustainability of the society. Based on the real-time air quality monitoring data obtained for each Chinese city from 2013 to 2014, the spatio-temporal characteristics of air pollution are analyzed using various exploratory spatial data analysis tools. With spatial econometric models, this paper further quantifies the influences of social and economic factors on air quality at both the national and regional scales. There are several important findings: (1) During 2013 and 2014, the number of days with air quality meeting the national standard are increasing, but the annual air quality is getting worse, which is evidenced by a significant increase of AQI values during the period (higher AQI values representing worse air quality). There also appear to be substantial regional variations in the sense that air quality tends to be better in the south and east of China compared with the northern and western China. In terms of temporal patterns, air quality in Chinese cities shows significant seasonal variations, with better-than-average air quality observed during summer and autumn while worse-than-average air quality in spring and winter. (2) With respect to the driving forces of air quality variations, energy consumption, industrialization, investment in technology, and economic development (per capita GDP) have been found to be statistically significantly associated with air quality at the national scale. For example, 1% increase in per capita GDP is related to a decrease of about 0.24% in AQI values (thus better air quality), everything else equal. (3) There is great heterogeneity in the driving forces of air quality among different regions. For instance, whilst one unit increase in industrialization rates (that is an increase of one percentage) is associated with 10.4% increase in AQI values at the national scale, the same amount of increase in industrialization rates is associated with 125.5% and 37.5% increases in AQI values in the Beijing-Tianjin-Hebei metropolitan areas and the Yangtze River Delta, respectively. Such spatial heterogeneity has also been observed in the associations between air quality and energy consumption, investment in technology and per capita GDP, implying that geography should be taken into account in the future exploration of the relationships between economic development and air quality or general environmental pollution issues and in the design and implementation of government policies targeting air pollution deductions and sustainable development.
[本文引用: 1]
DOI:10.13249/j.cnki.sgs.2020.02.004 [本文引用: 1]
Cross-regional air pollution control is an urgent problem in ecological civilization construction. Based on the daily air quality index (AQI) data of 343 districts in China in 2015, used the statistical analysis and spatial autocorrelation analysis method, the temporal and spatial distribution features of air quality in China and nine regions of the terrestrial surface system was analyzed. The results show that: 1) The seasonal mean values of AQI in the whole country and nine major regions show the air quality is worse in spring, is excellent in summer and autumn, and falls to its worst in winter. Meanwhile, the seasonal mean values of AQI show a “U” shape. 2) The monthly mean values of AQI in the whole country and nine major regions show a “L” shape. 3) The daily mean values of AQI in the whole country and nine major regions show a periodic W-pulse fluctuation pattern. 4) The “hot spot” and “cold spot” regions demonstrate the differential pattern of being high and hot in the North and being low and cold in the South. 5) The frequency structure of the primary pollutant in the nine regions is significantly diversified, and the highest frequency of the primary pollutant PM2.5 or PM10 has a clear differential pattern between the East and the West.
[本文引用: 1]
DOI:10.1016/j.atmosenv.2015.08.040URL [本文引用: 1]
DOI:10.1016/j.apr.2020.03.010URL [本文引用: 1]
DOI:10.11821/dlxb201912014 [本文引用: 2]
As the main form of China new urbanization, urban agglomerations are the important platform to support national economic growth, promote regional coordinated development and participate in international competition and cooperation, but they are also the core area of air pollution. This paper selects PM2.5 data from NASA atmospheric remote sensing image inversion from 2000 to 2015, and uses GIS spatial analysis and Spatial Durbin Model to reveal the temporal and spatial evolution pattern characteristics and main controlling factors of PM2.5 in China's urban agglomerations. The main conclusions are as follows: (1) From 2000 to 2015, the PM2.5 concentration of China urban agglomerations showed a volatility growth trend. In 2007, there was an inflection point. The number of low-concentration cities declined, and the number of high-concentration cities increased. (2) The concentration of PM2.5 in urban agglomerations was in the pattern of high in the east and and low in the west, with the "Hu Huanyong Line" as the boundary. The spatial difference between urban agglomerations is significant, and the difference is increasing. The concentration of PM2.5 is growing faster in urban agglomerations in the eastern and northeastern regions. (3) The urban agglomeration of PM2.5 has a significant spatial concentration. The hot spots are concentrated to the east of the "Hu Huanyong Line", and the number of cities continues to rise. The cold spots are concentrated to the west of the "Hu Huanyong Line", and the number of cities continues to decline. (4) There is a significant spatial spillover effect of PM2.5 pollution among cities within urban agglomerations. The main controlling factors of PM2.5 pollution in different urban agglomerations have significant differences. Industrialization and energy consumption have a significant positive impact on PM2.5 pollution. Foreign direct investment has a significant negative impact on PM2.5 pollution in the southeast coastal and border urban agglomerations. Population density has the significant positive impact on PM2.5 pollution in the region, and has the opposite result in the neighbouring areas. Urbanization level has a negative impact on PM2.5 pollution in national-level urban agglomerations, and has the opposite result in regional and local urban agglomerations. The high degree of industrial structure has a significant negative impact on PM2.5 pollution in the region, and has the opposite result in the neighboring regions. Technical support has a significant impact on PM2.5 pollution, but there are also lag effects and rebound effects.
[本文引用: 2]
[本文引用: 1]
[本文引用: 1]
DOI:10.2307/142511URL [本文引用: 2]
[本文引用: 2]
DOI:10.1007/s11769-017-0900-zURL [本文引用: 1]
DOI:10.1016/j.jclepro.2018.10.284URL [本文引用: 1]
[本文引用: 1]
[本文引用: 1]
[本文引用: 1]
[本文引用: 1]
[本文引用: 1]
[本文引用: 1]
[本文引用: 1]
[本文引用: 1]
[本文引用: 2]
DOI:10.1016/j.jclepro.2017.07.127URL [本文引用: 1]
[本文引用: 1]
[本文引用: 1]
[本文引用: 1]
[本文引用: 1]
[本文引用: 1]
[本文引用: 1]
[本文引用: 1]
[本文引用: 1]
DOI:10.13249/j.cnki.sgs.2018.03.004 [本文引用: 1]
The issue of air pollution in China has already surged in recent years, attracting public concerns, even great anxiety. This paper employs a unique cross-sectional data set of 150 Chinese cities in 2014 and adopts air quality index (AQI), an indicator newly-developed by the ministry of environmental protection of China, to measure air quality. Then, from a spatial heterogeneity perspective it applies ordinary least square (OLS) technique and geographically weighted regression (GWR) model to analyze the impact of foreign direct investment (FDI) on air pollution controlling for other five explanatory variables, namely, per capita GDP, population density, sulfur dioxide emissions, PM2.5 concentration, and the number of vehicles. Meanwhile, it also investigates if there is an inverted U-shaped curve between per capita GDP and air quality index, specifically environmental Kuznets curve (EKC). The findings are the following. Firstly, there is no evidence of EKC, but an increasing linear relationship between income and air pollution. Secondly, the variable of FDI is found to be significant and negative, indicating that an increase of foreign capital may reduce air quality index, in other words, improve air quality. This is because foreign capital brings advanced technologies, improving air quality effectively. Besides, sulfur dioxide emissions and PM2.5 concentration are found to have significant and positive impacts on AQI while population density, as an indicator of environmental awareness, is found to have a negative impact on AQI. However, from the results of the OLS model, the variable of private cars is not statistically significant, even found to be positive. It hence was deleted from the model. Thirdly, the GWR model results suggest that the impacts of FDI of 150 cities on air pollution greatly vary from city to city. Specifically speaking, foreign capitals of the northeastern cities, Guangzhong plain urban cities and cities of the middle reaches of the Yangtze River play a more important role in reducing air pollution than those of other cities. On the contrary, the contribution of foreign capitals of Shandong peninsula cities and Sichuan-Chongqing urban cluster is found to be insignificant. Finally, from the above analysis, a series of policy handles and suggestions are given.
[本文引用: 1]
[本文引用: 1]
[本文引用: 1]
DOI:10.11821/dlxb201801015 [本文引用: 2]
Air pollution is now the most serious environmental problem in China, especially for Beijing-Tianjin-Hebei (Jing-Jin-Ji) urban agglomeration. Under the background of Jing-Jin-Ji integrated development, it is of great importance to study the spatio-temporal distribution and its influencing factors. This paper firstly analyzed the spatio-temporal characteristics of PM2.5 concentration in 202 counties of Jing-Jin-Ji urban agglomeration using spatial analysis and visualization. Then we quantified the effect degree of different natural and human factors and the spatial spillover effect of these factors using Spatial Durbin Model (SDM). The results are as follows: (1) The PM2.5 concentration was on the rise as a whole from 2000-2014, and it was high in autumn and winter, while low in spring and summer. Seen from spatial distribution, the PM2.5 concentration was high in the southeast, while low in the northwest of the study area, and the concentration in urban built-up area was 10-20 μg/m3 higher than that of its surrounding suburban and rural areas. (2) The counties, whose PM2.5 concentration was below 35 μg/m3, only accounted for 13.9% in 2014. There were significant spatial agglomeration and diffusivity of PM2.5, and the mean distance interacting among the cities was 200 km. The PM2.5 of a city increased by more than 0.5% for every 1% increase in the average PM2.5 of neighboring cities. (3) Socio-economic factors have positive impact on PM2.5, and most of natural factors have negative impact. (4) Among the influencing factors, contributions to local atmospheric pollution with direct effect are: mean wind speed > annual mean temperature > population density > relief amplitude > the secondary industry share of GDP > energy consumption > vegetation coverage; however, per capita GDP, annual precipitation, and relative humidity have no significant effect on local pollution. (5) Contributions to neighborhood atmospheric pollution with spatial spillover effect are: vegetation coverage > relief amplitude > population density. The findings suggest that we should adopt the adaptation strategies for natural factors and control strategies for human factors. A coordinated and strengthened cooperation between local governments should be established for air pollution control, and environmental planning and legislation should be strengthened in a new round of urban agglomeration planning in China.
[本文引用: 2]
DOI:10.13249/j.cnki.sgs.2018.12.019 [本文引用: 1]
Based on a cross-sectional data at the city level in the Yangtze River Economic Belt, this paper firstly employs the exploratory spatial data analysis method to investigate the spatio-temporal variation characteristics of air quality index (AQI) of 126 cities in 2015, and then applies the Bayesian spatial econometric model to explore the socio-economic driving factors of air quality index of the Yangtze River Economic Belt. The findings are the following: 1) The distribution of the annual average AQI values in the Yangtze River Economic Belt exhibits a significant spatial cluster pattern, specifically high AQI values in the north and low AQI values in the south. Moreover, the hot spot analysis results show that the most polluted areas are mainly Jiangsu province, the northern Zhejiang province, Shanghai and the most areas of northern Anhui province while Yunnan province, Panzhihua city of Sichuan and the most areas of Guizhou province show better air quality. 2) Regarding the seasonal characteristics of AQI values in the Yangtze River Economic Belt, it also shows a typical seasonal characteristic, specifically, high AQI values in both winter and spring, and low AQI values in both summer and autumn. Overall, during the whole year high AQI values are mainly concentrated on Hubei province, Anhui province and Jiangsu province while low AQI values on Yunnan province. 3) The Bayesian spatial lag model indicates that the urban AQI values of the Yangtze River Economic Belt show significant spatial spillover effects. Moreover, the environmental Kuznets curve hypothesis has been verified, indicating that as GDP per capita increases, air quality worsens. However, when GDP per capita continues to increase, air quality becomes better. Besides, the coefficient of FDI variable is significant and positive, indicating the pollution haven hypothesis. Finally, the increase in population density and highway passenger transportation are important driving factors worsening air quality while the higher proportion of the tertiary industry and green coverage ratio improvements contribute to improving air quality of the Yangtze River Economic Belt.
[本文引用: 1]
[本文引用: 1]
[本文引用: 1]
DOI:10.1007/s11442-018-1491-zURL [本文引用: 2]
DOI:10.11821/dlyj201504002 [本文引用: 1]
In 2014, the "National New Urbanization Planning" was issued, which indicates that China's urbanization has entered into a transition period from "quantity growth" to "quality improvement". New urbanization will be an important work for the future China in quite a long period of time, which provides a significant opportunity for urbanization field research. This paper gives a general review on the domestic and foreign research progress in time. Internationally, the basic theory and theoretical system of urbanization have come into being. They have been enriched gradually with the deepening of the research. The research field has been expanded. The research methods have been improved. As for China's urbanization research, it developed fast despite a late start, and has made remarkable achievements in many fields, such as the scientific cognition and thoughts of a reasonable urbanization process with Chinese characteristics. In the future, five front scientific issues and their sub-issues in urbanization research have been put forward, such as the interdisciplinary features of urbanization and the establishment of urbanization discipline; the concept, principle, and method of the construction of urbanization basic theoretical system; the regional characteristics of urbanization and relationships between urban and rural integration; the developing model and spatial pattern research of sustainable development; the integration research and simulation platform of urbanization system based on the big data.
[本文引用: 1]
DOI:10.11821/dlxb201912012 [本文引用: 2]
As the Chinese government ratified the Paris Climate Agreement in 2016, the goal of reducing carbon dioxide emissions per unit of gross domestic product (carbon intensity) from 60% to 65% of 2005 levels must now be achieved by 2030. However, as numerous factors influence Chinese carbon intensity, it is key to assess their relative importance in order to determine which are most important. As traditional methods are inadequate for identifying key factors from a range acting simultaneously, machine learning is applied in this research. The random forest (RF) algorithm based on decision tree theory was proposed by Breiman (2001); this algorithm is one of the most appropriate because it is insensitive to multicollinearity, robust to missing and unbalanced data, and provides reasonable predictive results. We therefore identified the key factors influencing Chinese carbon intensity using the RF algorithm and analyzed their evolution between 1980 and 2014. The results of this analysis reveal that dominant factors include the scale and proportion of energy-intensive industries as well as fossil energy proportion and technical progress between 1980 and 1991. As the Chinese economy developed rapidly between 1992 and 2007, effects on carbon intensity were enhanced by service industry proportion and the fossil fuel price such that the influence of traditional residential consumption also increased. The Chinese economy then entered a period of deep structural adjustment subsequent to the 2008 global financial crisis; energy-saving emission reductions were greatly enhanced over this period and effects on carbon intensity were also rapidly boosted by the increasing availability of new energy and its residential consumption. Optimization of energy and industrial structures, promotion of technical progress, green consumption, and the reduction and management of emissions will be key to cutting future carbon intensity levels within China. These approaches will all help to achieve the 2030 goal of reducing carbon emission intensity from 60% to 65% of 2005 levels.
[本文引用: 2]
[本文引用: 1]
[本文引用: 1]
[本文引用: 1]
[本文引用: 1]
[本文引用: 1]
[本文引用: 1]
[本文引用: 1]
[本文引用: 1]
DOI:10.1016/j.apenergy.2018.09.200URL [本文引用: 1]
DOI:10.11821/dlyj201404003 [本文引用: 1]
Energy is an important support of the development of the national economy. Getting dynamic information of the total energy consumption, conveniently and accurately, has important reference significance(s) for making energy policy, rationally. Using DMSP/ OLS nighttime lights data, this paper simulates the spatiotemporal pattern of energy consumption among the cities of Chinese mainland from 1995 to 2009, in a prefecture-level city scale; the application of spatial autocorrelation method reveals the spatial and temporal characteristics of the energy consumption in Chinese mainland during the study period. The results show that: simulating energy consumption among prefecture-level cities in China based on DMSP/OLS Nighttime Light is feasible. DMSP/OLS nighttime lights data can reflect the spatial and temporal dynamics of energy consumption more reliably. The energy consumption of most cities is lower in Chinese mainland from 1995 to 2009. Lower and middle intensity energy consumption area accounted for 72.66% of the country's total area. High intensity energy consumption areas are mainly located in the eastern part of China. There is a significant spatial aggregation in energy consumption in China (Moran's I index over the years is greater than 0.4). There is a "high-high" aggregation and a "low-low" aggregation phenomenon of energy consumption among prefecture-level cities in China.
[本文引用: 1]
[本文引用: 1]
[本文引用: 1]
DOI:10.1023/A:1010933404324URL [本文引用: 1]
[本文引用: 1]
[本文引用: 1]
[本文引用: 1]
[本文引用: 1]
DOI:10.11821/dlxb201904004 [本文引用: 1]
Clarifying the spatial pattern of population distribution, its influencing factors and regional differences at the township level is of great guiding significance for formulating sustainable development policies in ecologically fragile areas. Based on the population census data of Tibet at the township level in 2010, the population density and spatial factors were extracted. The density and clustering characteristics of the population distribution were analyzed by spatial statistical method. The multiple linear regression method and the random forest regression method were used to explore the population influencing factors and their regional differences of population distribution. The results showed that: (1) The population density of Tibet at the township level showed a strong spatial non-equilibrium. The general trend was high in the southeast and low in the northwest, and there was a strong spatial coupling between the main rivers and the main traffic trunks in high density area. (2) The "core-edge" characteristic of population clustering was obvious, and roughly to the wave of Borong (Nyalam County)-Gangni (Anduo County) as the demarcation line. (3) In the multiple linear regression method, the artificial surface index had the greatest influence on the population distribution, followed by the nighttime light index and road network density. (4) Random forest method was more accurate than multiple linear regression method to predict the population density, which can be used to sort the importance of the influencing factors. The influencing factors of the first six factors were the night light index, artificial surface index, road network density, industrial output value, GDP and multi-year average temperature, and these factors were positively correlated with population density. Among topographic factors, the contribution rate of elevation and slope was the largest, which was negatively correlated with population density. (5) The influencing factors and their interactions of population distribution in Tibet showed obvious regional differences. The valley was a gathering area for population in the study region, mainly in Lhasa River Valley, Nianchu River Valley and Sanjiang River Valley. (6) Through the analysis of random forest regression, the conceptual model can be used to express the influencing factors of population distribution, and the dominant factors were summarized as land use structure, road accessibility and urbanization level.
[本文引用: 1]
[本文引用: 1]
[本文引用: 1]
PMID:23755507 [本文引用: 1]
Both inhalable particulate matter (PM10) and fine particulate matter (PM2.5) are not only one of the main causes of air pollution, but also the primary pollutants in most cities. Based on the analysis of the impacts of PM10 and PM2.5 on the environment and human health, this paper summarized the components, sources, and mass concentration variations of PM10 and PM2.5 and related affecting factors, and introduced the network layout of PM10 and PM2.5 monitoring and its principles and features. The research methods on the removal of PM10 and PM2.5 by forests, the removal rates of PM10 and PM2.5 by different forests, and the related affecting mechanisms were summed up at regional and individual scales, and the existed problems in this research field were discussed. Due to the lack of the comparable observation studies on the atmospheric PM10 and PM2.5 along different gradients and in background areas, the joint effects of multiple factors on the PM10 and PM2.5 concentrations are not revealed. It was suggested that to make a rational network layout of PM10 and PM2.5 monitoring, to correctly select proper monitoring methods, and to compare and calibrate the observed results from classical manual methods would be the bases to guarantee the validity of PM10 and PM2.5 monitoring data. At present, there are few reports about the PM2.5 removal by forests, and it's not clear about the physiological processes and ecological mechanisms of PM10 and PM2.5 removal at cell, tissue, organ, and individual level.
PMID:23755507 [本文引用: 1]
