 ,1,2, 江志猛1,2, 林安琪1,2, 朱文超1,2, 王伟1,2
Analyzing spatial characteristics of urban resource and environment carrying capacity based on Covert-Resilient-Overt:A case study of Wuhan city
WU Hao,1,2, JIANG Zhimeng1,2, LIN Anqi1,2, ZHU Wenchao1,2, WANG Wei1,2收稿日期:2021-02-18修回日期:2021-08-31
| 基金资助: |
Received:2021-02-18Revised:2021-08-31
| Fund supported: |
作者简介 About authors
吴浩(1977-), 男, 湖北黄冈人, 博士, 教授, 研究领域为地理信息科学理论与应用技术。E-mail:

摘要
关键词:
Abstract
Keywords:
PDF (4837KB)元数据多维度评价相关文章导出EndNote|Ris|Bibtex收藏本文
本文引用格式
吴浩, 江志猛, 林安琪, 朱文超, 王伟. 基于隐性—韧性—显性的武汉城市资源环境承载力空间特征. 地理学报, 2021, 76(10): 2439-2458 doi:10.11821/dlxb202110008
WU Hao, JIANG Zhimeng, LIN Anqi, ZHU Wenchao, WANG Wei.
1 引言
自1978年改革开放以来,中国城镇化率提升了42.7%,超过60%的国民人口居住在城市[1,2]。城镇化发展在为居民谋取大量福祉的同时,也滋生了诸如资源收缩、生态退化、环境污染等“城市病”[3]。2020年10月印发的《中共中央关于制定国民经济和社会发展第十四个五年规划和二〇三五年远景目标的建议》将区域可持续发展的核心内容定义为“优化国土空间布局,推进区域协调发展和新型城镇化”,提出了要立足于资源环境承载力和国土空间开发适宜性,合理统筹布局国土空间资源要素、强化底线约束等要求[4]。作为衡量城市可持续发展潜能的标尺[5],资源环境承载力刻画了国土空间可承载人类活动与社会发展的容量上限,对承载力的空间特征进行深入剖析已成为国土空间规划的重要前提[6]。在当前城市国土空间资源要素协同优化的战略背景下,如何通过科学解析城市资源环境承载力系统的深层特征来破解国土空间规划研究与实践的重难点[7,8],助力国土空间资源优化配置目标的高水平落实,是地理科学和资源环境科学研究领域面临的挑战之一。城市是一定地理空间内自然、社会和人类的复合体[9],历史和实践表明,城市可持续发展中面临的未知风险(如极端气象灾害、突发公共事件等)时刻藏于无形,如若未对资源环境承载系统的各类要素作深入的机理识别,城市在风险暴露时便仅能依赖其应急管理系统的“后发补救”,此种模式显然已无法科学匹配城市国土空间多元主体共治的现实需求。《资源环境承载力和国土空间开发适宜性评价技术指南(试行)》(以下简称双评价指南)将城市资源环境系统视为一个由资源禀赋条件、生态环境现状、社会经济水平三要素组成的综合体,承载力指数由各组成要素指标量化值复合而成[10]。随着物联网、人工智能等技术的深入应用,多源时空数据辅助自然资源管理已成趋势[11],双评价指南虽提出了将多源时空数据纳入评价指标体系的理念设想,却尚未作出具体可操作的技术方法指引。新时代中国生态文明思想强调要注重城市发展与治理二者间的平衡[12],资源环境开发与保护的理念宗旨已随之发生深刻变革,“精准预判、源头防控、靶向治理”的思路成为城市国土空间格局优化的新方向[13]。承载力思想最初由Malthus于1798年在《人口学原理》中提出[14],其内涵从最初的生物要素阈值逐步拓展到资源、环境、经济、文化等不同领域要素的系统承载阈值[15],研究主题经历了“资源生产潜力阈值—单项要素限制性阈值—综合阈值”的过程[16],评价体系从单一演变为多元[17],评价方法由定性转变为定性与定量相结合[18]。段春青等[19]、牛方曲等[20]和张引等[21]众多****依据社会生产和生态保护等导向,结合资源环境子系统特征将承载力组成要素归类,开展了资源承载力、环境承载力、生态承载力以及三者集成的综合承载力研究。纵观承载力研究的发展历程,过往研究具有视角集中、可操作性强等共同特点[8],但大多已经与新形势下城市国土空间规划战略的理论模式与实践需求产生了不同程度的脱节,具体表现为:在理论基础方面,鲜见对资源环境组成要素内在作用机理进行全面分析的研究,大多忽略了资源环境要素间的相互联系已伴随社会经济活动强度增大而愈发显著的这一现实,导致研究体系滞后于当下的客观需求;在技术实践方面,过往研究往往采用历史数据开展单一尺度的承载力评价,侧重于比较评价单元间的静态差异,而未考虑承载力组成要素的动态性特征,致使研究成果的现势性难以保证。
面向长江经济带共抓大保护的战略部署[22],本文以国土空间资源优化配置需求快速更迭的湖北省武汉市为例,在双评价指南基础上将城市资源环境承载力分析的指标体系扩充至涵盖自然生态系统、城市治理系统以及人类社会系统在内的多个维度,探寻各系统要素的深层特征及其相互作用机理。首先,通过构建城市资源环境承载力分析理论逻辑框架,从“隐性—韧性—显性”三个维度系统认知资源环境承载力水平,挖掘武汉市资源环境承载力的空间分异特征。其次,将传统空间数据与多源时空数据有机集成,为承载力定量测度输入体量更大、时效性更强的数据源,提升基础数据的精度和研究成果的现势性[23]。最后,在上述内容的基础上形成一套新的城市资源环境承载力空间特征分析理论与方法体系。
2 研究区概况与数据来源
2.1 研究区概况
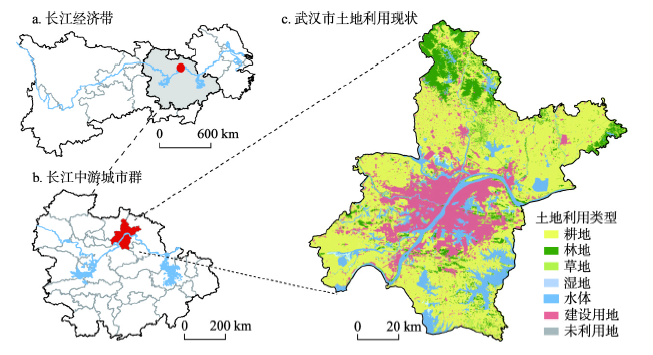
湖北省武汉市位于29°58′N~31°22′N、113°41′E~115°05′E,总面积8569.15 km2,下辖13个区160个街道办事处,据第七次全国人口普查公报,2020年全市常住人口达1232.65万人。武汉市是中国经济地理中心、南北交汇节点,季风性气候显著,域内平川相连、江河纵横、湖港交织,长江与其最大支流汉水交汇于市境中央,湿地、矿产等自然资源禀赋丰裕,农业、工商业、高新产业发达,是长江中游城市群规模最大的城市[24]。“两江三镇、西野东岗、北峰南泽”是武汉市最为突出的地理空间格局特征。近年来,武汉市正向建设成为国家科技创新中心、国家商贸物流中心、国际交往中心而奋进,与快速城市化进程相伴生的资源紧缩、环境污染、灾害频发等问题日渐显著,由此并发的一系列“城市病”已成为制约城市资源环境可持续发展的瓶颈,科学探明资源环境承载系统的深层次特征,对武汉市国土空间格局优化与实现可持续发展的重要性不言而喻[25]。以武汉市为研究区,具有较强的典型性和代表性。图1
 新窗口打开|下载原图ZIP|生成PPT
图1武汉市区位及2020年土地利用现状
Fig. 1Location of Wuhan city and land use in 2020
2.2 数据来源
本文所使用的数据概况如表1所示,分别依据各数据的属性特征进行预处理,具体如下所示:① 多源遥感信息,本文采用的遥感数据包括地理信息公共产品(Globeland30)、数字高程模型(DEM)、MODIS气溶胶光学厚度(AOD)产品、Landsat 8遥感影像归一化植被指数(NDVI)产品、珞珈一号01星(luojia1-01)夜间灯光影像数据产品等,借助ArcGIS和ENVI软件对遥感数据进行校正、投影、提取等处理;② 网络地图服务,基于Python编程语言和在线地图相关应用程序接口服务获取地理兴趣点(POI)、历史交通态势、路径规划等开源时空数据,经标准化处理得到动态、大体量的地理空间信息数据;③ 社交媒体信息,基于Python编程语言爬取和攫选政务信息发布网、中国新闻网、新浪微博等媒体平台的新闻词条信息,经空间化处理获取微观尺度、长时间序列的媒体信息数据;④ 统计等其他数据,采用向有关部门申请和在线下载等方式获取,并进行标准化、空间制图等处理。Tab. 1
表1
表1数据来源
Tab. 1
| 数据类型 | 数据名称 | 来源 |
|---|---|---|
| 遥感数据 | 土地利用 | Globeland 30 |
| 数字高程 | 地理空间数据云 | |
| 归一化植被指数NDVI | Landsat 8遥感影像 | |
| 夜间灯光遥感影像 | 珞珈一号01卫星数据 | |
| MODIS气溶胶光学厚度产品 | NASA戈达德航天中心数据系统 | |
| 土壤数据 | 土壤类型、土壤有机质含量 | 国家地球科学系统数据服务中心 |
| 气象数据 | 降水量、蒸发量、无霜期、太阳辐射 | 国家气象科学数据中心 |
| 地质数据 | 1∶10万县市地质调查数据库 | 中国地质环境监测院 |
| 统计数据 | 《武汉市统计年鉴2018》 | 武汉市统计局 |
| 《武汉市卫生统计年鉴2018》 | 武汉市卫生健康委员会 | |
| 《武汉市水资源公报2018》 | 武汉市水务局 | |
| 人口 | 天地图·武汉/武汉市统计局 | |
| 多源时空数据 | 兴趣点POI | 高德地图API |
| 历史交通态势 | OpenStreetMap/高德地图API | |
| 社交媒体 | 中新网、新浪微博 |
新窗口打开|下载CSV
3 研究思路与方法
3.1 研究思路
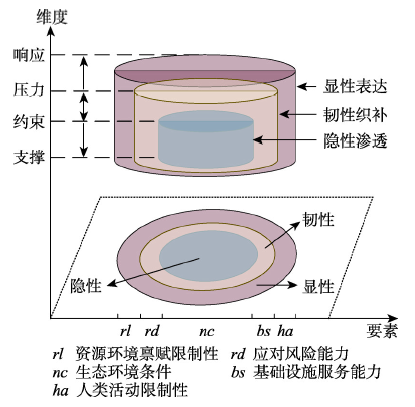
3.1.1 理论框架构建 城市作为复杂的人—地耦合系统,其资源环境组成要素相互作用机理十分复杂。城市资源环境承载力分析的核心要义在于揭示国土空间承载人类活动及经济社会发展强度的潜能大小,具体分析对象包括城市生态系统条件、风险应对能力、资源禀赋和人类活动的限制性等,且这些对象之间存在层层递进、融汇交错、相互影响的关系[26]。本文以双评价指南为基础,结合资源环境承载力分析对象间的层次交互性特征,将城市资源环境承载系统要素整合为隐性、韧性[27]、显性3个维度,刻画各要素在生态系统功能约束下的“隐性渗透”条件、在未知风险应对中“韧性织补”能力以及在外部压力限制下的“显性表达”现状,构建基于隐性—韧性—显性的城市资源环境承载力空间特征分析理论逻辑框架(图2)。图2
 新窗口打开|下载原图ZIP|生成PPT
图2研究理论框架
Fig. 2Research theoretical framework
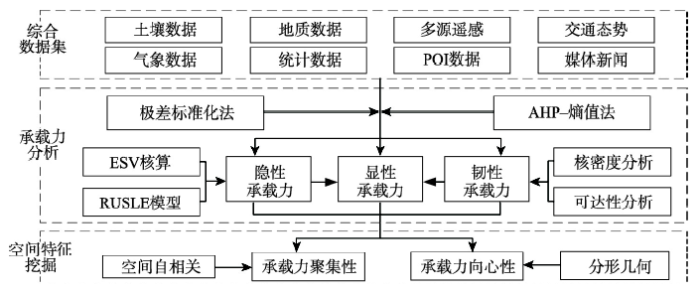
3.1.2 技术路线 在图2所示的研究理论框架中,隐性承载力被视为资源环境支撑要素的潜在载体,是指以生态环境条件为表征的自然要素容量,分析对象为微观尺度的国土空间单元,结果在双评价中的应用指向是总量指标的约束;韧性承载力是资源环境约束条件的弹性表征,旨在以生态环境条件与社会经济水平衡量城市应对各类不确定性风险的能力,分析对象是居民活动的基准范围单元,结果在双评价中的应用方向是空间要素管控与空间用途管制;显性承载力是涵括资源环境全系统要素承载容量的外在表达,由隐性和韧性承载力组成,并受资源环境禀赋和人类活动对环境影响的压力限制,分析对象是以地域为主体的国土空间,结果可为国土空间资源优化配置中土地、水资源等承载要素的协同管控提供参照。本文在双评价指南提供的基础数据体系参照基础上引入夜光和大气遥感影像、POI、历史交通态势、社交媒体等与居民日常生活直接相关的多源时空数据,为配合国土空间资源优化配置的业务化需求,根据区域实际和承载力分析对象属性特征[28],分别采用30 m、2 km、街道3个尺度,运用极差标准化法和AHP熵值法进行权重赋定与指标量化,计算隐性—韧性—显性资源环境承载力指数,进而采用空间自相关和分形几何两种空间计量方法挖掘承载力的空间特征。研究技术路线如图3所示。
图3
 新窗口打开|下载原图ZIP|生成PPT
图3技术路线
Fig. 3Flowchart for this research
3.2 隐性、韧性、显性承载力计算方法
3.2.1 隐性承载力计算 隐性承载力即生态环境支撑要素的容量大小,参考王静等[26]和封志明等[29]的研究,从生态系统服务供给、生态系统风险和生境质量三方面构建隐性承载力计算体系。隐性承载力(RECCc)计算公式如下:式中:生态系统服务供给ES由生态服务功能和水土保持功能经加权综合而得,参照《生态保护红线划定技术指南》,通过核算水源涵养、防风固沙和洪水调蓄3种生态服务功能(ESV)[30,31],并对其进行加权综合来计算生态系统服务功能;采用通用水土流失模型(RUSLE)计算水土保持功能Spro;NPPmean指生态系统净初级生产力均值;K指土壤侵蚀因子;Fslo指坡度。生态系统风险ED通过提取国家地球科学系统数据服务中心数据库产品中的土壤侵蚀和酸雨敏感性数据经加权综合计算而得。生境质量EQ通过生物多样性服务能力指数模型计算而得;Fpre、Ftem指气温参数,由多年平均年降水量数据插值而得;Falt指海拔参数,由单元内海拔高度归一化而得。隐性承载力计算指标体系具体详见表2。
Tab. 2
表2
表2隐性承载力计算指标
Tab. 2
| 目标层 | 准则层 | 指标层 |
|---|---|---|
| 生态系统服务供给(ES) | 生态服务功能 | 水源涵养能力 |
| 防风固沙能力 | ||
| 洪水调蓄能力 | ||
| 水土保持功能 | 土壤保水性 | |
| 土壤有机质含量 | ||
| 植被指数NDVI | ||
| 生态系统风险(ED) | 生态敏感性 | 土壤侵蚀敏感性 |
| 酸雨敏感性 | ||
| 生境质量(EQ) | 生物丰度 | 生物多样性指数 |
新窗口打开|下载CSV
3.2.2 韧性承载力计算 城市韧性的核心要义是城市有效应对各类变化或冲击,抵御或削弱发展过程中不确定性的能力[32],城市韧性的组成因子包含以下3方面:生态环境系统的供给可靠性和承载适配性、社会发展各领域的结构保障性、城市公共服务设施的可达性。参考相关研究[33],结合上文提出的研究理论框架,通过探讨农业生产、经济发展、文化资源等3类城市系统的韧性在城市现有的资源环境支撑基础(即公共服务设施可达性)上的表征状态来分析韧性承载力(RECCr),其计算公式为:
式中:RECCc指隐性承载力;农业生产韧性TA采用生产潜力逐级修订模型测算而得,经济发展韧性TI和文化资源韧性TC依据地理兴趣点POI数据、夜光遥感影像、气象数据、统计数据,采用核密度分析法计算而得;公共服务设施可达性由下文的式(5)、式(6)计算。韧性承载力计算指标体系具体详见表3。
Tab. 3
表3
表3韧性承载力计算指标
Tab. 3
| 目标层 | 准则层 | 指标层 |
|---|---|---|
| 农业生产韧性(TA) | 耕地生产条件 | 光合生产力 |
| 光温生产力 | ||
| 气候生产力 | ||
| 农业发展潜力 | 农业投入 | |
| 农业产值比重 | ||
| 经济发展韧性(TI) | 经济发展潜力 | 企事业单位分布密度 |
| 第三产业比重 | ||
| 高新产业比重 | ||
| 城市化水平 | 人口城镇化率 | |
| 夜间灯光亮度 | ||
| 文化资源韧性(TC) | 科技教育水平 | 科教资源分布密度 |
| 旅游吸引力 | 旅游资源分布密度 | |
| 城市养老保障 | 养老服务能力 | |
| 公共服务设施可达性(PA) | 医疗服务 | 医疗保障可达性 |
| 出行服务 | 交通设施可达性 | |
| 餐饮服务 | 餐饮酒店可达性 | |
| 住宿服务 | 住宿服务可达性 | |
| 文体娱乐 | 文体设施可达性 | |
| 休憩服务 | 公园绿地可达性 |
新窗口打开|下载CSV
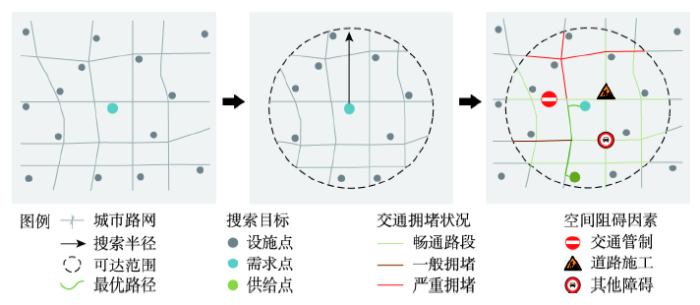
相较于传统可达性研究方法中基于静态几何数据的交通成本估算[34,35],采用网络地图路径规划服务的可达性分析可将复杂的地形地貌、城市路网和交通组合方式等因素综合考量,因而具有较好的客观性和实用性[36]。本文通过调取高德地图路径规划服务API,以2 km为搜索半径,将研究区内各研究单元(网格)的几何中心视为需求点、将各类公共服务设施点视为供给点,通过编写Python语言程序获取出发地(需求点)与目的地(公共设施供给点)之间的行程距离和通行规划时长,将公共服务设施划分为医疗、出行、餐饮、住宿、文体、休憩等6大类[37],据式(5)和式(6)分析6类公共服务设施的可达性。基于高德地图路径规划服务API的可达性分析原理如图4所示。
图4
 新窗口打开|下载原图ZIP|生成PPT
图4基于在线地图API的公共服务设施可达性分析原理
Fig. 4Analysis principle of public service facility accessibility based on online map API
式中:Ti指采样点i的通行耗时(s);tij指采样点i至某类设施其中一个目标点位置所需最优通行耗时;j指采样点10 km范围内某类服务设施的数量;Sblock指街道单元内可达性得分;si指采样点可达性得分;n指街道单元内采样点数量。
3.2.3 显性承载力计算 显性承载力是以隐性承载力和韧性承载力为内核、考虑外部压力影响下资源环境系统全要素的现实客观表达状态。通过梳理武汉市资源保护与开发利用中存有的水资源过量消耗、环境污染加剧、暴雨洪涝灾害频发等主要短板因子的风险概率,参考相关研究[38],以自然资源禀赋和人类活动对资源环境的干扰来表征承载力的压力限制性。显性承载力(RECC)计算公式如下:
式中:资源环境禀赋限制性R由土地资源、水资源、地质灾害、洪涝灾害的限制性4要素组成,其中,土地资源限制性通过计算人均耕地面积和地形起伏度经加权综合而得;水资源限制性通过计算人均水资源占有量而得;地质灾害限制性由1∶10万县市地质调查数据库中的地质灾害风险强度产品计算而得;洪涝灾害风险由下文所述的式(8)计算而得。人类活动对资源环境的压力限制性I由大气环境、水环境、交通状况及人口规模的限制性4要素组成,其中,大气环境限制性通过MODIS AOD气溶胶产品数据经反演计算2020年年均大气污染物浓度分布指数而得;水环境限制性通过武汉市水资源公报中的COD和氨氮容量数据计算而得;交通状况限制性由下文所述的式(9)计算而得;人口规模限制性通过计算人口密度而得。资源环境限制性分析指标体系如表4。
Tab. 4
表4
表4限制性指数计算指标
Tab. 4
| 目标层 | 准则层 | 指标层 |
|---|---|---|
| 资源环境禀赋限制性(R) | 土地资源限制性 | 人均耕地面积 |
| 地形起伏度 | ||
| 水资源限制性 | 人均水资源占有量 | |
| 地质灾害限制性 | 地质灾害风险 | |
| 洪涝灾害限制性 | 洪涝灾害风险 | |
| 人类活动对环境影响的限制性(I) | 大气环境限制性 | 大气污染物年均浓度 |
| 水环境限制性 | COD环境容量 | |
| 氨氮环境容量 | ||
| 交通状况限制性 | 道路拥堵指数 | |
| 人口规模限制性 | 人口密度 |
新窗口打开|下载CSV
洪涝灾害限制性计算方法为:采集武汉市2018—2019年有关洪涝灾害发生的社交媒体词条,获取历史洪涝灾害预警等级与频次、易渍水点分布等信息,经空间化处理制作洪涝灾害预警强度和易渍水点分布图,据式(8)计算洪涝灾害风险指数:
式中:Rflood指洪涝灾害风险指数;Li、Wi指第i个网格的预警等级和渍水发生率;n指该评价单元内的网格个数;σ指预警强度系数;ω1、ω2分别指预测系数和实际发生系数。
交通状况限制性计算方法为:依据高德地图交通态势服务API,随机调取武汉市2019年各季度内某一周的周一、周五共计8 d的早晚高峰时段(7:00—9:00和16:30—18:30)道路拥堵状况,单次采集时间间隔为60 min,选取8个样本日48个时间点内出现道路拥堵情况3次及以上的路段为交通易拥堵路段,依据式(9)计算道路拥堵指数。
式中:TCI指道路拥堵指数,conlenij、slowlenik、,norlenis分别指某采集时间点i中拥堵路段j、缓行路段k、畅通路段s的长度;λ指缓行路段与拥堵路段的折算系数,λ取0.5。
3.3 城市资源环境承载力空间特征挖掘方法
3.3.1 承载力空间聚集性判别方法 为揭示资源环境承载力的空间集聚性特征,本文采用Global Moran's I指数对承载力全局空间自相关性进行判别,通过热点分析法和双变量空间自相关分析法对承载力的空间分布聚集性进行分析,方法为:式中:n指分析单元个数;Xi和Xj指属性值;wij指各单元之间的空间权重矩阵;I指全局空间自相关指数,取值范围为[-1, 1],当I>0,即空间相关性为正向,且越接近1,空间差异越显著,当I<0,则与之相反,I = 0时,无空间相关性。
3.3.2 承载力空间向心性解析方法 为探讨资源环境承载力的空间向心性特征,本文采用分形几何理论来揭示资源环境承载力在空间分布上的变化规律。分形几何理论最初由Mandelbrot等提出,相较于经典欧式几何理论,分形理论综合目标的自相似性、自仿射性和层次性,可定量描述客观事物的“非规则”特征,当前已在城市资源环境形态研究中得到广泛应用[39],其计算方法为:
式中:r指测量半径;Si(r)指承载力指数高值区的面积;lnSi(r)、lnr分别指Si和r取对数的结果;Ci指常数,将经对数变换后的r与Si(r)进行线性回归拟合,回归斜率即为第i等级承载力的半径维数Di。依据分形几何理论[40],当Di > 2时,第i个承载力指数高值区的密度由中心向外围递增,在空间上呈向四周扩散趋势,且Di愈大,扩散趋势愈显著;当Di = 2时,第i个承载力指数高值区无显著的空间分布差异;当Di<2时,第i个承载力指数高值区密度由中心向外围递减,在空间上呈向心聚集趋势,且Di愈小,聚集趋势愈显著。
4 结果分析
综合考虑区域功能定位和社会经济发展的相对状态,根据各指标数据的自然分级、标准差分布及数据体量大小等特征划定相关参数的阈值和分级标准。一方面,针对气候变化、技术进步、重大基础设施建设、生产生活方式转变等不同情景,开展生态系统、农业生产、经济和社会发展、自然灾害、资源禀赋和人类活动限制等不同约束情景下的城市资源环境承载力本底条件分析,识别区域资源环境保护利用的基础条件;另一方面,在本底条件分析的基础上进行隐性—韧性—显性资源环境承载力分析,探索资源环境开发利用的可承载类型、可承载规模与适宜开发区域,对承载力的空间分异特征进行深入挖掘。4.1 不同约束情景下的资源环境承载力本底条件分析
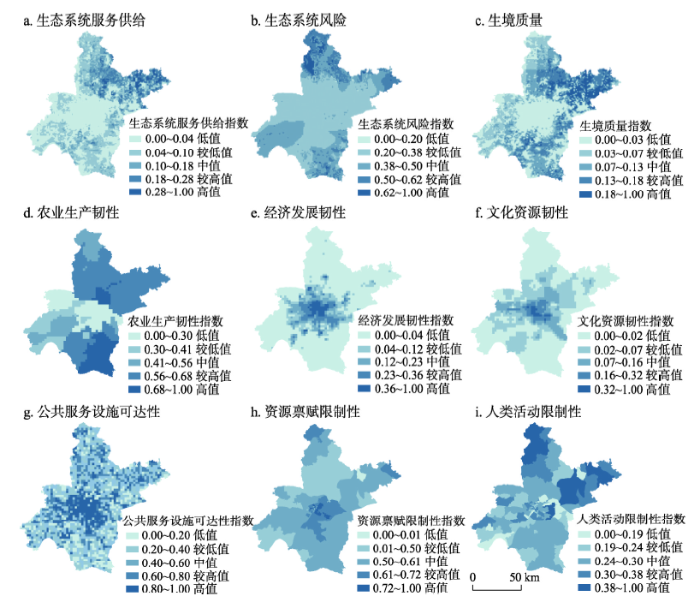
依据上述方法体系对资源环境承载力本底条件组成要素进行量化计算,将上文所述承载力计算体系中的目标层指标依据权重进行整合,开展不同约束条件下的资源环境承载潜力分析,结果如图5所示。图5
 新窗口打开|下载原图ZIP|生成PPT
图5武汉市资源环境承载力本底条件
Fig. 5The background conditions of resources and environment carrying capacity in Wuhan city
① 生态系统约束情景。生态系统服务供给水平较高的地区集中于北部的黄陂区和新洲区(图5a);生态系统风险的空间分布差异显著,高风险区聚集于黄陂区北部和新洲区东北部、蔡甸区西南部和江夏区东南部一带(图5b);生境质量最优的区域位于东北部的新洲区和江夏区南部的金口街道和东部的东湖左岭镇,而位于中部主城区一带的生境质量最差(图5c),受生态系统条件的约束最强。② 农业生产约束情景。农业生产条件最优的地区为江夏区南部(图5d),此区域地形平坦、湖泊水系星罗棋布,光温水条件和农业生产潜力较高,是农业生产的核心地带;农业生产约束性最强的区域为耕地生产条件较为贫瘠的中心城区一带,不具备发展规模型农业的基础。③ 经济和社会发展约束情景。在参考人口城市化率的基础上,结合夜间灯光遥感影像数据分析方法[41],刻画更符合实际的城市化水平[42]:武汉市夜间灯光亮度高值聚集在中心城区两江沿岸的江汉区、江岸区、硚口区及武昌区、光谷新城区一带,人类经济活动强度大、城市化水平高,经济发展条件较好的区域包括第三产业发达的主城区一带、先进制造业聚集的汉南区和高新产业集中分布的东湖高新区一带(图5e);文化资源条件较优的地区有江汉区、东湖高新区、青山区等(图5f),科教资源雄厚的区域集中在武昌区、洪山区一带,旅游资源较好的区域有东湖高新区、武昌区、江汉区等;各类公共服务设施可达性较好的区域集中于主城区一带(图5g),城市外围少量可达性高的区域是其所在生活片区的中心地带,说明武汉市公共服务设施条件较优的地区主要集中分布在中心城区,而外围地区公共服务设施的服务能力整体较为贫乏,受经济和社会发展的约束较大。④ 灾害约束情景。地质灾害高限制区分布于北部的姚家集街道、蔡店乡和东北部的徐古镇、旧街街道等区域,这些区域发生滑坡、泥石流等地质灾害的可能性较高;洪涝灾害高限制区分布在沿长江—汉江的低洼地带,包括杨园、积玉桥、中华路、中南路等23个街道,这些区域在夏季多雨时节极易发生城市内涝,居民生活和社会生产受洪涝灾害的约束较大。⑤ 资源环境限制性约束情景。水环境限制性较大的区域包括黄陂区和汉南区,交通状况高限制性区集中在中心城区的梨园街道、珞南街道和张家湾街道等经济活动强度极高的区域。总体而言,武汉市资源环境禀赋限制性约束整体较强(图5h),少量限制性低值区仅分布在北部黄陂区和西南部汉南区的零星区域;人类活动对环境影响的限制性同样较高(图5i),仅有东湖花山镇、左岭镇、九峰乡、邓南街道等区域的人类活动限制性约束相对较小,可见武汉市绝大部分区域都受制于资源禀赋限制和人类活动产生的双重约束。
4.2 隐性—韧性—显性资源环境承载力分析
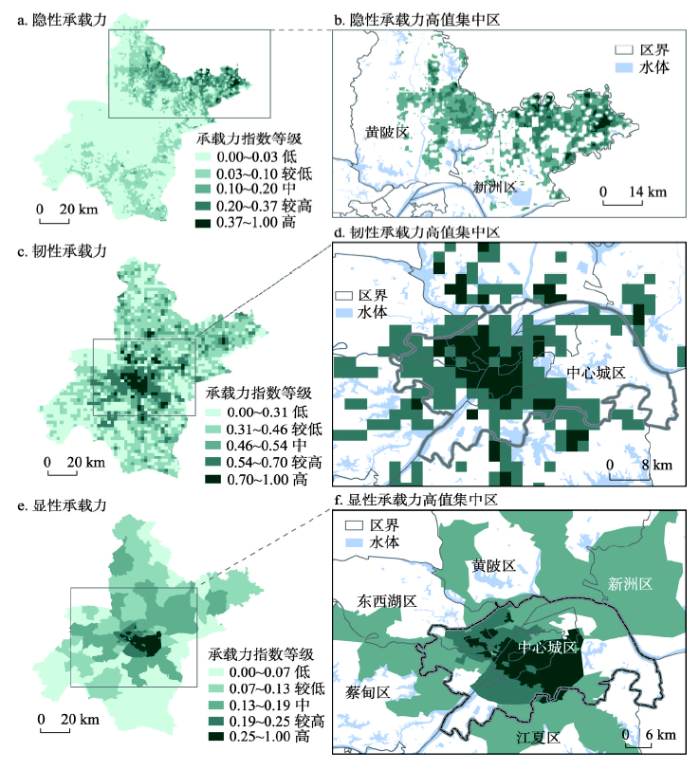
在不同约束情景下的城市资源环境承载力本底条件分析基础上,对武汉市隐性—韧性—显性资源环境承载力进行量化分析,结果如图6所示。图6
 新窗口打开|下载原图ZIP|生成PPT
图6武汉市资源环境承载力空间分布格局
Fig. 6Spatial distribution of resource and environmental carrying capacity in Wuhan city
武汉市隐性承载力指数呈“北高南低、东高西低”的空间分布格局(图6a),高值区主要分布于北部的云雾山—木兰山一带(图6b),面积占总面积的8.974%,中值区聚集于东南部的东湖—南湖—汤逊湖一带,面积占市域总面积的12.322%,中高值集中分布的区域均为森林、水域、湿地、沼泽等生态环境较优的地带,在国土空间开发中具有良好的自然本底条件;隐性承载力指数较低和低的区域面积占全域总面积比例较大,达78.704%,说明武汉市隐性资源环境承载力总体水平不高。韧性承载力指数总体呈“中部高、四周低”的空间分布格局(图6c),高值区分布在主城区和四周城镇的中心地带(图6d),面积占全域总面积的18.899%,此区域公共服务设施条件完善,兼具较优的农业生产条件和经济发展潜力,拥有充裕的文化资源,区域发展的综合韧性条件较好,适宜开拓现代服务、高新技术等对城市基础设施与生产条件综合要求较高的产业;韧性承载力低值区主要集中在西部的东西湖区、蔡甸区和汉南区湘口街道等农业生产和经济发展韧性不足、公共设施服务能力较差的远郊地带,面积占全域总面积的33.845%,这些区域应对不确定性风险的综合能力较差,在城市发展中无力承载大规模的社会生产和人类活动。显性承载力指数总体呈“中部最高、北部次之、南部最低”的空间分布格局(图6e),高值区包括中心城区大部分区域及新洲区、蔡甸区和江夏区的部分区域(图6f),面积为2105.342 km2,占全域总面积的28.081%,这些区域自然生态条件和社会经济发展的韧性较优,且资源环境禀赋和人类活动影响的压力限制性较小;显性承载力指数低值区面积为2838.454 km2,占全域总面积的37.859%,主要分布在江夏区、蔡甸区等城市开发强度较低的区域,此区域的资源环境综合承载力水平低,资源环境禀赋限制性和人类活动对环境影响的限制性较大,难以承载大规模的国土空间开发利用活动。
4.3 资源环境承载力空间特征分析
4.3.1 资源环境承载力空间聚集性 为在统一的尺度上探索承载力的空间集聚效应,根据承载力分析的适用性原则,采用面积加权平均法将30 m和2 km尺度的隐性和韧性承载力指数统一转换为街道尺度。利用GeoDa空间分析工具建立空间关系矩阵,采用Rook邻接确定空间权重,通过全局和局部空间自相关分析揭示隐性—韧性—显性承载力空间分布聚集性特征。由全局空间自相关分析结果(表5)可知,隐性—韧性—显性承载力P值都远小于0.001,通过了1%水平下的显著性检验,Moran's I指数均大于0,说明资源环境承载力均存在显著的正向空间聚集性,其中以隐性承载力的正向空间聚集性最为显著,由此可知,如果武汉市某一街道的承载力水平较高,则与该街道相邻的区域通常也具有较高的承载力水平。Tab. 5
表5
表5资源环境承载力全局空间自相关分析结果
Tab. 5
| 维度 | 隐性承载力 | 韧性承载力 | 显性承载力 |
|---|---|---|---|
| Moran's I | 0.73 | 0.67 | 0.45 |
| P值 | 0.00 | 0.00 | 0.00 |
| Z值 | 15.31 | 14.01 | 9.44 |
新窗口打开|下载CSV
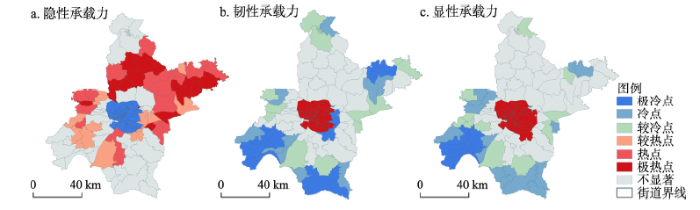
通过热点分析和双变量Local Moran's I指数法,探讨武汉市隐性—韧性—显性资源环境承载力间的空间相关性类型及分布状态。热点分析结果(图7)表明,隐性承载力热点区集中于北部的黄陂区、新洲区,冷点区分布在江汉区、江岸区、武昌区等区域,冷点区集中在城市中心地带,这些区域建设用地高度集中,国土生态空间用地分布较少;韧性承载力热点区集中在两江交汇处城市公共服务设施条件较好的区域,冷点区分布在南部的汉南区和江夏区;显性承载力热点区集中在城市各项基础功能较为健全的城市次中心一带,这些区域是开展国土空间资源开发利用活动的适宜地区,西南部的汉南区是显性承载力的极冷点区,在国土空间开发中应重点关注对生态环境质量的保护和管控、加强城市基础设施建设,提升资源环境综合承载水平。
图7
 新窗口打开|下载原图ZIP|生成PPT
图7武汉资源环境承载力热点分析结果
Fig. 7Cold and hot spot results of resource and environmental carrying capacity
双变量空间自相关分析结果如图8所示。从局部相关性的角度分析,隐性—韧性承载力和显性—隐性承载力中“高—低”型、“低—高”型聚集的区域较“低—低”型和“高—高”型的区域更多(图8a、8c),这说明隐性承载力较高的区域内韧性承载力和显性承载力却较低,其原因可能在于:隐性承载力高值区分布于城市边缘的森林、水域等生态条件优越的地带,这些区域多属国土生态空间,主导的国土空间功能指向为生态功能,而工农业生产和社会服务的能力相对薄弱,无法为国土空间资源开发利用供给良好的支撑资源。由图8b可知,韧性承载力与显性承载力呈显著的正向空间相关性,说明韧性承载力水平较高的区域也同时具有较高的显性承载力,这一点恰好印证了文中提出的理论逻辑:资源环境韧性条件和城市基础设施较好的区域,其抵御不确定性风险的能力较好,现实的资源环境承载能力也较高。从空间差异的角度来看,隐性—韧性承载力指数的“高—低”孤立区分布在城市边缘(图8d);韧性—显性承载力指数的“高—高”集簇区集中于近中心城区的核心地带、“低—低”萧索区分布于南部的蔡甸区、汉南区和江夏区一带(图8e);显性—隐性承载力的“低—高”空心区分布在北部的黄陂区和新洲区,东北部的武湖和阳逻街道存在零星的高高聚集(图8f)。总体来看,武汉市隐性—韧性—显性承载力较少出现“高—高”聚集现象,间接说明武汉市鲜有同时具备较高的自然生态质量和社会发展韧性、较低的资源禀赋限制和人为活动限制水平的区域,大部分区域在未来实现生态环境和社会经济的协调发展过程中仍旧存在一定困难。
图8
 新窗口打开|下载原图ZIP|生成PPT
图8资源环境承载力双变量空间自相关分析结果
Fig. 8Double variant spatial autocorrelation results of resource and environmental carrying capacity
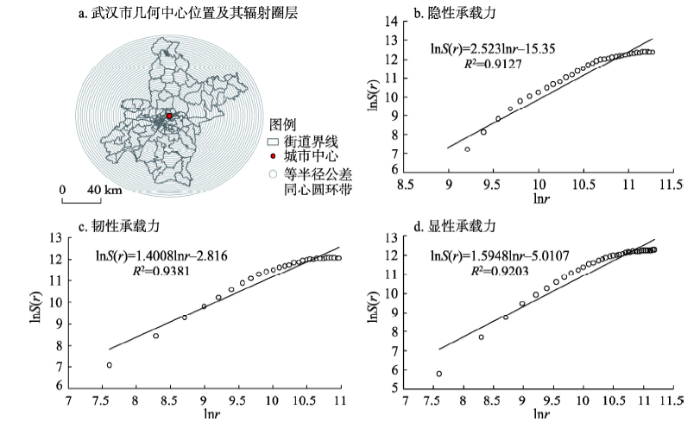
4.3.2 资源环境承载力的空间向心性 通过对资源环境承载力高值区分布的半径维数进行测算,以半径维数测算结果来衡量承载力空间分布的向心性特征及变化规律,测算步骤如下:选取武汉市的几何重心为测量中心点,以2 km为半径构造42个同心圆作为基本度量单元,创建若干个缓冲区进行叠置分析;统计各缓冲区内资源环境承载力指数高值区的面积,将半径对数lnr和面积对数lnS(r)进行线性回归关系拟合,以此求算半径维数,结果如图9所示。
图9
 新窗口打开|下载原图ZIP|生成PPT
图9资源环境承载力的半径维数双对数拟合结果
Fig. 9The ln-ln plot on radius dimensions of resource and environmental carrying capacity
由图9可知,武汉市隐性、韧性、显性资源环境承载力指数高值区的lnS(r)-lnr拟合效果较优,显著性水平较高,回归分析模拟的结果可信。依据图9a,武汉市城市中心点位于江岸区二七街道附近,该区域是武汉市的商业发展中心和居民活动中心,同时,该区域也恰好是武汉市市政府的驻地,说明选择此点为城市中心点兼具较好的典型性与客观性,以此点作为中心点分析承载力空间分布的向心性特征,可合理地解答城市资源环境承载力空间分布特征同城市居民活动圈层之间的相关性这一科学问题,进而可为人地关系的进一步探讨提供理论依据。结合承载力半径维数双对数拟合结果(图9b~9d)和隐性—韧性—显性资源环境承载力分析结果(图6)可知,武汉市隐性、韧性、显性承载力指数空间分布的半径维数排序为:韧性承载力(1.4008)<显性承载力(1.5948)<隐性承载力(2.5230)。总体来看,隐性—韧性—显性承载力高值区的半径维数均不接近2,说明武汉市各维度资源环境承载力在空间上均未出现自中心向外围均匀分布的情况,表明武汉市资源环境承载力水平的空间分布结构具有显著的半径聚集分形和圈层特征。隐性承载力指数高值区呈放射状由城市中心向四周扩散,韧性承载力指数高值区呈向心状聚集在城市核心圈层,显性承载力指数高值区分布于介于隐性与韧性承载力指数高值区之间的地带。通过进一步实地判别探索发现,武汉市资源环境承载力的空间分布格局由3种机制作用而成:① 隐性承载力指数高值区的空间分布密度由中心向外围逐渐扩大,愈往外围增加速度愈快,究其原因,除临近城市内环区域的东湖风景区和南湖等少量分布的生态空间外,武汉市林地、草地、湿地与水域等对生态环境质量起支撑作用的国土生态空间主要集中分布于城市的边缘地带,愈往城市外围的区域生态环境条件愈优越,相应的隐性资源环境承载水平则愈高;② 韧性承载力指数高值区的空间分布密度由中心向外围快速衰减,联系上文承载力本底条件分析结果发现,武汉市经济发展韧性、文化资源韧性和公共服务设施可达性较优的区域均高度集中于靠近城市核心圈层的地带,而愈往城市外围区域的经济发展韧性、文化资源韧性、公共服务设施可达性愈低,资源环境承载能力的韧性便愈小;③ 显性承载力指数高值区的空间分布密度同样具有由中心向外围逐渐衰减的趋势,并呈现出显著不均匀、非线性变化,结合资源环境承载力本底条件分析和隐性—韧性—显性承载力综合分析结果可知,显性资源环境承载力指数高值区主要分布在靠近城市内部圈层的洪山区、东湖高新区等区域,这些区域不是城市社会经济活动的核心地带,同时也并非远离中心的边缘地区,而是位于城市的次核心区域,此区域不仅具有较为优越的自然生态条件与稳健的风险应对能力,同时还具有较低的资源禀赋限制和人类活动限制性,这一点也与资源环境经济学的价值理论内涵相契合[43]。综合以上分析结果可知:武汉市资源环境承载力的空间分布同城市社会经济发展与居民生活圈层之间存在关联,生态条件越好、抗风险能力越强、社会活动强度越低的区域,现实的综合资源环境承载水平就越高,更适宜作为城市经济社会活动中心和政府制定规划决策的首选之地。
5 结论与讨论
5.1 结论
本文以双评价指南为蓝本,构建基于隐性—韧性—显性的城市资源环境承载力研究理论框架与方法体系,深入解析武汉市资源环境承载力水平及其内在作用机理,在此基础上挖掘承载力的空间分异特征,得出的主要结论如下:(1)武汉市资源环境承载力本底条件具有显著的空间异质性。北部黄陂区和新洲区一带的生态系统服务供给水平较高,而位于中部主城区一带受生态系统条件的约束最大;江夏区南部的光温水条件较优,可承载的农业生产潜力最高,是发展规模农业的核心地带;中心城区长江与汉江沿岸的江汉区、江岸区、硚口区及武昌区、光谷新城区一带经济活动强度最大、城市化水平最高,且具有较好的公共服务设施供给能力,可承载工业生产和社会经济发展的潜力较大;北部的姚家集街道、蔡店乡和东北部的徐古镇、旧街街道等区域具有一定的地质灾害风险,沿长江—汉江的杨园、积玉桥、中华路、中南路等23个街道的洪涝灾害风险较高,这些区域的居民生活和资源环境开发利用受自然灾害风险的约束较大。武汉市资源环境禀赋限制性和人类活动对环境影响的限制性整体较强,绝大部分区域都受资源禀赋限制和人类活动产生的双重约束。
(2)武汉市隐性承载力水平总体偏低,呈“北高南低、东高西低”的空间分布格局,少有的隐性承载力指数高值区仅分布于城市外围森林、水域、湿地、沼泽等生态环境条件较优的地带;韧性承载力总体呈“中部高、四周低”的空间分布格局,韧性承载力指数高值区聚集在公共服务设施条件较为完善的主城区及远城区中心地带,这些区域兼具较优的农业生产条件和经济发展潜力,区域发展的综合韧性较好,适宜发展现代服务、高新技术等对城市基础设施与生产条件综合要求较高的产业;显性承载力总体呈“中部最高、北部次之、南部最低”的空间分布格局,产生此种格局的原因在于武汉市中部与北部区域是城市中心和远城区中心,这些区域环境生态水平与社会经济发展的韧性条件较好,且资源环境禀赋和人类活动影响的压力限制性较小,而位于南部的江夏区、蔡甸区的城市开发强度较低,并受资源环境禀赋和人类活动对环境影响两方面的共同限制,可承载国土空间开发利用活动的能力相对不足。
(3)武汉市资源环境承载力存在显著的正向空间聚集性,其中以隐性承载力的正向空间聚集性最为显著。隐性承载力指数的热点区集中在北部的黄陂区、新洲区,冷点区分布在江汉区、江岸区、武昌区等区域,韧性承载力指数的热点区集中在位于长江汉江交汇地带的城市公共服务设施和社会经济活动的核心区,冷点区分布在南部的汉南区和江夏区,显性承载力指数的热点区集中在中心城区一带,冷点区位于西南部的汉南区。武汉市资源环境承载力的空间分布结构具有显著的空间向心性特征,隐性承载力指数高值区呈放射状向四周扩散,韧性承载力指数高值区呈向心状聚集在城市核心圈层,显性承载力指数高值区分布于隐性和韧性承载力指数高值区二者之间的地带。
(4)隐性承载力是资源环境支撑条件的潜在载体,体现出生态环境要素的容量大小,在城市资源环境开发与保护中起基础约束性作用;韧性承载力刻画了区域应对不确定性风险与基础设施服务的能力大小,是城市规模扩张的安全阈值;显性承载力是由隐性和韧性承载力组成、在资源环境禀赋和人类活动对环境影响的压力限制下的现实状态,表征了城市资源环境承载力系统全部组成要素质量的外在客观状态;隐性—韧性—显性承载力三维组合条件共同决定城市资源环境承载力水平。
(5)本文通过对“隐性—韧性—显性”三个维度的资源环境承载力进行系统解析,深入探明了资源环境要素在不同情景约束条件下的承载潜力,多源时空数据的引入较好地提升了研究数据的精度和现势性,从不同视角有效识别出了国土空间开发保护过程中存在的突出问题及潜在风险,研究成果可为国土空间规划中总量控制目标测定分解等研究与实践提供精细化和模式化的决策支持。
5.2 讨论与展望
当前中国城市国土空间资源管理的现实需求已发生深刻变革,城市资源环境承载力研究也因此面临着新的任务:承载力分析的目标导向必然将由源头防控转变为靶向治理,承载力分析的技术手段亟待由基于历史数据的综合评价升级为面向现势状态的精准研判。为合理支撑国土空间规划多方案比选工作,依据不同情景约束下资源环境承载力分析结果和隐性—韧性—显性承载力分析结果,对武汉市不同区域的国土空间开发利用决策提出如下适应与应对建议:① 除东北部的黄陂区和新洲区的部分区域外,武汉市大部分区域的生态系统本底条件均欠佳,在进行国土空间资源利用与管理时应对这些地区予以重点监督管控,科学防范生态风险、合理控制国土生态空间开发利用、严格保护生态环境质量;② 农业发展优势区位于江夏区南部,此区域农业生产资源充足,地形平坦开阔,适宜发展大机械作业的规模型农业,应夯实其农业生产的基础性地位;而中心城区一带不具备发展规模型农业的条件,但其对农业产品需求量大,且具备充足的科技资源和劳动力资源,可孵化发展现代都市农业,加快推进农业科技创新新业态;③ 经济和社会发展条件较优的地区集中在城市中心及其腹地一带,此区域的不确定性风险应对能力较强,而城市外围的大部分乡村区域并不具备此等条件,在国土空间开发过程中,应加强城市外围乡村的基础设施建设,因地制宜、因势利导,促进城乡一体化协调发展;④ 姚家集街道、蔡店乡等区域发生地质灾害的可能性较大,居民生活和社会发展存在一定安全隐患,当地应急管理部门应培育良好的灾害预警与响应工作能力,在国土空间开发过程中应对地质灾害易发区开展水源涵养、水土保持、边坡护理等举措,有条件的地区可适当安排异地安置;长江—汉江沿线交汇处的低洼地带受洪涝灾害的约束较大,在国土空间开发利用过程中应注重给排水等基础市政设施建设,重点解决城市渍水难题,将灾害的约束性限定在最低水平;⑤ 总体来看,武汉市绝大部分区域资源禀赋限制和人类活动限制约束性均较大,在未来的城市国土空间开发利用中应注重全域资源保护和生态功能修复工作。本文基于隐性、韧性、显性三个维度对城市资源环境承载力空间特征进行分析与挖掘,刻画了承载力系统要素在生态系统条件约束下的“隐性渗透”条件,在风险应对中“韧性织补”能力以及在外部压力限制下的“显性表达”现状。依据不同约束条件下的资源环境承载潜力和隐性—韧性—显性承载力的空间分布特征,解答了城市国土空间哪里能用以及怎么用的问题,为弥补国土空间短板、发挥区域优势提供了合理的参考依据,可为促进双评价与国土空间规划工作实现高效衔接提供一定借鉴。此外,本文将多源时空数据引入城市资源环境承载力研究指标体系,较好地解决了传统方法中的数据精度难以保证、数据现势性不足等问题,提升了城市资源环境承载力研究的分析精度和效率,同时也契合了双评价指南中的相关理念设想,为多源时空数据辅助国土空间规划与自然资源管理工作提供了新的技术与理论模式参考,研究成果可为进一步制定差异化、精准化的国土空间规划与决策提供科学依据。同时,多源时空数据的范畴广泛,数据类目十分庞杂,且各类别数据间的交错性强,如何合理消弭其中的信息冗余与精度失衡等问题,优化多源时空数据与传统空间数据的集成模式,是后续研究应进行深入探讨的方向。
参考文献 原文顺序
文献年度倒序
文中引用次数倒序
被引期刊影响因子
[本文引用: 1]
[本文引用: 1]
DOI:10.11821/dlxb202012014 [本文引用: 1]

Urban scaling laws depict the nonlinear relationship between urban indicators and population size within an urban system, but its applicability and significance in China's urban system is not clear. This study applied the data of 275 prefecture-level cities in China to explore the scaling relationship between different urban indicators and population sizes. We also attempt to present an empirical analysis of spatio-temporal characteristics of urban scaling exponent (β) from 2000-2017 to enrich the understanding of urban scaling laws. The result shows that as a typical fast urbanizing country, China's urban development conforms to the urban scaling laws but presents some different characteristics from developed countries. There is a significant increasing return to population size of economic output brought by China's urban population agglomeration. Nevertheless, the economies of scale for land use, infrastructure and public service are supposed to be strengthened. Some infrastructure and living facilities indicators have a super-linear or linear relationship with the population size, which are contrary to the expected sublinear regime. The scaling exponents of education, medical and health care and other urban indicators are far below the sub-linear thresholds of developed countries, which reflects the uniqueness in a fast urbanizing country that large cities are given priority to infrastructure construction and the unbalanced development of different-sized cities. The spatial distribution characteristic of scaling exponent reflects the differences in the degree of coordination of urban development, with the most significant differences in Northeast China. We also analyzed the evolution of scaling exponents of major urban indicators over time. Economic increasing returns to population size effect of large cities in China was the most significant in 2009 before falling slightly. Urban land expansion in large cities has continued to accelerate since 2000 and still remains at a high level after 2008. It is urgent to control the extensive urban land expansion and improve land use efficiency, especially in large cities. This study on urban scaling in China contributes to fully understanding the characteristics and evolution of urban systems in the fast urbanizing country. This paper is supposed to provide a support for achieving a balanced regional development and implementing new urbanization development strategies as well.
[本文引用: 1]
DOI:10.11821/dlxb202003011 [本文引用: 1]
The local and tele-coupling relationship between urbanization and eco-environment has received extensive attention from researchers in recent years. Understanding the synergies and trade-off between urbanization and eco-environment systems is essential in addressing eco-environment problems in rapidly urbanized China. Based on a comprehensive literature review on the subject, this article presents the theories, methods and key applications that are associated with the coupling relationship between urbanization and eco-environment. We found that the concept of local and tele-coupling relationship between urbanization and eco-environment has only been developed since two decades ago. Related theories are still in development and applications based on this concept are limited until now. However, from other perspectives, many studies have adopted various methods to investigate the relations between the human and nature systems, providing abundant empirical evidence on the coupling relationship between the two systems. Lastly, future research directions are recommended. It is essential to examine the local and tele-coupling relationship between urban and eco-environmental systems in urban agglomeration areas, which helps enhance our understanding on the dynamic characteristics of involved systems and dominating pathways of evolving relationships in rapidly developed regions in China.
[本文引用: 1]
DOI:10.31497/zrzyxb.20191005URL [本文引用: 1]
[本文引用: 1]
[本文引用: 1]
[本文引用: 1]
DOI:10.1007/s11769-015-0794-6URL [本文引用: 1]
DOI:10.1016/j.eiar.2017.11.002URL [本文引用: 1]
URL [本文引用: 2]
DOI:10.1016/j.jenvman.2020.111064URL [本文引用: 1]
DOI:10.11821/dlxb201908006 [本文引用: 1]
As natural resources are experiencing rapid reduction and the environment is degenerating, resource environmental carrying capacity has attracted more and more attention in China. However, current research on resource environmental carrying capacity still stays at theoretical level leaving the gap with applications. Moreover, the study conclusions are usually not of policy implications and lack of operability. This study develops a comprehensive analytical framework for the co-development of industries, population, economy, resources and environment. The framework first evaluates the importance of all industries to local social economy and determines the direction of industrial structure adjustment, and then identifies the interaction relationships among the socioeconomic development, resource consumption and environment emission, and subsequently evaluates the resource environmental carrying capacity, which helps achieve the maximum socio-economic development under the premise of environmental protection and efficient resource utilization. The Tibet case study estimates the local resource environmental carrying capacity under different development scenarios and therefore determines the maximum population and economic scale through industrial structure adjustments under the constraints of resource and environment. The results show that to focus on the development of tourism can significantly improve the resource environmental carrying capacity of Tibet. The results could help make decision regarding local industrial structure adjustments to achieve sustainable development. In conclusion the proposed analytical framework provides an operational decision support tool for "socio-ecological" sustainability. It can be extended to other regions through minor parameter adjustments.
[本文引用: 1]
[本文引用: 1]
[本文引用: 1]
[本文引用: 1]
[本文引用: 1]
DOI:10.11821/dlxb201912004 [本文引用: 1]
Beautiful China is the new goal of ecological civilization construction in the new era of socialism, which can meet the real needs of the people for a better life. National land space planning is a major deployment of the state to coordinate various types of space planning. Beautiful China is the new leading goal of the country's second centenary development. Its connotation is not only "ecological beauty", but also the comprehensive beauty of "economy-politics-culture-society-ecology". The construction of beautiful China needs a differentiated evaluation index system based on the local conditions. Beautiful China is closely related to the land spatial planning. The former provides an important direction for the latter, while the latter provides an important approach and space guarantee for the construction of the former. The establishment of land spatial planning needs to strengthen the further discussion of the regional system of human-environment interaction, point-axis system, the main functional area planning, sustainable development and resource environmental carrying capacity, new urbanization and rural regional multi-body system. This paper puts forward the thinking framework of land spatial planning from the perspective of geography, including scientifically analyzing the natural geographical conditions, economic and social development basis, and the interrelationship between land and space, planing the goal, vision and path of land and space, encouraging the public to participate in and carry out dynamic evaluation, and building an intelligent system platform for land and spatial planning with the goal of beautiful China, which provide ideas for the compilation and implementation of land spatial planning.
[本文引用: 1]
[本文引用: 1]
[本文引用: 1]
[本文引用: 1]
[本文引用: 1]
[本文引用: 1]
[本文引用: 1]
[本文引用: 1]
DOI:10.31497/zrzyxb.20201005URL [本文引用: 1]
[本文引用: 1]
[本文引用: 1]
[本文引用: 1]
DOI:10.11821/dlxb201912013 [本文引用: 1]
Since the reform and opening up in 1978, China has created a miracle of long-term high-speed economic growth, but the relationship between man and nature has suffered a serious damage, which is highlighted by the excessive consumption of resources and the intensification of environmental pollution. As a result, China is facing a slowdown in development. At the same time, China needs to maintain a certain speed of development in order to realize the dream of a powerful nationality entering the ranks of developed countries in 2050. To this end, China is facing transformation development. Now Chinese scholars and governments need to answer this kind of question: What economic growth rate is expected along with the corresponding development modes or means of regulation in the medium and long term? The growth development mode of the national economy is influenced and even dominated by the resource and environment support system. This study is intended to reveal the coupling relationship between economic growth, development modes and the supporting system, simulate the interaction process between them, explore the possible options for future economic growth and its requirements for the resource and environmental support system (the main factors), and provide early warning regarding China's environmental and development status. The results show that in order to achieve the development goal of entering the ranks of developed countries in 2050 and maintaining a fine ecological environment, the suitable growth rate for China's economy is 3.8%-6.3% on the premise that technological progress will improve resource utilization efficiency and reduce pollution emissions. Within this speed range, on the one hand, the smaller development velocity may be adopted to reduce the pressure on resources and environment, on the other hand, higher velocity can be adopted given that we are optimistic about the technological advances. The model proposed could help to compare different development scenarios and determine a better development mode; this way provides decision support for sustainable development. This study is a response to the "Future Earth" framework document. It develops the theoretical system of the resource and environmental carrying capacity in terms of development speed. It has important theoretical exploration significance and application value.
[本文引用: 1]
[本文引用: 1]
[本文引用: 1]
[本文引用: 1]
[本文引用: 1]
[本文引用: 1]
[本文引用: 1]
DOI:10.11821/dlxb201708008 [本文引用: 1]
Different urban elements may exhibit various aggregation patterns. It is of great significance to quantitatively investigate the disparity and connection among various aggregation patterns of urban elements for understanding the mechanism of urban development and supporting urban planning. Taking Wuhan city, Central China, as a case, we collected five types of urban elements, namely, impervious surface, population density, Point of Interest (POI), plot ratio, and road network, to explore their spatial distribution and characteristics of aggregation patterns. We first used Kernel Density Estimation (KDE) method to identify city centers and we found that there is one major center and seven sub-centers in Wuhan. Then we partitioned the study area by gradient analysis, and calculated the densities of urban elements. The density of urban element decreases outward from the centers, which is fitted well using "Inverse S-shaped" function. We used Concentration Degree Index (CDI) to reflect the aggregation degree of urban elements. The results indicate that the degrees of the aggregation of urban elements are: Commercial POI > population > plot ratio > road. Commercial POI and population are highly aggregated in the urban core area, while plot ratio and road are moderately aggregated in the urban core area. The spatial patterns of highly aggregated commercial POI and population are the combination of point pattern and zonal pattern, while the spatial patterns of moderately aggregated road network and plot ratio are the combination of point pattern, ring pattern and axial pattern. As for the lowly aggregated impervious surface, it shows a ring pattern. The attraction effect of city centers and vertical development promote the center-oriented agglomeration of urban elements. At the same time, the transportation lines and corridor effects of the scarce landscape resources reshape the spatial distribution pattern of urban elements.
[本文引用: 1]
[本文引用: 1]
[本文引用: 1]
DOI:10.31497/zrzyxb.20201006URL [本文引用: 2]
[本文引用: 2]
[本文引用: 1]
[本文引用: 1]
DOI:10.1080/13658816.2019.1568441URL [本文引用: 1]
[本文引用: 1]
[本文引用: 1]
[本文引用: 1]
[本文引用: 1]
DOI:10.1016/j.biocon.2008.11.009URL [本文引用: 1]
DOI:10.11821/dlxb202106006 [本文引用: 1]
With the rapid development of information technology, the interweaving physical infrastructure and virtual urban networks show more abundant connotations. As one of the most effective indicators to measure regional resilience, urban network structure resilience focuses on the capacity of the urban network system to restore, maintain, or improve the original network characteristics and important functions when faced with external acute shock and chronic pressure. Therefore, evaluating the resilience of the urban network structure is of great significance for recognizing and understanding regional resilience. Taking 346 cities of China at the prefecture level and above as the research objects, this study constructed information, transportation, economic, and comprehensive connection networks based on the Baidu index, Tencent location services, and social statistics data. The resilience of the urban network was then measured and evaluated in four aspects: hierarchy, heterogeneity, transmissibility, and diversity. The last two properties are in interrupting simulation scenarios. Accordingly, the optimization strategies and suggestions for the network structure were put forward. Based on the results, the following conclusions can be drawn: (1) Although China's information, transportation, economic, and comprehensive networks among the 346 prefecture-level cities and above in 2017 presented a spatial pattern of "dense in the east and sparse in the west" with "Hu Huanyong Line" as the boundary, their spatial structures exhibit their own characteristics. (2) The hierarchy of information, transportation, and economic networks from strong to weak is in the following order: economic network > information network > transportation network. Large cities and provincial capital cities have a higher hierarchy in a network because of the rapid innovation and dissemination of information technology, the high development and agglomeration of industrial economy, and the rapid allocation and improvement of traffic infrastructures. (3) The three major networks of information, transportation, and economy are all heterogeneous. In the information network, there are more opportunities for cross-regional communication between high-weighted and low-weighted nodes, thereby exhibiting the highest heterogeneous resilience. (4) The transmissibility and diversity resilience of information network was slightly higher than those of the economic network and much higher than those of the transportation network. Failures or perturbations of a city have almost the same impact on network transmissibility and diversity. Cities that have a great impact on the resilience of China's urban network structure typically exhibit high centrality and control power. These cities not only have a higher level of economic development and a relatively sound transportation hub, but also exhibit superiority with regard to their geographical conditions and distribution of natural resources.
[本文引用: 1]
DOI:10.11821/dlxb201812004 [本文引用: 1]
Aiming at building a safe city, this study proposed a “Size-Density-Morphology” based three-dimensional urban resilience evaluation framework according to the theories and methods of geography and landscape ecology. By using the framework, the urban resilience of each county in Dalian city during 2000-2016 was evaluated. There are three kinds of urban resilience, namely size resilience, density resilience and morphology resilience. The size resilience could be measured by ecological infrastructure tools; the density resilience could be measured by ecological footprint and ecological carrying capacity; the morphology resilience could be measured by "Source-sink" landscape average distance index. In addition, this paper also analyzed the combining forms of the three types of resilience. This study demonstrates that the three-dimension evaluation framework has a unique capacity to identify the resilience characteristics of city, and it is a key bond which creates the connection of urban planning and urban resilience research. Findings are as follows: (1) The size safety is the primary constraint condition for urban spatial expansion. (2) Ecological carrying capacity is the safe threshold for urban density. (3) The spatial coupling of source and sink landscape is a basic feature of good urban morphology. (4) It is the combination of size-density-morphology resilience to determine the safety of the city rather than each single one. According to the analysis of combination characteristics of the "Size-Density-Morphology" resilience, four suggestions were put forward for the development of Dalian city in future. (1) Strictly limit the development intensity of central urban area and Jinzhou district to curb the urban sprawl trend; (2) Strictly control the development of the coastal zone and maintain the integrity of natural mountain and green vegetation patches; (3) Promote the balanced development on a whole city scale to improve the city's overall resilience; (4) Optimizing the development strategy of new urban area in order to form a good urban morphology.
[本文引用: 1]
DOI:10.13249/j.cnki.sgs.2020.11.002 [本文引用: 1]
As an important part of basic public service facilities, basic education facilities are of great significance for improving the quality of life of residents and improving the efficiency of urban operations. At present, the research on educational facilities is comprehensive, mainly focusing on spatial layout, spatial accessibility and facility configuration. However, in the research scale, residential units and even subdistrict are mostly basic units. Such accuracy is obviously poor. This paper uses UNA toolkit, which based on Rhino, to analyze the spatial accessibility of three basic education facilities in kindergarten, elementary school and junior high school in Shahekou District of Dalian from the residential building and community level, and proposes optimization ideas and site-selection schemes. The main conclusions are as follows: 1) The spatial distribution of various basic education facilities is uneven, and there are phenomena of duplication and lack of coexistence; the phenomenon of “dislocation” of facilities and residential buildings is serious. 2) All kinds of basic education facilities have the problem of a small number of residential buildings within the service area. It will take a long time and distance to go to school. If the facility only serves residents within the scope of the specified service, some facilities may be underutilized. 3) In the scope of the prescribed services, junior high schools have the largest proportion of accessibility, followed by primary schools and kindergartens. Outside the prescribed scope of services, kindergartens have the worst accessibility, followed by junior high schools and primary schools. 2.97% of residential buildings with poor accessibility of the three types of facilities. These areas should give priority to adding education facilities. 4) In consideration of supply, demand and accessibility, two new facilities reference site selection schemes were proposed.
[本文引用: 1]
[本文引用: 1]
[本文引用: 1]
[本文引用: 1]
[本文引用: 1]
[本文引用: 1]
[本文引用: 1]
[本文引用: 1]
[本文引用: 1]
DOI:10.11821/dlyj201812013 [本文引用: 1]
<p>In order to expand the range of fractal dimension from the two-dimensional homogeneous space to a composite space integrated with urban land and road network, a network-based calculation method was proposed. Compared with the area-radius method, this new method can clarify the convergence and decentralization of build-up area in the road network rather than in a flat space, which can describe the urban form more reasonably. Fractal dimension of different plots in Zhengzhou downtown area was calculated by applying the above methods. The main conclusions can be summarized as follows: (1) There exists a stable change of the land use density from center to periphery, which meets the requirements of the two fractal models. This means that the land-use system presented a specific fractal feature. (2) The same principles and features for the dimension values have been presented by using two different quantization methods: commercial land < all the construction land (without street and transportation area) < residential land < industrial land. This indicates that the central area in Zhengzhou demonstrated a circle-layer structure and different land-use patterns dominated different layers. The phenomenon can be explained by the land rent theory and affected by the fixed features, such as rivers and railway. (3) The scale-free range determined in the network-based calculation method was larger compared with the traditional area-radius method, which means that the space can be divided more delicately by the scale units constructed in the network-based method. However, the space area corresponding to the scale-free range determined in the new method was smaller. (4) There exist some differences on the dimension values between the above two methods for the same land use type. The results with the network-based method had a dispersive, agglomerate and unremarkable correction function on residential land, commercial land and industrial land respectively compared with the traditional area-radius method.</p>
[本文引用: 1]
DOI:10.11821/xb199905011 [本文引用: 1]
Three types of fractal dimensions were presented to characterize the spatial structure of transport networks. The geographical meanings of these dimensions were illuminated and the methods of the determination of them were illustrated. The three fractal dimensions can be expressed as follows. 1 Length radius dimension: it is always defined by the expression L(r)∝r<sup>D</sup><sub>L</sub> where r is radial distance, L(r) is total length of communication lines in the area of π r 2, and D L is the fractal dimension reflecting the change of density of the transport network around a measured center. 2 Dendrite radius dimension: it can be given by the formula N(r)∝r<sup>D</sup><sub>b</sub> and N(r) is defined as N(r)=∑rk=1n(k) (r=1,2, …, k=1,2, …,r) where r is gyration radius, k is ordinal number of each ring belt divided with r,n(k) is the amount of branches of communication lines in the k th ring belt, and D<sub>b</sub> is the fractal dimension revealing the spatial complexing of transport network. 3 Spatial correlation dimension: it can be expressed in the formula C(r)∝r<sup>D</sup><sub>S</sub> where C(r)=1/N<sup>2</sup>∑Ni∑Njθ(r-d<sub>ij</sub> ) is spatial correlation function, θ(x) is Heaviside function (when x≥0, θ(x)=1 ; whereas, when x<0, θ(x)=0), r is yardstick, d<sub>ij</sub>is distance between two cities, N is the total amount of cities and towns in a region. When d<sub>ij</sub>represents‘cow distance’, D<sub>s</sub> can be regarded as fractal dimension mirroring the features of spatial connection and configuration of transport network.
[本文引用: 1]
[本文引用: 1]
[本文引用: 1]
[本文引用: 1]
[本文引用: 1]
[本文引用: 1]
[本文引用: 1]
