 ,1, 马爽1, 项雯怡2, 阚长城2, 吴康3, 龙瀛,1,4,5
Classification of shrinking cities in China using Baidu big data
MENG Xiangfeng,1, MA Shuang1, XIANG Wenyi2, KAN Changcheng2, WU Kang3, LONG Ying,1,4,5通讯作者:
收稿日期:2020-08-5修回日期:2021-07-25
| 基金资助: |
Received:2020-08-5Revised:2021-07-25
| Fund supported: |
作者简介 About authors
孟祥凤(1991-), 女, 博士后, 主要从事中国收缩城市的精细化识别、空间表征与规划机制研究。E-mail:

摘要
关键词:
Abstract
Keywords:
PDF (2751KB)元数据多维度评价相关文章导出EndNote|Ris|Bibtex收藏本文
本文引用格式
孟祥凤, 马爽, 项雯怡, 阚长城, 吴康, 龙瀛. 基于百度慧眼的中国收缩城市分类研究. 地理学报, 2021, 76(10): 2477-2488 doi:10.11821/dlxb202110010
MENG Xiangfeng, MA Shuang, XIANG Wenyi, KAN Changcheng, WU Kang, LONG Ying.
1 引言
20世纪末,在全球化、去工业化、郊区化、人口老龄化等因素的交叠影响下,收缩城市日渐增多[1]。1978年改革开放近40年来,中国城镇建设如火如荼,但在城镇化高速发展的过程中,部分城市的人口开始流失,出现了因产业衰落、人口流失引发的城市空间衰败[1]。城市收缩引起的恶性循环受到社会各界广泛关注。地理学界从收缩城市概念[2,3]、定量识别[4]、原因机制分析[5,6]、影响效应[7]、规划应对[8]等多个维度展开了系列研究,但缺少在全国范围内,以人口变化格局视角,探讨收缩城市分类问题的研究。西方****多借助人口普查、房产税、社区调查、住房调查等政府为主导建立的基础数据[9,10,11],以人口普查小区(Census Track)等为研究单位,分析收缩城市内部人口流失[12]、用地闲置[13]及建筑空置等特征[14],将收缩城市归纳为3种类型,包括以前民主德国老工业城市莱比锡(Leipzig)为代表的“穿孔型”收缩城市[15]、以美国东北部锈带城市(布法罗(Buffalo)、底特律(Detroit)、匹兹堡(Pittsburgh)等)为代表的“圈饼型”收缩城市[16]和以法国大巴黎地区(Ile-de-France)为代表的与圈饼型收缩正相反的边缘型收缩城市[1]。穿孔型收缩城市表现为人口流失发生在城市的各个地区,空置、遗弃的建筑与其他正在使用的建筑高度混合,就像是一张纸上被随意打掉了若干孔洞,城市的肌理不再连续[1];圈饼型收缩城市是指内城人口大量外迁,而城市郊区的人口则保持相对稳定甚至增长,这种空心化的现象与油炸圈饼极为相似因而得名[17];边缘型收缩城市其郊区环面临人口流失,而中心区依旧保持稳定。
中国****主要借助五普、六普常住人口数据及户籍人口数据开展收缩城市研究。龙瀛等[18]认为2000─2010年间中国出现了180座收缩城市,即这180座城市的人口总量发生下降;张学良等[19]根据2000─2010年间成渝地区收缩城市常住人口的减少数量和收缩位置,即人口变化格局,将收缩城市划分为全域式、局部式及边缘式3种类型;何鹤鸣等[20]通过对常州高新区产业空间闲置及就业人员减少的空间分析,认为常州高新区为“穿孔型”收缩,认为中国部分城市工业园区的收缩现象较为严重;孟祥凤[21]通过识别2001年、2009年和2016年四平市的闲置用地分布特征,将四平市分为“穿孔型─圈层型─外延式圈饼型”3种类型,认为收缩城市人口流失的区域与用地闲置区域在空间上高度重叠。由于中国城市的常住人口与户籍人口、城市实体边界与行政区划边界并不匹配[22,23],使得基于人口普查和统计数据的收缩城市研究成果时效性不高、难以代表真实城市空间、空间分辨率也不够细致[24]。依靠遥感大数据开展精细化的收缩城市分类研究初露端倪。Wu等[25]应用夜间灯光数据,识别了2012─2018年义乌市的城市收缩特征,发现增长区域主要位于义乌中部,收缩区域集中在北部和南部;Jiang等[26]基于分辨率为430 m×430 m的NPP-VIIRS夜间灯光遥感数据对中国收缩城市进行了识别分析;Zhou等[27]用夜间灯光数据分析了伊春市的城市收缩特征。
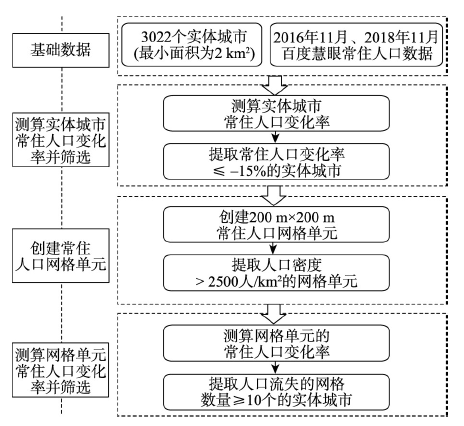
因此,本文以中国3022座实体城市(不包括港澳台地区)(最小面积为2 km2)为分析单位,依托2016年11月与2018年11月实体城市范围内分辨率为200 m×200 m的百度慧眼常住人口网格数据,从人口变化格局视角,探索中国收缩城市分类问题。高分辨率的人口数据与实体城市边界在空间上的叠加分析,弥补了中国城市的常住人口与户籍人口、城市实体边界与行政区划边界不匹配的问题,可以得到城市空间人口变化的真实情况。为政府精细调整城市发展重心、优化土地利用结构、提高城市宜居性、开展收缩语境下的城市规划与设计,提供了科学依据。
2 数据来源与研究方法
2.1 数据来源
2.1.1 实体城市数据 实体城市是指城市中的城镇空间,而非城市的行政管辖空间[23]。马爽等[23]利用2015年全国城镇建设用地与全国社区行政边界数据集,识别得到包括县城(城关镇)和较大乡镇在内的2622座实体城市(最小面积为2 km2)数据集。为了对这一数据集进行补充,利用全国2016年高分遥感影像,解译得到城镇建设用地数据集,将2016年城镇建设用地数据集与2015年实体城市边界数据集叠加,得到实体城市边界外的城镇建设用地数据,并将其与全国社区行政边界相叠加。当城镇建设用地占社区面积比例超过40%时,将社区边界内区域识别为实体地域;当单独或连片实体地域的总面积超过2 km2时,实体地域被归并为一个实体城市。据此,2016年在全国范围内增补了400座实体城市。本文文中最终参与收缩城市分类的实体城市有3022座,最小面积为2 km2。2.1.2 百度慧眼常住人口数据 百度慧眼通过整合百度地图位置服务中的去隐私化人口位置信息(6个月),及用户标注、土地使用属性等数据,提取人口活动的位置属性、时间分布等特征。基于人工智能技术(GBDT、XGBoost)挖掘得到精度高、覆盖广的人口常驻点数据;再利用ID Mapping技术,结合《中国统计年鉴》人口年龄结构还原得到常住人口数据。百度慧眼常住人口数据具有精度高、覆盖广、动态更新等优势,其常住人口的统计标准为在某城市居住半年及以上的人口(相关数据处理各环节均匿名化,各环节及输出均不涉及个体隐私)(
2.2 研究方法
2.2.1 实体城市常住人口变化率 一般认为,在城市内部,若人口持续流失,即为收缩城市。但人口流失的时长和数量标准并不统一[28,29]。如国际城市收缩研究网络(Shrinking Cities International Research Network(式中:P2018代表2018年11月某市常住人口数量;P2016代表2016年11月某市常住人口数量;S为2016─2018年间某市常住人口变化率。
2.2.2 收缩城市研究样本的筛选方法 为有效识别收缩城市的人口变化格局,必须认真遴选收缩城市的研究样本。参考部分收缩城市的分级划分标准,人口流失超过10%或15%的城市被划分为严重收缩城市(Significant Shrinkage)[30,31],故本文制定收缩城市研究样本的遴选标准为(图1):① 选择常住人口变化率≤ -15%的实体城市;② 筛选出实体城市内部人口密度> 2500人/km2的网格单元;③ 人口减少的网格数量≥ 10个的实体城市。
图1
 新窗口打开|下载原图ZIP|生成PPT
图1收缩城市样本筛选方法
Fig. 1The screening method of shrinking city samples
2.3 基于人口变化格局的收缩城市分类模型
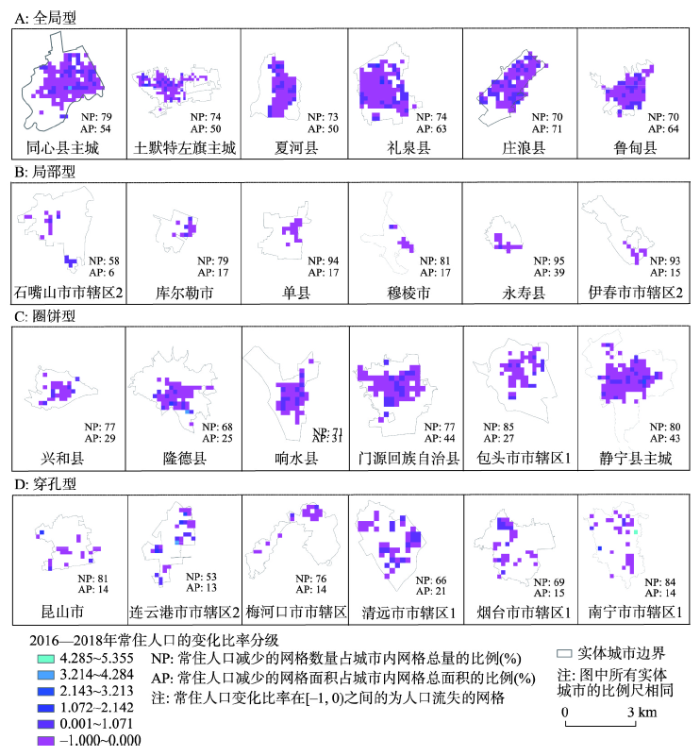
参考相关研究文献[15,16],本文从收缩城市内部常住人口减少的网格数量、面积大小及空间分布特征等维度,判定收缩城市人口变化格局,并将收缩城市分为全局型(Complete Shrinkage)、局部型(Local Shrinkage)、圈饼型(Doughnut Shrinkage)、边缘型(Peripheral Shrinkage)及穿孔型(Perforated Shrinkage)5种类型。基于人口变化格局的收缩城市分类模型如表1所示。Tab. 1
表1
表1基于人口变化格局的收缩城市分类标准
Tab. 1
| 收缩城市类型 | 概念 | 分类标准 | |
|---|---|---|---|
| 全局型 | 城市范围内绝大部分地区同时经历着人口流失 | 收缩城市内常住人口变化率< 0的网格数量占网格总量的70%以上,且常住人口变化率< 0的网格面积占收缩城市面积的50%以上 | |
| 局部型 | 城市内部某一地区出现较小范围的人口流失 | 常住人口变化率< 0的网格集中分布在实体城市除中心位置外的某一区域 | |
| 圈饼型 | 内城人口大量减少,而城市周边人口数量相对稳定 | 常住人口变化率< 0的网格集中在实体城市的中心区域 | |
| 穿孔型 | 多个人口流失区域散布在城市内部 | 常住人口变化率< 0的网格零散分布在实体城市的多个区位 | |
| 边缘型 | 内城人口增加,周边人口减少 | 常住人口变化率< 0的网格分布在城市增长区的外围 | |
新窗口打开|下载CSV
3 结果分析
3.1 中国实体城市常住人口变化特征
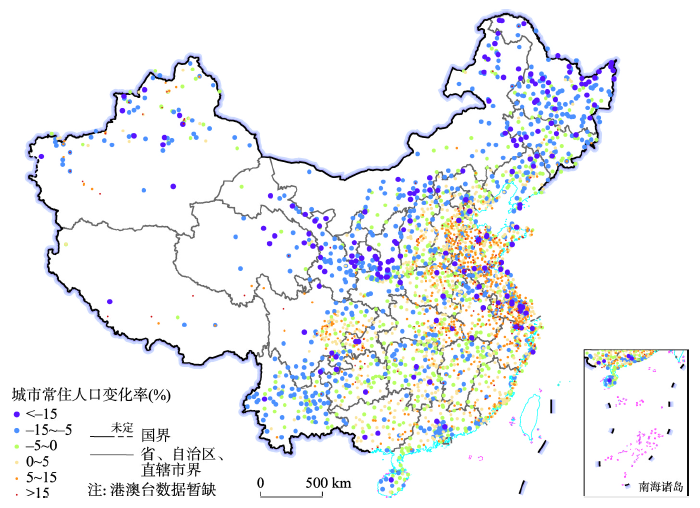
2016─2018年中国常住人口数量增加的实体城市共1516座,占实体城市的50.2%;常住人口数量减少的实体城市共1506座,占实体城市的49.8%,广泛分布于中国的一、二级阶梯及第三级阶梯的东北部(图2),其中,常住人口变化率≤ -15%的实体城市共177座。研究发现,人口流失的实体城市数量及面积占比超过50%的省区主要分布在中国西部,包括甘肃、内蒙古、新疆、青海、宁夏等省区,其中,甘肃省常住人口流失的实体城市数量占比为全国最高,达95.2%,面积占比达84.5%;东北地区的实体城市常住人口流失也较为严重,如吉林省人口流失的实体城市数量占比为80.8%,面积占比为78.9%;黑龙江省人口流失的实体城市数量占比达92.2%,面积占比为88.6%;北京、海南、云南、广东等省(市)的实体城市也呈现出较为严重的常住人口流失状况,云南、海南两省的人口流失实体城市面积占比均超过98.2%。重庆、天津、上海、深圳等地的实体城市常住人口数量则较为稳定。图2
 新窗口打开|下载原图ZIP|生成PPT
图22016—2018年中国3022座实体城市常住人口变化率
注:基于自然资源部标准地图服务网站GS(2020)4630号标准地图制作,底图边界无修改。
Fig. 2Change rate of permanent population in 3022 physical cities in China from 2016 to 2018
3.2 收缩城市的人口变化格局
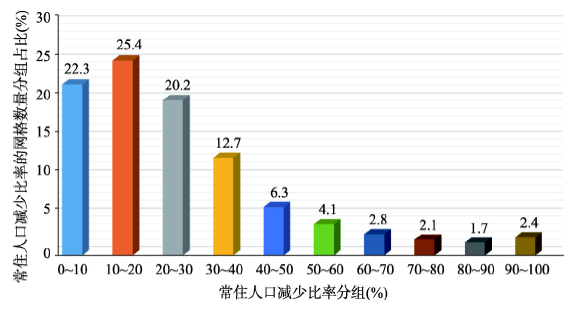
3.2.1 开展人口变化格局分析的收缩城市研究样本 针对常住人口变化率≤ -15%的177座实体城市,创建200 m×200 m的常住人口密度网格,选取常住人口密度> 2500人/km2的网格(7796个),计算每个网格在2016─2018年期间的常住人口变化率S,筛选出S<0的网格(5660个)。按常住人口减少率分组,统计不同减少率网格的占比特征(图3)。发现在5660个常住人口流失网格中,80.5%的网格常住人口减少率介于0%~40%之间。常住人口减少比率在10%~20%之间的网格数量占比最高,达25.4%。图3
 新窗口打开|下载原图ZIP|生成PPT
图32016—2018年不同常住人口减少比率的网格数量分组统计
Fig. 3Grouping statistics of the number of grids with different reduction ratios of permanent population from 2016 to 2018
根据收缩城市研究样本筛选方法,最终从177座收缩城市中筛选出126座收缩城市作为研究样本(图4)。收缩城市研究样本主要分布于中国秦岭淮河一线以北地区。其中,面积介于2~5 km2之间的有65座,占比51.6%;面积介于5~10 km2之间的有42座,占比33.3%;面积> 10 km2的有19座,占比15.1%。为逐个判定样本城市的人口变化格局,对样本城市逐一命名。当同一区内包含多个实体城市时,以“区名+编号”为实体城市命名,例如:北京市顺义区1、北京市顺义区2等;当同一县内包含多个实体城市时,面积最大的实体城市以“县名+主城”命名,其余实体城市以“县名+副城+编号”命名。
图4
 新窗口打开|下载原图ZIP|生成PPT
图42016—2018年中国126座收缩城市研究样本分布
注:基于自然资源部标准地图服务网站GS(2020)4630号标准地图制作,底图边界无修改。
Fig. 4Spatial distribution of the 126 sample shrinking cities in China from 2016 to 2018
3.2.2 中国收缩城市人口变化格局的类型及分布情况 根据收缩城市人口变化格局的识别标准(表1),结合常住人口减少的网格在城市内部的空间分布状态(图5),确定穿孔型收缩城市最多,达47座,占37.3%,主要分布于黑龙江省(8座),多为面积较大的市辖区实体城市,说明中国已有部分城市的市辖区出现了城市收缩,这些城市内部发生严重人口流失的空间范围较小,处于城市收缩的初级阶段;其次为全局型33座,占26.2%,主要分布于甘肃省(9座)、陕西省(6座),大部分为面积较小的县级实体城市,此类收缩城市集中于西北内陆腹地,多为贫困县或曾经的贫困县(
图5
 新窗口打开|下载原图ZIP|生成PPT
图5基于人口变化格局的中国收缩城市分类举例
注:根据人口密度对收缩城市内部的网格进行了筛选,因此网格不覆盖收缩城市全部范围
Fig. 5Example of different types of shrinking cities in China based on the patterns of population change
Tab. 2
表2
表2基于人口变化格局的中国收缩城市分类统计
Tab. 2
| 收缩城市类型(个数/占比%) | 实体城市名单 | |
|---|---|---|
| 全局型 (33/26.2) | 甘肃省(9):合水县、环县、临潭县、庆城县、山丹县、夏河县、庄浪县、民勤县、永昌县;陕西省(6):礼泉县、洛南县、旬邑县、延川县、宜川县、子长县;宁夏回族自治区(3):彭阳县、同心县、西吉县;青海省(3):德令哈市、湟源县、平安县;云南省(3):鲁甸县、施甸县、镇雄县;黑龙江省(2):抚远县2、逊克县;内蒙古自治区(2):多伦县、土默特左旗;新疆维吾尔自治区(2):霍城县、沙湾县 | |
| 局部型 (25/19.8) | 黑龙江省(7):北安市、海伦市、鸡西市城子河区1、穆棱市、饶河县、绥滨县、伊春市市辖区2;内蒙古自治区(5):阿荣旗、陈巴尔虎旗、科尔沁左翼中旗副城1、托克托县、牙克石市;新疆维吾尔自治区(3):博乐市、库尔勒市、昭苏县;吉林省(2):敦化市、农安县;陕西省(2):高陵县、永寿县 | |
| 圈饼型 (18/14.3) | 内蒙古自治区(5):包头市市辖区1、察哈尔右翼后旗、科尔沁左翼中旗主城、科尔沁左翼中旗副城2、兴和县;甘肃省(2):静宁县主城、正宁县;江苏省(2):灌南县、江都市 | |
| 穿孔型 (47/37.3) | 黑龙江省(8):巴彦县、大庆市市辖区2、桦川县、漠河县、饶河县主城、塔河县、依安县;甘肃省(3):积石山保安族东乡族自治县、兰州市市辖区2、玉门市;内蒙古自治区(3):根河市、呼和浩特市市辖区2、科尔沁右翼前旗;江苏省(3):常熟市、连云港市市辖区1、苏州市相城区2;山东省(3):日照市岚山区1、烟台市市辖区1、章丘市;浙江省(3):宁波市市辖区2、绍兴县、玉环县;安徽省(2):肥东县、宿州市市辖区2;广西壮族自治区(2):崇左市市辖区2、南宁市市辖区1;河南省(2):确山县、郑州市市辖区2;吉林省(2):吉林市昌邑区、梅河口市;青海省(2):都兰县、乌兰县;陕西省(2):黄陵县、铜川市市辖区2;新疆维吾尔自治区(2):若羌县、塔什库尔干塔吉克自治县 | |
| 边缘型 (3/2.4) | 黑龙江省(1):抚远县主城;海南省(1):白沙黎族自治县;陕西省(1):洛川县 | |
新窗口打开|下载CSV
4 讨论
4.1 收缩城市产生的总体原因分析
根据已有研究,虽然不同城市可能具有相似的收缩特征,但导致其收缩的本质原因则因城而异[32]。从“横向”来看,可分为内部推力和外部拉力两个部分,如A城由于产业转型滞后,导致经济衰退,人口流向经济快速发展的城市B,即区域发展的不平衡性导致的城市间人口趋向性流动;从“纵向”来看,收缩城市的形成受社会、经济、政策、自然等因素的影响[33]。社会因素如人口老龄化导致的人口结构失衡;经济因素如产业结构单一或资源枯竭导致的经济衰退;政策因素如行政区划调整或一些具有指向性的区域发展战略;自然因素如地形、气候等都会对人口的流动产生不同程度的影响,成为城市收缩的驱动因素[34]。4.2 穿孔型收缩成为中国收缩城市主导类型的原因
中国的收缩城市人口变化格局与西方发达国家相比,与原民主德国的收缩城市情况较为类似,均以穿孔型为主导类型。源于中国城镇化起步晚、速度快、质量偏低,仅用40年的时间经历了发达国家上百年才走过的城镇化进程,一定程度上出现了“城镇化冒进”的现象[35]。加之,自上而下以“增长”为主导的城市规划导致城市土地快速扩张,土地城镇化与人口城镇化增长速度总体失调,土地城镇化超前[36],人口密度被稀释,导致部分地区出现城市空洞;再次,资源枯竭或经济转型导致计划经济时期分散布局于内城的“单位大院”随工厂的衰落而解体,产生联动效应,部分地区原有居民外流,闲置、荒废的空间与尚在使用的空间交错混合,形成不连续的城市肌理[20],且闲置的厂院往往面积较大,治理成本高、难度大,成为被遗忘的闲置资产,对其周边环境产生着负面的影响。如:陕西省铜川市,是中国有名的老工业及资源型城市,由于资源枯竭及全国经济结构的调整,其煤炭、陶瓷、机电制造等支柱产业逐渐衰落,形成大量工业遗产,部分地区人口流失使其形成了穿孔型的人口变化格局;最后,自1990年,各类经济开发区一直作为中国城市经济与空间增长的主要载体。在特定产业发展意图的引导下,政府对于衰退的传统企业提出土地收储计划,并进行战略储备。对于仍然具有潜力但是不符合地区产业发展定位的存量企业,通过厂区腾退置换、增量外迁等方式,引导产能逐步向开发区转移,这也会导致城市部分地区人口的外迁[20]。综上,“重速度、轻质量”的前半程城镇化,以“增长”为主导的城市规划执念,资源枯竭或经济转型导致传统工业企业衰落解体,政府主动调整下的产业转移等因素致使中国产生众多穿孔型收缩城市。4.3 收缩城市的应对策略
对于穿孔型和局部型的收缩城市而言,还处于人口流失的初期阶段,没有形成集中连片的或全域覆盖的城市内部人口空洞,如果尽早发现并积极采取相应措施进行治理,有助于城市的复兴发展;而对于全局型的收缩城市,城市内部人口流失情况较为严重,受区域发展的不平衡性影响较大,需要完善这些城市的基础设施建设,创造就业机会,采取切实措施保障民生;中国圈饼型收缩城市的数量要远高于边缘型的收缩城市,说明中国部分城市存在郊区化现象,内城人口流失比较严重,需要调整以增长为导向的城市规划的惯用思维,注重内城的城市更新与改造,提高存量用地的利用效率。其次,面对资源枯竭、财政紧张、人力资源匮乏导致内生动力缺失的收缩城市,城市复兴困难重重。应辩证的看待城市收缩,承认部分城市收缩的不可逆性,调整城市规划设计应对的手法,正确应对城市收缩带来的机遇与挑战。对于收缩城市的规划设计应对,西方国家有较多的成功案例值得借鉴,如美国的Youngstown 2010规划(Youngstown 2010 Citywide Plan),主张将闲置用地看作解决城市环境问题的机遇,通过将闲置用地改造为绿色基础设施,使现有房屋的价值有所提升,调节生态环境,缓解土地市场的低迷,从而提高市民生活质量、缓解人口流失[37];德国西柏林(West-Berlin)承认城市人口已无法恢复原有水平,主张将收缩城市在原有大城市的基础上进行缩减,城市开发和公共消费集中在现有城市足迹(Urban Footprint)的关键节点,同时降低这些关键节点之间的衰败区域的人口。这样,通过集中城市人口、精简城市服务,缓解城市财政问题[38]。总结发达国家收缩城市的规划设计应对主要以“合理精简”为目标,以空间改造与绿色基础设施营建为具体措施。中国缺乏收缩城市规划设计应对的实践经验与成功案例,2019年“第一届中国收缩城市规划设计工作坊”以鹤岗市中心城为设计区域,进行了中国收缩城市规划设计应对的初探,其主要设计思路为顺应收缩城市的发展轨迹,以“合理精简”为主要目标导向,以期实现鹤岗市的精明收缩。但由于城市发展背景、存在的问题各不相同,尽管工作坊的部分手法对中国其他城市有一定的借鉴意义,但仍然需要更多针对国内其他类型收缩城市的规划实践和探索,便于国内收缩城市设计应对的横向比较,从而形成较系统全面的设计应对策略。
5 结论
本文采用实体城市及百度慧眼常住人口数据对中国收缩城市人口变化格局的深入探究,得出结论如下:(1)2016─2018年中国3022座实体城市中,常住人口减少即发生收缩的实体城市共1506座,占比为49.8%。人口流失的实体城市数量及面积占比超过50%的省级行政区主要分布在中国西部,包括甘肃、内蒙古、新疆、青海、宁夏等省区。其中,甘肃省常住人口流失的实体城市数量占比为全国最高,达95.2%,面积占比达84.5%;东北地区的实体城市常住人口流失也较为严重,如黑龙江省和吉林省人口流失的实体城市数量及面积占比均在75%以上。
(2)进行人口变化格局分析的126座收缩城市研究样本,主要分布于中国秦岭淮河一线的北部地区。其中,面积在2~5 km2之间的有65座,占比51.6%;面积在5~10 km2之间的有42座,占比33.3%;面积> 10 km2的有19座,占比15.1%。说明中国面积越小的实体城市发生严重人口流失的概率越大。
(3)126座收缩城市研究样本中,人口变化格局的类型主要包括穿孔型(47座)、全局型(33座)、局部型(25座)、圈饼型(18座)和边缘型(3座)。穿孔型是中国收缩城市的主导类型。
(4)中国穿孔型收缩城市多为市辖区实体城市,其内部发生严重人口流失的空间覆盖范围较小,处于城市收缩的初级阶段。“重速度、轻质量”的前半程城镇化,以“增长”为主导的城市规划理念,资源枯竭或经济转型导致的传统工业、企业的衰落解体,以及政府主动调整下的产业转移使得穿孔型成为中国收缩城市人口变化格局的主导类型。
虽然本文尚缺乏在地研究,百度慧眼数据只能回溯到2016年,但所发现的初步结果,弥补了中国收缩城市人口变化格局研究的空白,对丰富收缩城市的空间理论具有促进作用。后续将随着时间的推移,对研究结果进行持续更新。
参考文献 原文顺序
文献年度倒序
文中引用次数倒序
被引期刊影响因子
[本文引用: 4]
[本文引用: 4]
DOI:10.1080/13563470802519097URL [本文引用: 1]
[本文引用: 1]
[本文引用: 1]
DOI:10.1016/j.cities.2015.11.008URL [本文引用: 1]
PMID:22518881 [本文引用: 1]

Urban shrinkage is not a new phenomenon. It has been documented in a large literature analyzing the social and economic issues that have led to population flight, resulting, in the worse cases, in the eventual abandonment of blocks of housing and neighbourhoods. Analysis of urban shrinkage should take into account the new realization that this phenomenon is now global and multidimensional — but also little understood in all its manifestations. Thus, as the world's population increasingly becomes urban, orthodox views of urban decline need redefinition. The symposium includes articles from 10 urban analysts working on 30 cities around the globe. These analysts belong to the Shrinking Cities International Research Network (SCIRN), whose collaborative work aims to understand different types of city shrinkage and the role that different approaches, policies and strategies have played in the regeneration of these cities. In this way the symposium will inform both a rich diversity of analytical perspectives and country-based studies of the challenges faced by shrinking cities. It will also disseminate SCIRN's research results from the last 3 years.
[本文引用: 1]
[本文引用: 1]
[本文引用: 1]
[本文引用: 1]
[本文引用: 1]
[本文引用: 1]
DOI:10.1068/a36274URL [本文引用: 1]
DOI:10.1016/j.apgeog.2013.02.014URL [本文引用: 1]
DOI:10.1068/a45302URL [本文引用: 1]
[本文引用: 1]
DOI:10.3390/ijgi6040124URL [本文引用: 1]
[本文引用: 1]
DOI:10.1016/j.progress.2009.09.001URL [本文引用: 3]
DOI:10.1016/j.eiar.2007.09.004URL [本文引用: 3]
[本文引用: 1]
[本文引用: 1]
[本文引用: 1]
[本文引用: 1]
[本文引用: 1]
[本文引用: 1]
[本文引用: 3]
[本文引用: 3]
[D].
[本文引用: 1]
[D].
[本文引用: 1]
[本文引用: 1]
[本文引用: 1]
[本文引用: 3]
[本文引用: 3]
DOI:10.11821/dlyj020200359 [本文引用: 1]
While China′s urbanization has been characterized by 'growth-oriented' development models, the recent literature has highlighted the emergence of urban shrinkage in China, i.e., cities and regions that endure sustained population losses. This is especially the case for some resource-based cities in Northeast and North China, which have been losing their population and suffering from stagnant and even negative local GDP growth. Shrinking cities is a new phenomenon for research in the areas of population-resources-environments, spatial planning and urban governance in China. Based on a brief review of related literature, this paper summarizes some misunderstandings in the research of shrinking cities in China. It is a challenge to identify shrinking cities scientifically because of different demographies, different classification standards and disconnection between attributes data and geographic units. Extending from the suggestion from Zhou and Shi (1995), this paper, based on urban physical areas comparison and urban administrative areas test, analyzes the changes of China′s urban population and proposes a framework to identify the shrinking cities. The results show that there are 114 designated cities, in which the population size of the "Chengrenkou" (residential population in the built-up area) in 2010 was smaller than that of the "Shirenkou" (residential population in the administrative area) in 2000. However, due to a larger "Shirenkou" size in 2000 in statistics than in actual situation, and also several inflated figures of "Chengrenkou" in 2010, the exact number of "shrinking cities" is less than 114. After excluding "urban administrative areas" with a larger rural population, 56 cities and 75 cities were in net outflow in 2000 and 2010, respectively. The results are highly policy-relevant, therefore we should adjust future policies regarding urban shrinkage management. Finally, this paper argues that China should establish the concept of urban physical areas and promote the regional collaborative statistical system of urbanization. And it is also necessary to build a "spatio-temporal aligned" geographic information system database of China's resident population and take the regional differences in the administrative divisions into account in order to continuously promote the accurate division of urban and rural population.
[本文引用: 1]
DOI:10.1061/(ASCE)UP.1943-5444.0000628URL [本文引用: 1]
[本文引用: 1]
DOI:10.3390/su11246906URL [本文引用: 1]
[本文引用: 1]
PMID:22518884 [本文引用: 1]
Many American and European cities have to deal with demographic and economic trajectories leading to urban shrinkage. According to official data, 13% of urban regions in the US and 54% of those in the EU have lost population in recent years. However, the extent and spatial distribution of declining populations differ significantly between Europe and the US. In Germany, the situation is driven by falling birth rates and the effects of German reunification. In the US, shrinkage is basically related to long-term industrial transformation. But the challenges of shrinking cities seldom appeared on the agendas of politicians and urban planners until recently. This article provides a critical overview of the development paths and local strategies of four shrinking cities: Schwedt and Dresden in eastern Germany; Youngstown and Pittsburgh in the US. A typology of urban growth and shrinkage, from economic and demographic perspectives, enables four types of city to be differentiated and the differences between the US and eastern Germany to be discussed. The article suggests that a new transatlantic debate on policy and planning strategies for restructuring shrinking cities is needed to overcome the dominant growth orientation that in most cases intensifies the negative consequences of shrinkage.
DOI:10.1016/j.cities.2007.01.007URL [本文引用: 1]
DOI:10.1177/0308518X211006118URL [本文引用: 1]
[本文引用: 1]
[本文引用: 1]
[本文引用: 1]
[本文引用: 1]
DOI:10.13249/j.cnki.sgs.2020.09.006 [本文引用: 1]
In the process of rapid urbanization in China, there has been the coexistence of urban growth and shrinkage, among which resource-based cities are more typical. The research on the process and influence mechanism of urban growth and shrinkage is helpful to optimize the development path of resource-based cities and the appropriate planning response. In this paper, we take Jixi City, Hegang City, Shuangyashan City and Qitaihe City in Heilongjiang Province as case cities. From the idea of urban comparative study, the process of urban growth and shrinkage of the four cities is quantitatively characterized and its factors are analyzed by means of mean square decision-making method and partial least square method. The advantage of using mean square decision-making is to avoid errors of subjective evaluation. The partial least square method has gathered the advantages of PCA, correlation analysis and MLR method. The aim to use PLS here is to solve the multicollinearity problem of variables. The results show that: 1) The four cities are not in a state of continuous shrinkage, but the growth and shrinkage alternately. This result is in line with the characteristic that the development of mining cities change with the mining market. 2) From the perspective of factors of urban growth and shrinkage process, Jixi City is mainly affected by residents’ income and consumption, Hegang City is mainly affected by industry and investment, Shuangyashan City is mainly affected by the manufacturing industry and investment, and Qitaihe City is mainly affected by coal production. The four cities have different influential factors mainly in aspects of social development, external investment, and industrial transformation. In addition, each factors has different influencing extend on different cities. Therefore, we will see that cities with similar resource endowment could have different influential factors on urban growth or shrinkage. 3) From the perspective of difference, the process of urban growth and shrinkage and the difference of influence mechanism are mainly determined by the difference of alternative industry selection, the competition between cities, and the external influence and other factors.
[本文引用: 1]
[本文引用: 1]
[本文引用: 1]
[本文引用: 1]
[本文引用: 1]
[本文引用: 1]
[本文引用: 1]
[本文引用: 1]
[本文引用: 1]
