 ,1,2, 史海金1, 杨毕红1, 许玉婷1, 李研1
An analysis framework on enterprise communities' renewal potential of land use in the city and its application
WU Wenheng,1,2, SHI Haijin1, YANG Bihong1, XU Yuting1, LI Yan1收稿日期:2020-10-29修回日期:2021-06-6
| 基金资助: |
Received:2020-10-29Revised:2021-06-6
| Fund supported: |
作者简介 About authors
吴文恒(1977-), 男, 江苏邳州人, 博士, 教授, 博导, 主要从事城乡发展与规划、人口与资源环境研究。E-mail:

摘要
关键词:
Abstract
Keywords:
PDF (2719KB)元数据多维度评价相关文章导出EndNote|Ris|Bibtex收藏本文
本文引用格式
吴文恒, 史海金, 杨毕红, 许玉婷, 李研. 城市企业社区用地更新潜力分析框架与应用. 地理学报, 2021, 76(10): 2391-2406 doi:10.11821/dlxb202110005
WU Wenheng, SHI Haijin, YANG Bihong, XU Yuting, LI Yan.
1 引言
1990年欧洲社区委员会(Commission of the European Communities, CEC)提出紧凑城市的空间规划模式,以控制城市的无节制蔓延对土地的低效利用,改善人居环境,提升城市效率[1]。精明增长、田园城市、紧凑城市、城市增长边界等理念和手段,都试图约束城市规模,限制扩张[2,3,4]。伴随中国经济发展从高速转向中高速阶段,被掩盖的隐性问题日益显现,倒逼城市空间的增长主义走向终结[5],以内涵提升为核心的“存量”乃至“减量”规划,成为中国空间规划新常态[6]。盘活既有资源,实施存量更新是不可回避且亟待研究的命题。在保持建设用地总规模不变、城市空间不扩张的条件下,优化、挖潜、提升存量用地,实现城市发展[7]。目前城市用地潜力的研究主要有3方面:① 城市土地(集约)利用潜力评价。通过构建指标体系,采用综合评价方法,分析土地集约利用潜力[8,9,10,11,12]。研究尺度包括区域不同城市土地集约利用或土地利用综合效益[13,14],城市[15]、城市片区或某一类型用地[11, 16]以及单个或多个案例社区的土地集约利用潜力[17,18,19,20,21]。研究方法除指标体系与综合评价以外,还包括自组织理论[12]、技术效率测算与集约潜力评价[14]及GIS技术应用等。评价的关键是检视土地资源使用效率,估量可能的优化利用空间,结果多是得到评价单元利用潜力的相对大小。② 单位制社区土地利用转型或挖潜研究。基于典型案例,分析转型时期单位社区用地结构变化、功能转化以及土地利用挖潜的表现[22,23],诸如生活服务用地、广场绿地减少,居住、商业用地增加[24];土地功能由仓储工业主导变为生产生活多功能复合,分区严整的用地斑块呈现出混合、细碎的马赛克[25,26];内部地块分割、底层周边空间及非正规建设用地市场化、集约化与精细化利用[27,28]。侧重实地考察与案例剖析,深刻阐释用地转型或挖潜的表现与逻辑。③ 从规划的角度基于社区开展城市微更新。其实质是社区治理,比如通过实践案例探索社区微更新[29],利用质性方法探析社区更新与治理,以微观角度完善、提升社区的结构和功能[30]。
总的看,现有研究缺乏城市老旧空间平面与立体结合的用地更新潜力综合认识,缺少大数据与城市尺度用地更新潜力的判断,没有准确刻画城市用地更新潜力的面积大小和集约利用程度,这恰是规划城市建设用地以及当前城市内部更新与集约利用空间需要回答的关键所在。企业社区(Enterprise Community, EC)是计划经济时期由企业出资建设和负责管理,以解决职工住房与生活为宗旨,与企业邻近,占据一定空间并延续下来的社区类型,包括工业企业社区、建筑业社区等,是单位社区的重要组成部分[31]。中国诸多城市,特别是老工业城市( 老工业城市是“一五”“二五”和“三线”建设时期国家布局建设、以重工业骨干企业为依托聚集形成工业基地的基本单元。根据《全国老工业基地调整改造规划(2013—2022年)》,全国共有120个老工业城市,分布在27个省(区、市)。),传统工业企业及其居住社区众多。经过市场化改革、国企改革与住房改革,一些城市的企业社区经历较为成功的改造或向城市社区转型,甚至重新焕发活力,但多数这些城市的大量企业社区在建筑生命周期等作用下逐渐步入衰退发展阶段,居住建筑老旧,基础设施与公共设施陈旧,社区环境破旧,成为新贫困空间和城市更新、内城空间再利用的重要场地[31]。
整体上,城市企业社区这类用地在平面与立体空间上有多大可待更新的潜力,空间分布及两者的匹配关系怎样?因此,如何评估城市企业社区用地更新潜力及其空间分布特征成为重要的科学问题。本文构建平面、立体空间和两者关联性3个维度的城市企业社区用地更新潜力分析框架,探究用地更新潜力及空间分布特征,以西安市为案例进行验证。研究结果对制定旧城改造和用地更新政策,释放存量土地红利,缓解城市用地供需矛盾,完善内城居住空间演替理论、新城市主义与城市更新理论,实现城市内涵式发展、可持续发展具有重要理论与现实意义。
2 城市企业社区用地更新潜力分析框架
企业社区用地更新潜力指响应精明增长与节约集约用地,面向城市更新、街区振兴和老旧小区改造的需要,在城市、片区、街区或单体尺度上企业社区所能提供的用地更新数量与质量状况,包括用地面积更新潜力、用地集约利用潜力等。2.1 城市企业社区用地更新潜力的内涵
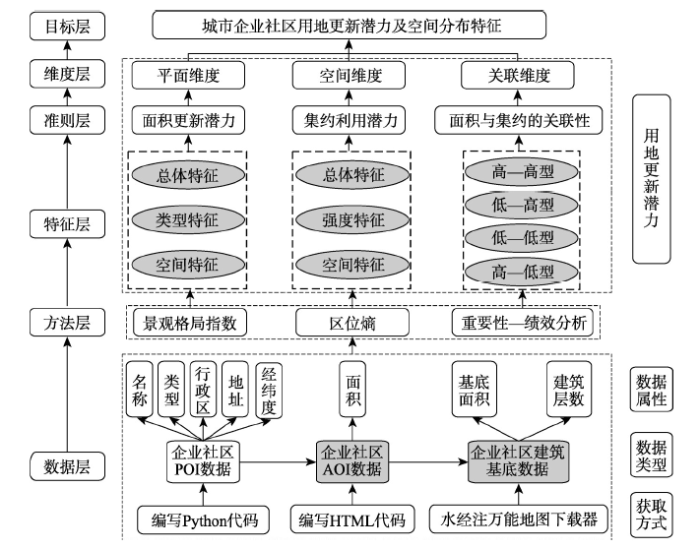
根据上述,企业社区用地更新潜力主要包含两方面内容,一是平面上可更新面积大小,这里指企业社区用地面积的最大更新潜力;二是空间上建筑密度、容积率相对于城市居住区用地标准的差距。因此,从城市尺度构建企业社区用地更新潜力分析框架,需要考虑3个方面:① 社区土地面积,包括总体状况、不同面积类型特征及其空间分布;② 空间集约利用,包括总体状况、不同集约利用强度(立体空间更新潜力强度)及其空间分异;③ 两者的关联性,可能出现面积更新潜力与集约利用潜力都大的社区(高—高型)、面积更新潜力小集约利用潜力大的社区(低—高型)、两者都小的社区(低—低型)与面积更新潜力大集约利用潜力小的社区(高—低型)4种关联关系。当然,获取具体企业社区的面积数据与建筑面积数据是研究的基础和关键。本文从社区土地面积、空间集约利用和两者关联性出发,采用企业社区兴趣点(Point of Interest, POI)、兴趣面(Area of Interest, AOI)数据与建筑基底数据,以及景观格局指数、区位熵、重要性—绩效分析(Importance-performance Analysis, IPA)等方法,构建基于平面维度、空间维度和关联维度的分析框架,探究城市企业社区用地更新潜力特征(图1)。
图1
 新窗口打开|下载原图ZIP|生成PPT
图1城市企业社区用地更新潜力分析框架
Fig. 1Analysis framework of ECs' renewal potential of land use in the city
2.2 企业社区面积数据获取
大数据为地理复杂性研究提供新机遇,是探究城市居住社区的有用方式[32]。相关研究诸如根据手机信令等多源数据分析城市居住空间选择行为[33],基于社会化媒体与大数据方式进行城市社区治理[34],以及将地理信息大数据与GIS空间分析、地学信息图谱相结合,应用于城市社区生活质量评价[35]。参考上述与已有研究[36],编写Python代码,获取百度地图城市范围内所有住宅区的POI数据,包含名称、类型、地址、经纬度、所属行政区等属性;以城市分区、街道为筛选条件,获得街道的住宅区数据;到各街道办事处与街道社区服务中心核实企业社区,合并、删除同一社区的重复点;随机走访企业社区核准社区类型与年代,最终确定企业社区POI数据。
根据百度地图可以显示住宅小区轮廓范围的这一特点,编写HTML网页代码建立百度地图地物边界绘制工具,结合已得到的企业社区名称,在线手动绘制社区边界。鉴于每一个社区边界由若干带有顺序编号和经纬度的点组成,进而在ArcGIS中通过点集转线、线转面工具,批量获取企业社区AOI数据。
使用水经注万能地图下载器下载城市建筑的楼块轮廓信息数据(含基底面积与建筑层数),以企业社区AOI数据为边界范围,在城市建筑矢量数据的基础上,筛选和校正企业社区建筑基底数据,得到企业社区建筑基底面积和建筑总面积。
最后,按照10%~20%的比例,随机抽取企业社区并考虑街道分布的均匀性原则,基于实地走访、察看社区平面图、问询街道办事处人员、社区物业与居民、GPS现场测量等方式,验证企业社区AOI数据、建筑基底面积、建筑层数等数据的可靠性与准确性。
2.3 用地更新潜力分析方法
本文采用景观格局指数与GIS空间分析方法,分析企业社区用地面积更新潜力及其空间分布,采用区位熵法与统计分析方法分析企业社区立体空间上的用地集约利用潜力。2.3.1 景观格局指数 景观格局是大小和形状不一的景观镶嵌体在景观空间上的排列[37,38],通过一系列的面积、形态、集聚和多样化指标来量化和表征[39]。景观格局指数是高度浓缩的景观格局信息,是反映景观结构组成、空间配置特征的量化指标[40],主要包括斑块面积、类型面积、总面积、斑块周长、斑块密度、斑块数量、斑块面积百分比、平均最小斑块距离等,多用于分析区域耕地、林地、草地、水体、建筑用地等不同类型土地利用及其覆被变化[41,42]。
斑块是景观格局的基本组成单元,是指不同于周围背景、相对均质的非线性区域[43]。解译获得的企业社区AOI数据,即为大小和形状不一的景观镶嵌体,它们构成了城市景观空间结构中的斑块这一基本要素。本文对城市区域内的企业社区按面积大小划分多种斑块类型,类比不同土地利用类型,以刻画企业社区土地更新潜力的异质性特征。具体包括:① 企业社区总体景观格局特征。总体景观格局特征可以从城市企业社区总数量、总面积与密度3方面反映,类同于景观生态学中斑块数量(NP)、斑块总面积(TA)、斑块密度(PD)3个景观格局指数表征的斑块总体特征。斑块总面积和斑块数量表示企业社区总体规模特征,斑块密度表示企业社区总体分布特征。② 企业社区类型景观格局特征。可以从分类型企业社区的数量、面积以及面积的均匀程度体现。分类型企业社区数量通过斑块类型数量(NP)表征,分类型企业社区面积用斑块类型面积(CA)、斑块面积百分比(PLAND)与斑块平均面积(MPS)3个景观格局指数表示,分类型企业社区面积的均匀程度用斑块大小标准偏差(AREA_SD)表示。③ 企业社区空间分布特征。用地更新潜力分布主要考虑不同面积区段内企业社区斑块的空间聚集性,包括分类型的企业社区密度和空间集聚程度两方面,借助斑块密度(PD)与平均最小斑块距离(ENN_MN)2个指数反映(表1)。
Tab. 1
表1
表1景观格局指数
Tab. 1
| 指数 | 指数含义 | 计算公式 |
|---|---|---|
| 斑块类型数量(NP) | 某斑块类型中所有斑块数量(个) | |
| 斑块密度(PD) | 单位面积上的斑块数量(块/km2) | |
| 斑块类型面积(CA) | 某一斑块类型面积总和(hm2) | |
| 斑块面积百分比(PLAND) | 某一斑块类型面积与景观总面积之比(%) | |
| 斑块平均面积(MPS) | 某一斑块类型的平均斑块面积(hm2) | |
| 斑块大小标准偏差(AREA_SD) | 反映数据集的离散程度 | |
| 平均最小斑块距离(ENN_MN) | 反映某斑块类型聚集程度(m) |
新窗口打开|下载CSV
2.3.2 区位熵法 反映城市土地集约利用的指标较多,诸如二三产业增加值、二三产业就业人员数、固定资产投资额、二三产业用电量[14]、建筑密度、容积率、功能混合度[12]、地均利税额、投入产出比、地均劳动力人数、地均耗电量、地均耗水量[11]等。本文用地更新潜力单元为企业社区,现有用地不涉及具体产出效益问题。在不改变用地性质的前提下,企业社区用地集约利用潜力与居住标准下的建筑密度、容积率等指标关联较大。
假设社区用地使用可以满足《城市居住区规划设计标准》(GB50180—2018),这里为简便起见,基于建筑密度、容积率两个指标( 住宅用地容积率是居住街坊内,住宅建筑及其便民服务设施地上建筑面积之和与住宅用地总面积的比值;建筑密度是居住街坊内,住宅建筑及其便民服务设施建筑基底面积与该居住街坊用地面积的比率(%)。),采用区位熵法[44],计算企业社区立体空间上的用地集约利用潜力。区域经济学中,城市某部门或某个产业在区域或全国的区位熵大于1,表示该部门或产业有区际意义,可视为该城市的主导部门或产业。用企业社区的容积率与建筑密度的比值代表企业社区的立体空间利用状况,类比区位熵原理,当该比值小于用作标准的城市居住区的容积率与建筑密度的比值,表明企业社区在立体空间上有更新潜力。企业社区容积率与建筑密度的比值越小,用地集约利用的更新潜力越大。公式表示为:
式中:PILUEC代表企业社区用地集约利用潜力(EC's Potential of Intensive Land Use);PRRL为参照的住宅用地容积率(Plot Ratio of Residential Land);BDRL为参照的住宅用地建筑密度(Building Density of Residential Land);PRRLEC、BDRLEC分别为企业社区用地容积率(EC's Plot Ratio of Residential Land)、企业社区建筑密度(EC's Building Density of Residential Land)。PILUEC > 1,表示企业社区在立体空间上有更新潜力。采用陕西所在的第Ⅱ建筑气候区、高层Ⅱ类(19~26层)住宅用地容积率(2.9)、建筑密度最大值(20%)为参照( https://www.soujianzhu.cn/Norm/JzzyXq.aspx?id=362。)。
进一步地,基于统计分析方法计算研究区内所有企业社区立体空间更新潜力的算术平均值(M)和标准差(SD)。当1<PILUEC<1+SD时,视为C型企业社区,立体空间更新潜力的强度相对较小;1+SD ≤ PILUEC<1+2SD时,视为B型企业社区,强度较大;PILUEC ≥ 1+2SD时,视为A型企业社区,更新潜力的强度大。
2.4 重要性-绩效分析
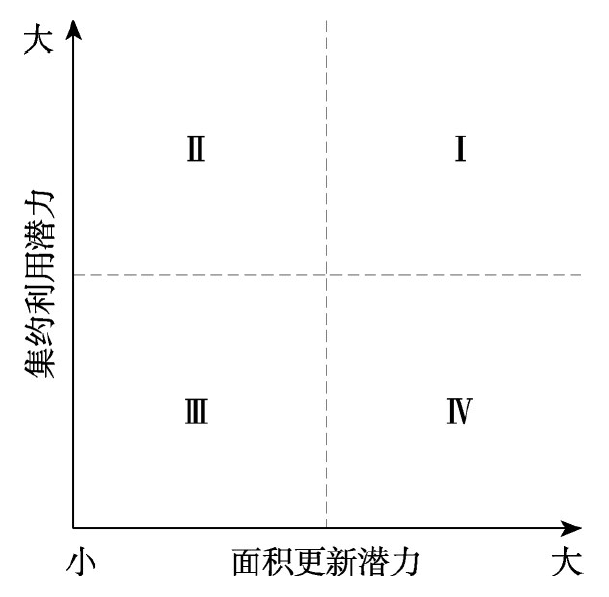
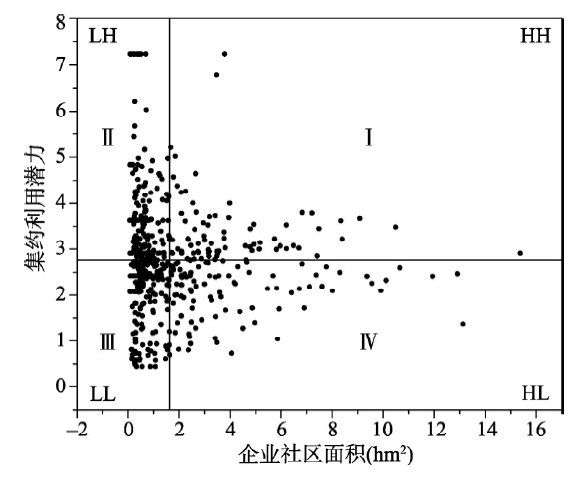
IPA方法最初在市场营销领域被提出,包括重要性(I)和绩效(P)两个方面,核心思想是使用者对产品各项属性的重视程度和绩效表现的评价[45],将两者得分表示在同一坐标网格,纵轴表示重要性,横轴代表绩效。根据各项属性的重要性和绩效得分的平均值,确定两个平均值的交叉点,由此划分4个象限,评价重要性和绩效的关联性。借鉴该方法,将每个企业社区的集约利用潜力与面积更新潜力视为产品各项属性的重要性与绩效得分,划分至4个象限(图2),进行关联性分析。第Ⅰ象限为高—高型(HH)社区,第Ⅱ象限为低—高型(LH)社区,第Ⅲ象限是低—低型(LL)社区,第Ⅳ象限是高—低型(HL)社区。第Ⅲ、Ⅳ象限集约利用潜力较小,说明企业社区建筑年代相对较新、楼层较高或可能得到了部分乃至全部楼栋立体空间上的更新改造。第Ⅱ象限企业社区的面积更新潜力小,集约利用潜力相对大,社区建筑年代一般较为久远,单纯从用地更新潜力与开发价值的角度考虑,是较优考虑的对象;第Ⅰ象限企业社区面积更新潜力与集约利用潜力都大,多是占地大、居民多、历史久的社区,应优先考虑更新改造。理论上,社区未来发展,需要重点关注第Ⅰ、Ⅱ象限的企业社区。图2
 新窗口打开|下载原图ZIP|生成PPT
图2企业社区IPA分析图
Fig. 2Diagram of importance-performance analysis of the ECs
3 西安市的应用
3.1 研究区概况
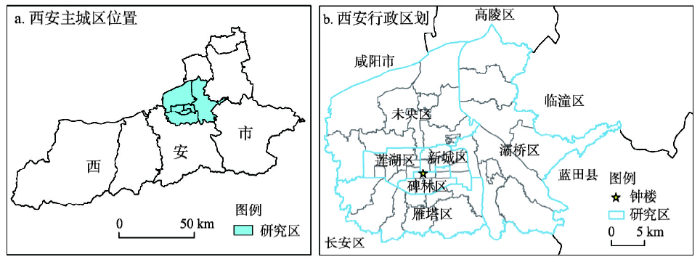
西安是计划经济时期重点建设城市。“一五”计划156个重点项目有24项布置到陕西,其中17项位于西安市,城区布局13项。城市功能由基础薄弱的商贸中心型转向工业中心型,形成电力机械、仪器仪表、兵器、航空等大型机械行业构成的早期工业空间[46]。“二五”计划强化西安重型机械、冶炼、化学等工业项目,使之成为支援西北各省工业建设的基地。“三线”建设时期,该市是战略后方的重点地区之一,国家投资及其他省市支持,给工业注入新的动力。20世纪80年代,一批“三线”时期企业迁入西安,增加了企业社区的城市布局。2013年《全国老工业基地调整改造规划(2013—2022年)》确定120个老工业城市,西安市灞桥区作为省会的市辖区被列入其中。总体上,西安老工业企业及其社区众多,属比较典型的老工业城市,具有研究的代表性与典型性。目前,少量在运营的企业自主管理社区,部分被兼并重组企业的社区被粗放管理,大量破产倒闭企业的社区由国资委委托的物业管理机构维持运行。2016年以来企业社区陆续得到城市老旧小区供水、供电、供热与物业管理(简称“三供一业”)移交社会专业机构的政策支持,少数社区也经历内部的自主改造更新或者棚户区、老旧小区改造,但整体上社区老旧、建筑陈旧,居住空间有限,面临使用年限,生活环境条件较差等是共性问题。西安市企业社区多分布于碑林、雁塔、莲湖、灞桥、新城、未央6个市辖区(传统主城区)、54个街道(图3),呈大分散、小聚集的带状与团簇状分布[36]。本文以西安市传统主城区作为应用研究区。
图3
 新窗口打开|下载原图ZIP|生成PPT
图3西安市主城区位置示意及行政区划
Fig. 3Location and administrative division of Xi'an main urban area
3.2 数据获取与处理
3.2.1 企业社区POI数据 用Python程序从高德地图开放平台采集包含小区名称、类型、地址、经纬度、所属行政区等属性的西安市住宅小区POI数据,采集时间为2016年12月。对采集的基础数据进一步筛选,进行重复点的合并、删除等处理,共得到572个企业社区POI数据。通过Python编写坐标纠偏代码,将采集到的POI火星坐标纠正为WGS84坐标。然后,把POI数据导入ArcGIS,添加高斯克吕格投影坐标。3.2.2 企业社区AOI数据 ① 获取AOI数据。根据POI数据中包含的企业社区名称,编写HTML网页代码,解译社区AOI图像。基于街景地图手动修正AOI轮廓,得到572个目标AOI数据,即企业社区面积属性与边界轮廓。将该数据添加到ArcGIS中(WGS 84坐标系),得到社区边界的点要素,转化为面要素并可视化。采集时间为2018年12月。② 计算斑块面积。通过ArcGIS对企业社区AOI数据定义投影坐标系,在属性表中新建面积字段,计算其数值。③ 斑块类型划分。利用ArcGIS自然断裂点功能,对研究区的企业社区斑块断点分类,划分为0.07~1.18 hm2、1.18~2.77 hm2、2.77~5.17 hm2、5.17~8.38 hm2、8.38~15.37 hm2 5种类型。④ 栅格转化,校正分辨率。分析研究对象的景观格局指数时,过小的粒度会产生庞大的数据,增加分析难度,粒度过大则会模糊景观的空间异质性,使相邻斑块造成不同程度的合并[47]。反复试验不同大小的像元值,最终确定像元大小1.6 m×1.6 m时达到较好的效果,由于斑块合并,造成社区个数减少1个,最终得到571个企业社区斑块。⑤ 获取景观格局指标数据。将得到的栅格数据转为Tif文件,通过Fragstats 4.2识别企业社区类型并提取景观格局信息,获取NP、MPS、PD、PLAND、CA、AREA_SD、ENN_MN指标数据。
3.2.3 企业社区建筑面积数据 在西安市建筑矢量数据的基础上,以企业社区AOI数据为边界范围,基于ArcGIS平台筛选出企业社区建筑楼块轮廓信息数据(含建筑基底面积与楼层数),通过Google Earth、Omap、百度全景地图逐一核实和校正建筑基底数据,得到西安市企业社区建筑基底面积和建筑总面积。
在碑林区太乙路、张家村街道,雁塔区电子城、三桥街道,莲湖区桃园路、土门、枣园街道,灞桥区纺织城、洪庆街道,新城区胡家庙、韩森寨街道,未央区三桥、辛家庙街道等地,随机选择80余个企业社区,经过实地走访等环节验证,发现所得到的数据与实际有较高的一致性,保障了研究数据的准确性。
3.3 企业社区用地更新潜力
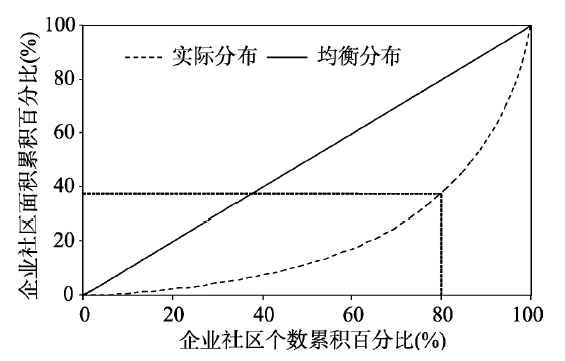
3.3.1 用地面积更新潜力 总体特征:企业社区用地更新潜力较大,但小型社区多。经统计,西安市企业社区用地可更新潜力为933.56 hm2,斑块平均面积1.63 hm2,斑块密度为0.69个/km2。企业社区数量上主要受0.07~1.18 hm2面积类型的斑块支配(表2),占斑块总量的62.87%。基于社区面积与数量的洛伦兹曲线可以看出(图4),80%的企业社区占了38.12%的面积,20%的社区占61.88%的面积,分化明显,呈现不平衡状态,也说明西安市企业社区规模普遍偏小,单个社区更新改造的规模效益小。Tab. 2
表2
表2西安市企业社区景观格局特征
Tab. 2
| 类型/面积范围(hm2) | 0.07~1.18 | 1.18~2.77 | 2.77~5.17 | 5.17~8.38 | 8.38~15.37 |
|---|---|---|---|---|---|
| CA (hm2) | 181.32 | 214.00 | 231.14 | 184.55 | 122.55 |
| PLAND (%) | 19.42 | 22.92 | 24.76 | 19.77 | 13.13 |
| NP (个) | 359 | 113 | 61 | 27 | 11 |
| PD (个/km2) | 0.43 | 0.14 | 0.07 | 0.03 | 0.01 |
| MPS (hm2) | 0.50 | 1.89 | 3.78 | 6.83 | 11.14 |
| AREA_SD | 0.30 | 0.45 | 0.68 | 0.88 | 1.88 |
| ENN_MN (m) | 207.56 | 471.12 | 531.53 | 690.43 | 2919.13 |
新窗口打开|下载CSV
图4
 新窗口打开|下载原图ZIP|生成PPT
图4西安市企业社区面积分布的洛伦兹曲线
Fig. 4Lorentz curve of area distribution of enterprise communities in Xi'an
类型特征:不同类型企业社区用地更新潜力差异大。面积范围0.07~1.18 hm2的企业社区数量最多(359个),但总更新潜力仅181.32 hm2(19.42%),斑块平均面积0.5 hm2。斑块大小标准偏差小(0.3),说明该类型企业社区面积普遍相差不大,与平均面积较接近。面积范围2.77~5.17 hm2的企业社区61个,可更新潜力相对最大(231.14 hm2),占总更新面积的24.76%,斑块平均面积3.78 hm2。面积范围8.38~15.37 hm2的企业社区数量少(11个),可更新潜力亦较少(122.55 hm2),但企业社区平均面积最大(11.14 hm2)。斑块大小标准偏差大(1.88),表明这一面积区段的企业社区面积相差明显。
计划经济时期,西安的纺织、仪器仪表、兵器等重要工业生产部门采用地域生产综合体的布局模式,建设“纺织城”、“电工城”、“军工城”等多个工业区,围绕主导产业配套大量中小型辅助部门,加以城市建有类型众多规模偏小的地方民生企业,西安石棉瓦厂、西安利民面粉厂、西安人民搪瓷厂等,这是大型企业社区少、中小型企业社区多的面积类型分异的重要成因。
空间特征:面积小的企业社区空间集聚分布,面积大的数量少且分散。面积范围0.07~1.18 hm2的企业社区斑块密度大(0.43个/km2),平均最小斑块距离小(207.56 m),与其他类型企业社区相比,说明该类型的企业社区数量多,空间分布呈聚集状态,有利于街区或片区改造开发。随着企业社区面积范围增大,斑块密度减小,平均最小斑块距离增大,企业社区趋于分散,聚集程度小。
具体来说(表3),面积范围0.07~1.18 hm2的小型企业社区大部分街道均有分布,以桃园路、长乐中路、土门、太乙路、张家村、胡家庙等街道集聚且占地面积稍大;1.18~2.77 hm2的企业社区主要分布在桃园路、土门、长乐中路、纺织城、电子城、红庙坡、三桥、太华路等街道;2.77~5.17 hm2的企业社区集中在长乐中路、韩森寨、桃园路、电子城等街道;5.17~8.38 hm2的企业社区分布在纺织城、长乐中路、电子城、韩森寨、枣园等街道(图5);8.38~15.37 hm2的企业社区分布在洪庆、纺织城、鱼化寨、等驾坡、徐家湾、辛家庙、张家堡、太乙路等8个街道。
Tab. 3
表3
表3西安部分街道不同面积区段的企业社区空间分布数量与面积
Tab. 3
| 行政区 | 街道 | 0.07~1.18 | 1.18~2.77 | 2.77~5.17 | 5.17~8.38 | 8.38~15.37 | |||||||||
|---|---|---|---|---|---|---|---|---|---|---|---|---|---|---|---|
| 数量(个) | 面积(hm2) | 数量(个) | 面积(hm2) | 数量(个) | 面积(hm2) | 数量(个) | 面积(hm2) | 数量(个) | 面积(hm2) | ||||||
| 莲湖区 | 桃园路 | 25 | 10.41 | 10 | 20.58 | 6 | 23.12 | 1 | 6.91 | 0 | 0 | ||||
| 土门 | 19 | 9.52 | 10 | 18.17 | 1 | 2.98 | 1 | 5.96 | 0 | 0 | |||||
| 红庙坡 | 14 | 8.38 | 7 | 12.11 | 1 | 3.47 | 0 | 0 | 0 | 0 | |||||
| 枣园 | 4 | 2.44 | 5 | 9.47 | 4 | 18.73 | 3 | 19.12 | 0 | 0 | |||||
| 新城区 | 胡家庙 | 17 | 10.81 | 4 | 7.46 | 1 | 3.20 | 0 | 0 | 0 | 0 | ||||
| 长乐中路 | 20 | 8.26 | 9 | 17.9 | 11 | 41.27 | 3 | 20.58 | 0 | 0 | |||||
| 韩森寨 | 11 | 6.74 | 4 | 6.92 | 7 | 29.38 | 3 | 19.63 | 0 | 0 | |||||
| 太华路 | 8 | 4.35 | 6 | 12.16 | 1 | 3.47 | 0 | 0 | 0 | 0 | |||||
| 碑林区 | 太乙路 | 18 | 12.30 | 2 | 3.02 | 2 | 7.20 | 0 | 0 | 1 | 9.56 | ||||
| 张家村 | 18 | 7.25 | 4 | 10.19 | 3 | 11.06 | 0 | 0 | 0 | 0 | |||||
| 灞桥区 | 纺织城 | 16 | 7.02 | 8 | 16.02 | 1 | 4.93 | 6 | 43 | 2 | 21.02 | ||||
| 灞桥 | 1 | 0.82 | 1 | 1.77 | 0 | 0 | 1 | 8.30 | 0 | 0 | |||||
| 洪庆 | 1 | 0.21 | 0 | 0 | 0 | 0 | 1 | 8.01 | 3 | 35.39 | |||||
| 雁塔区 | 电子城 | 14 | 7.42 | 7 | 13.85 | 6 | 21.85 | 3 | 20.12 | 0 | 0 | ||||
| 等驾坡 | 5 | 2.60 | 2 | 3.28 | 0 | 0 | 0 | 0 | 1 | 10.66 | |||||
| 鱼化寨 | 4 | 2.25 | 2 | 2.95 | 2 | 7.11 | 0 | 0 | 1 | 15.37 | |||||
| 未央区 | 张家堡 | 7 | 3.42 | 1 | 1.42 | 0 | 0 | 0 | 0 | 1 | 9.91 | ||||
| 三桥 | 5 | 2.96 | 6 | 14.13 | 2 | 7.78 | 0 | 0 | 0 | 0 | |||||
| 辛家庙 | 2 | 1.17 | 0 | 0 | 0 | 0 | 2 | 13.77 | 1 | 10.12 | |||||
| 徐家湾 | 1 | 0.36 | 2 | 3.17 | 0 | 0 | 0 | 0 | 1 | 10.48 | |||||
新窗口打开|下载CSV
图5
 新窗口打开|下载原图ZIP|生成PPT
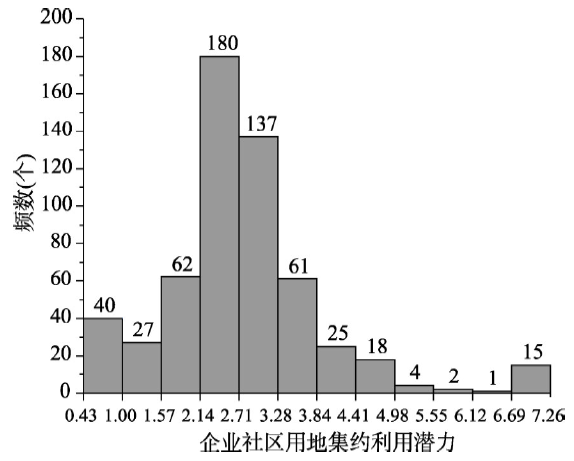
图5西安企业社区用地集约利用潜力频数分布
Fig. 5Frequency distribution of ECs' potential of intensive land use in Xi'an
可以看出,面积范围小的企业社区主要分布的桃园路、土门、长乐中路、张家村、韩森寨等街道,均位于当前建成环境成熟的内部市区(新城区、碑林区与莲湖区)(图3);面积大的企业社区所在的洪庆、纺织城、鱼化寨等街道,位于距城市中心(钟楼)相对较远的外围市区(灞桥区、未央区、雁塔区),这些企业及其社区多靠近对外交通干线(陇海铁路),带状展布。这符合小企业为共享基础设施、公共服务设施和住房就近城区布置,大企业及辅助部门组合布局、设施和服务受限较小、可以相对独立的规则[48,49],占地面积、环境、区位等也构成影响。
3.3.2 用地集约利用潜力 总体特征:企业社区集约利用潜力大。利用公式(1),得到572个企业社区用地集约利用潜力状况(图5)。PILUEC极小值为0.44,极大值为7.25,平均值为2.76,中位数为2.63。PILUEC大于1的企业社区532个,绝大多数企业社区(93.01%)在立体空间上有更新潜力,而且76.92%的企业社区(440个)PILUEC值介于1.57~3.84之间。
强度特征:B型企业社区居多。经计算,西安市PILUEC的标准差(SD)为1.19。据此划分企业社区立体空间上更新潜力的强度(表4),A型企业社区(PILUEC ≥ 3.38)118个(20.63%),平均楼层高度3.31层,立体空间可更新潜力大,以土门、桃园路、纺织城、韩森寨、枣园、电子城等街道为主。B型企业社区(2.19 ≤ PILUEC<3.38)320个(55.94%),平均楼层高度5.24层,呈小集聚、大分散的空间分布特点,以长乐中路、纺织城、电子城、桃园路、张家村、红庙坡、胡家庙、太乙路等街道数量居多。C型企业社区(1<PILUEC<2.19)94个(16.43%),平均楼层为7.88层,说明该类型企业社区立体空间利用水平稍高,更新潜力相对较低。更新潜力不明显或者没有更新潜力的企业社区有40个(7.34%),平均楼层为19.98层,这些社区多是已在原址修建高层楼幢,使得立体空间更新潜力不明显,与抽样调研结果相符。
Tab. 4
表4
表4西安部分街道企业社区更新潜力强度的空间分布
Tab. 4
| 行政区 | 街道 | A型 | B型 | C型 | 更新潜力不明显 |
|---|---|---|---|---|---|
| 新城区 | 韩森寨 | 7 | 10 | 5 | 3 |
| 长乐中路 | 4 | 23 | 12 | 4 | |
| 太华路 | 3 | 11 | 1 | 0 | |
| 胡家庙 | 4 | 14 | 2 | 2 | |
| 莲湖区 | 枣园 | 6 | 9 | 1 | 0 |
| 土门 | 13 | 11 | 7 | 0 | |
| 红庙坡 | 3 | 15 | 3 | 1 | |
| 环城西路 | 0 | 11 | 4 | 0 | |
| 桃园路 | 11 | 16 | 6 | 9 | |
| 碑林区 | 太乙路 | 2 | 13 | 5 | 3 |
| 张家村 | 3 | 16 | 4 | 2 | |
| 雁塔区 | 电子城 | 6 | 17 | 5 | 2 |
| 灞桥区 | 纺织城 | 11 | 20 | 2 | 0 |
| 未央区 | 三桥 | 5 | 6 | 2 | 0 |
新窗口打开|下载CSV
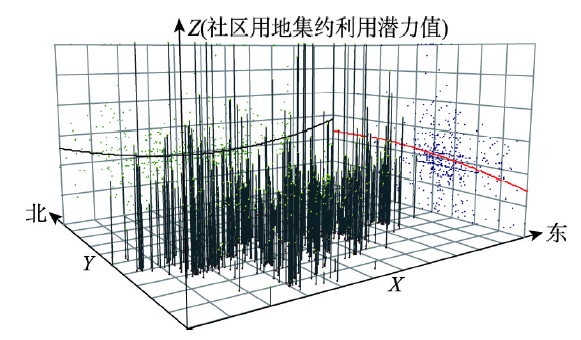
空间特征:东西方向企业社区用地集约利用潜力呈“U”型分异,由南向北利用潜力呈近线性增加趋势。采用全局趋势分析方法得到西安市企业社区用地集约利用潜力的空间分布趋势(图6),Z轴表示社区用地集约利用潜力值,与X轴(箭头为东)、Y轴(箭头为北)对应的线条分别表示东西方向与南北方向上趋势值的变化。通过趋势线可以看出,研究区东部和西部企业社区用地集约利用潜力高于内城中间地区,东西方向整体略呈“U”型分异格局;中北部企业社区用地集约利用潜力高于南部地区,由南向北呈近线性增加趋势。
图6
 新窗口打开|下载原图ZIP|生成PPT
图6企业社区用地集约利用潜力空间趋势分析
Fig. 6Spatial three-dimensional trend analysis of ECs' potential of intensive land use
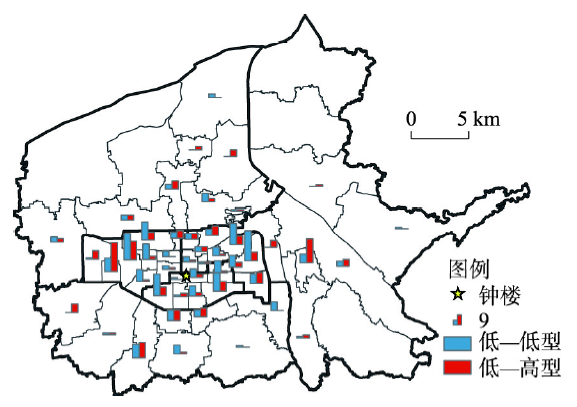
3.3.3 面积更新潜力与集约利用潜力关联分析 依据IPA方法,以面积更新潜力平均值(1.63 hm2)与集约利用潜力平均值(2.76)为临界点,划分企业社区象限如图7所示。第一象限HH型企业社区77个,占社区总量的13.46%,主要分布在中心城区外围的纺织城、电子城、枣园、韩森寨、桃园路、三桥等街道(图8);第二象限LH型企业社区172个,面积更新潜力小,集约利用潜力大,以土门、纺织城、桃园路、电子城、韩森寨、小寨路、太乙路、太华路等街道为主(图9);第三象限LL型企业社区228个,平面和立体的更新利用潜力小,长乐中路、桃园路、张家村、太乙路、胡家庙、红庙坡、环城西路等街道居多(图9);第四象限HL型企业社区95个,面积更新潜力大,集约利用潜力小,分布在长乐中路、桃园路、韩森寨、电子城、张家村、纺织城、红庙坡等街道(图8)。正常情况下,需要优先关注纺织城、电子城、枣园等街道高—高型企业社区和土门、桃园路、韩森寨等低—高型企业社区的更新改造与未来发展。
图7
 新窗口打开|下载原图ZIP|生成PPT
图7企业社区面积与集约利用潜力关联性分析
Fig. 7Correlation analysis of potentials between ECs' land renewal and intensive use
图8
 新窗口打开|下载原图ZIP|生成PPT
图8西安市街道尺度高—高型与高—低型企业社区的空间分布
Fig. 8Spatial distribution of enterprise communities of high-high type and high-low type on the sub-district scale in Xi'an
图9
 新窗口打开|下载原图ZIP|生成PPT
图9西安市街道尺度低—低型与低—高型企业社区的空间分布
Fig. 9Spatial distribution of enterprise communities of low-low type and low-high type on the sub-district scale in Xi'an
4 讨论
从中国城市及居住方式的发展变迁来看,企业社区更新有着必然性,对认识城市土地利用、城市居住空间演替、转型与治理意义重大。4.1 企业社区更新潜力评估深化城市研究认知
企业社区用地更新潜力评估创新城市土地利用研究认识。存量土地利用是后工业社会国内外城市发展的主流趋势,是城市地理学与城市规划学科的重要现实命题。20世纪70年代以来,西方城市开展大量再城市化运动,形成新城市主义、精明增长、绅士化等理论,指导城市更新与建设的实践活动,挖掘和集约利用既有城市空间,节约用地,保护农田和生态环境。自90年代中国城市已走过30余年开发区与郊区化大力建设的历史,当前外部拓展趋缓,城市增长边界的概念被强化[50,51],存量土地利用、内城用地更新和潜力挖掘及相关研究越发重要[27, 52-53],本文是对这一研究方向的有益补充。企业社区用地更新潜力分析框架具有参考价值。平面与立体有机结合,定量剖析城市老旧企业社区这类用地的更新潜力及其空间特征,是研究的创新之处。按照构建的分析框架,开展西安案例的应用,过程明确具体,结果与现实较吻合,一定程度体现了方法架构的逻辑性与参考价值,但需要更多案例的验证。
基础数据的精准是用地更新潜力分析准确的关键。基于网络平台获取居住小区数据并筛选、解译企业社区POI数据与AOI数据,以及社区建筑的立体空间数据。数据准确与否,影响研究结果的精确性。因此,需要充分的实地校准数据,以使结果更具科学性与可信度。本文结果与结论仍需在后续调查与实践研究中进一步检验和校准。
4.2 企业社区更新体现城市建设需求
企业社区更新有助于可持续性城市建设[54]。城市企业社区多建设于计划经济时期与改革开放初期,技术水平、服务年限等因素的限制,使社区建筑及各种配套设施面临建筑质量差、设施老旧、服务功能弱等一系列亟待解决的难题,是内城更新的重要空间。从城市尺度认识企业社区用地更新潜力,有助于系统地开展老旧小区改造与内城更新开发,振兴街区,建设可持续性城市和美丽城市。企业社区更新需要政府主导推动和更新潜力辨识。西方社会土地资源和住房私有化,城市更新需要居民、房主、地产商、开发商、政府部门、规划机构、银行、媒介等多元主体共同推动,新城市主义的更新理念引导凸显重要。中国城市土地国有和集体拥有,居民集体或个人房产,社区或小区住房与管理模式。政府及相关机构在社区更新、城市更新中扮演重要的管理和导向作用,不仅需要更新的理念,更需要准确的更新位置和细致的潜力认识。
多方参与推动老旧空间更新步伐。企业社区因城市化而多数演替为现今的内城地区,社区区位条件优良,但面积普遍偏小,一定程度弱化了单体开发再利用的规模效益和潜在价值。政府组织、多方参与、规划设计,推动老旧工业区的城市片区开发与街区振兴,带动社区更新改造建设,是这类社区和城市老旧空间未来的重要方向。
5 结论
本文尝试构建企业社区存量用地更新潜力的分析框架与实证方法,并以西安市为例验证方法建构的合理性。研究对深化单位制社区与内城居住空间演替理论、存量土地利用与新城市主义、城市更新理论有重要学术价值,主要结论包括:从社区土地面积、空间集约利用和两者关联性出发,采用企业社区POI、AOI数据与建筑基底数据,以及景观格局指数、区位熵与IPA等方法,构建了平面、立体和关联性3个维度的城市企业社区用地更新潜力分析框架,探究用地更新潜力特征。西安案例的应用验证了方法架构的逻辑性。
西安市企业社区总更新潜力为933.56 hm2,平均面积1.63 hm2,小型企业社区居多。0.07~1.18 hm2面积类型的斑块数量占比62.87%(359个),更新潜力仅19.42%(181.32 hm2)。面积范围居中(2.77~5.17 hm2)的企业社区(61个),可更新潜力相对较大(231.14 hm2),占总可更新面积的24.76%。小型社区多,与地域生产综合体的工业模式及大量地方企业布局有关。面积小的企业社区空间相对集聚,分布在内部市区,桃园路、土门、长乐中路、太乙路、张家村、胡家庙、电子城、红庙坡、三桥、太华路等街道;面积大的数量少而分散,主要在外围市区,洪庆、纺织城、鱼化寨、等驾坡、徐家湾、辛家庙、张家堡、太乙路、韩森寨、枣园等街道。这符合小企业为共享基础设施、公共服务设施和住房就近城区布置,大企业及辅助部门组合布局、可以相对独立的规则。
PILUEC大于1的企业社区532个(93.01%),绝大多数企业社区在立体空间上有更新潜力。西安市企业社区用地集约利用潜力整体上呈东西两头稍高、内城中间低的“U”型分异,研究区范围内南部向中北部地区企业社区集约利用潜力呈近线性增加趋势。集约利用潜力大的企业社区(A型)占比20.63%,平均楼层高度3.31层,以土门、桃园路、纺织城、韩森寨、枣园、电子城等街道为主。集约利用潜力较大的企业社区(B型)320个(55.94%),平均楼层高度5.24层,小集聚、大分散,以长乐中路、纺织城、电子城、桃园路、张家村、红庙坡、胡家庙、太乙路等街道分布居多。
面积更新潜力与集约利用潜力均大的高—高型企业社区占13.46%(77个),主要分布在中心城区外围,纺织城、电子城、枣园、韩森寨、桃园路、三桥等街道;面积更新潜力小集约利用潜力大的低—高型企业社区占30.07%(172个),以土门、纺织城、桃园路、电子城、韩森寨、小寨路、太乙路、太华路等街道为主。需要重点关注高—高型和低—高型企业社区更新改造与未来发展建设。
参考文献 原文顺序
文献年度倒序
文中引用次数倒序
被引期刊影响因子
[本文引用: 1]
[本文引用: 1]
DOI:10.1016/j.ecolind.2017.07.001URL [本文引用: 1]
DOI:10.11821/dlxb201812004 [本文引用: 1]

Aiming at building a safe city, this study proposed a “Size-Density-Morphology” based three-dimensional urban resilience evaluation framework according to the theories and methods of geography and landscape ecology. By using the framework, the urban resilience of each county in Dalian city during 2000-2016 was evaluated. There are three kinds of urban resilience, namely size resilience, density resilience and morphology resilience. The size resilience could be measured by ecological infrastructure tools; the density resilience could be measured by ecological footprint and ecological carrying capacity; the morphology resilience could be measured by "Source-sink" landscape average distance index. In addition, this paper also analyzed the combining forms of the three types of resilience. This study demonstrates that the three-dimension evaluation framework has a unique capacity to identify the resilience characteristics of city, and it is a key bond which creates the connection of urban planning and urban resilience research. Findings are as follows: (1) The size safety is the primary constraint condition for urban spatial expansion. (2) Ecological carrying capacity is the safe threshold for urban density. (3) The spatial coupling of source and sink landscape is a basic feature of good urban morphology. (4) It is the combination of size-density-morphology resilience to determine the safety of the city rather than each single one. According to the analysis of combination characteristics of the "Size-Density-Morphology" resilience, four suggestions were put forward for the development of Dalian city in future. (1) Strictly limit the development intensity of central urban area and Jinzhou district to curb the urban sprawl trend; (2) Strictly control the development of the coastal zone and maintain the integrity of natural mountain and green vegetation patches; (3) Promote the balanced development on a whole city scale to improve the city's overall resilience; (4) Optimizing the development strategy of new urban area in order to form a good urban morphology.
[本文引用: 1]
DOI:10.1080/02673037.2018.1509948URL [本文引用: 1]
[本文引用: 1]
[本文引用: 1]
[本文引用: 1]
[本文引用: 1]
[本文引用: 1]
[本文引用: 1]
[本文引用: 1]
[本文引用: 1]
DOI:10.1080/00420988020080121URL [本文引用: 1]
[本文引用: 1]
[本文引用: 1]
[本文引用: 1]
[本文引用: 3]
[本文引用: 3]
[本文引用: 3]
[本文引用: 3]
[本文引用: 1]
[本文引用: 1]
DOI:10.11821/dlxb201909011 [本文引用: 3]
The existing studies on potential evaluation of urban land intensive use mainly adopt the multi-index comprehensive evaluation approach, which has defects such as insufficient basis, incomparability of results and difficulty in reflecting dynamic changes. In view of this, this study introduced the theory and method of technical efficiency measurement into the potential evaluation of urban land intensive use. The potential of urban land intensive use can be defined as the land savings or output growths potential brought by the possible improvement of technical efficiency. Based on measuring the technological efficiency of urban land use with the SFA method, this paper constructed the quantitative evaluation models of land saving and output growth potential of urban land intensive use, and then measured and analyzed the scale and proportion of land saving and output growth potential in the Beijing-Tianjin-Hebei region during 2006-2015. The results show that the potential scale of urban land intensive use in the study area is very large and continuously increasing. The annual average of land saving potential scale is 709.80 km 2, and the net increment in the 10 years is 543.96 km 2, while the output growth potential scale is 420.76 billion yuan (the constant price in 2005), and the net increment in the 10 years is 342.86 billion yuan. The results also indicate that the potential proportion of urban land intensive use in the Beijing-Tianjin-Hebei region is quite high and continuously rising. The annual average of land saving potential proportion is 21.80%, or an increase of 10.56 percentage points in the 10 years, while the annual average of output growth potential proportion is 26.12%, or an increase of 14.73 percentage points in the 10 years. The potential ranking between the 13 cities is stable and the gap is widening, showing the general rule that it is more difficult for developed cities and easier for underdeveloped cities to explore potentialities, as well as the Matthew effect that it is easier for the easy and more difficult for the difficult. The research can provide scientific guidance for the practice and management of urban land intensive use and facilitate the dialogue and exchange between intensification evaluation and efficiency measurement.
[本文引用: 3]
[本文引用: 1]
[本文引用: 1]
[本文引用: 1]
[本文引用: 1]
[本文引用: 1]
[本文引用: 1]
DOI:10.1016/j.habitatint.2014.01.011URL [本文引用: 1]
DOI:10.1061/(ASCE)UP.1943-5444.0000707URL [本文引用: 1]
DOI:10.1177/0042098018790724URL [本文引用: 1]
DOI:10.14246/irspsd.6A.1_1URL [本文引用: 1]
[本文引用: 1]
[本文引用: 1]
[本文引用: 1]
[本文引用: 1]
[本文引用: 1]
[本文引用: 1]
[本文引用: 1]
[本文引用: 1]
[本文引用: 1]
[本文引用: 1]
[本文引用: 2]
[本文引用: 2]
[本文引用: 1]
[本文引用: 1]
[本文引用: 1]
[本文引用: 1]
[本文引用: 1]
[本文引用: 1]
[本文引用: 2]
[本文引用: 2]
DOI:10.11821/dlxb201808001 [本文引用: 1]
Since 2010, big data has played a significant role in various fields of science, engineering and society. The paper introduces the concepts of geographic big-data, the fourth paradigm and nonlinear complex geographic system, and discusses interactive relationships of these concepts. It is proposed that geographic big-data and the fourth paradigm would become a new opportunity to research on geography complexity. Then the paper discusses how to use the methods of geographic big-data and complexity science to examine geography complexity. For example, based on big-data, a series of indicators of statistical physics fields could be constructed to describe the complex nonlinear characteristics of the real geographic world. Deep learning, complex network and multi-agent methods can be used to model and simulate the complex nonlinear geographic systems. These methods are important for a better understanding of the complexity of geographic phenomena and processes, as well as the analysis, simulation, inversion and prediction of complex geographic systems. Finally, the paper highlights that the combination of geographic big-data and complexity science would be the mainstream scientific method of geography in the 21st century.
[本文引用: 1]
[本文引用: 1]
[本文引用: 1]
[本文引用: 1]
[本文引用: 1]
[本文引用: 1]
[本文引用: 1]
DOI:10.11821/dlyj020180962 [本文引用: 2]
Urban renewal is the objective need of the new normal of China's urbanization development in the new era. The study on the distribution pattern of traditional enterprise community is helpful for better comprehensive understanding and scientific optimization of urban internal space. In this paper, main city zone of Xi'an, which consists of 6 districts and 54 subdistricts, is chosen as the study area. Further, based on point of interest (POI) and field survey data, distribution pattern and formation mechanism of urban enterprise communities are probed by spatial autocorrelation analysis and nuclear density analysis methods. The results show that firstly, enterprise communities are abundant in Lianhu, Xincheng, Beilin and Yanta districts, and the number is the largest in Lianhu district, where it is as many as 238. At the same time, enterprise communities mainly concentrate in subdistricts of Taoyuanlu, Tumen, Dianzicheng, Zhangjiacun, Hujiamiao, Hongmiaopo, Changlezhonglu, Hansenzhai, Fangzhicheng, Zaoyuan, and so on, and the number of communities in Taoyuanlu subdistrict reaches 70. The subdistricts with dense enterprise communities are mainly located in the near central area around the Bell Tower. Secondly, enterprise communities are mostly distributed between Ming city wall and the third ring road, which is about two to eight kilometers away from the Bell Tower and accounts for 78.59% of the total. At the same time, the community spreads east-west direction along the Longhai Railway. It concentrates in the width of 8 kilometers away from south side of the railroad, and presents the band and cluster distribution of spatial 'large dispersion and small aggregation'. It is distributed in the width of 2 kilometers away from north side of the railroad, and takes on the characteristics of exponential decrease outward. Thirdly, the Moran's I index for the community is 0.27, which indicates that the positive spatial autocorrelation is very significant. That is to say, the subdistricts with more communities tend to cluster in space, and the subdistricts with less community are adjacent. Fourthly, hotspot subdistricts of enterprise communities consist of Tumen, Zaoyuan and Taoyuanlu of Lianhu district, Changlezhonglu and Hansenzhai of Xincheng district, Fangzhicheng of Baqiao district, and Xiaozhai of Yanta district; cold spots chiefly concentrate in the north of main urban area and the central urban area, and Weiyang Lake subdistrict in Weiyang district, Beiyuanmen subdistrict in Lianhu district, and Jiefangmen, Xiyi Road, Zhongshanmen subdistricts in Xincheng district are particularly prominent. In addition, the analysis of kernel density shows that the spatial structure of enterprise community is also characterized by large scale dispersion and small scale agglomeration, and the subdistricts with high distribution density are basically consistent with the results of hotspot analysis. Finally, it should be said that the distribution pattern of traditional enterprise community is the result of historical and social development, and has the characteristics of times and places. It is jointly affected by many factors such as policy making, traffic routes, urban pattern, planning and design, enterprise location, natural conditions, urbanization, and marketization.
[本文引用: 2]
[本文引用: 1]
[本文引用: 1]
[本文引用: 1]
[本文引用: 1]
DOI:10.11821/dlxb201912011 [本文引用: 1]
Exploring the impact mechanisms of construction land expansion on landscape pattern changes is one of the critical tactics to understanding how human activities affect ecosystem function, pattern, and process change. However, the lack of macro-scale data and spatial analysis methods on construction land expansion and landscape has hindered China's national scale study. In response to this, here we use the recently available built-up area ratio data and the corresponding land use data to characterize the spatiotemporal process of construction land expansion and landscape metrics between 1975 and 2014 based on the 10 km grids at the national scale. And the spatial econometric model was adopted to quantitatively investigate the influence mechanism of construction land expansion process on landscape pattern evolution. At the same time, the spatial-temporal heterogeneity of the influence of construction land expansion process on the evolution of landscape pattern is examined based on the comparisons, different scale cities and different regions of China. The study found that the value of built-up area ratio has increased by threefold in the past 40 years, which is higher than the growth level of demographic urbanization in the same period. The construction land expansion has significant gradient differences between the eastern, the central and the western regions, and the gradation of difference is gradually increasing. Average annual growth rates are 5.87%, 2.32% and 2.32%, respectively, in periods 1975-1990, 1990-2000 and 2000-2014. Meanwhile, the differences between large, medium-sized and small cities are also significant. Owing to the effects of frequent human activities, the landscape pattern has also experienced significant changes. For example, the dominance of leading type has gradually decreased, the landscape pattern has become fragmented, the complexity has increased, the proximity has become more discrete, the contagion has gradually decreased, the cohesion has increased, and landscape diversity and evenness have increased. With the improvement of construction land expansion level, the landscape is becoming more and more fragmented, and the intensity and frequency of human interference to the landscape are also increasing. Every 1% increase in the expansion of construction land, for example, caused a 0.45% increase in the number of patches. However, the changes in construction land expansion level and landscape complexity are spatially mismatched. To the extent that the improvement of the level of construction land expansion has brought the distance between the same types of patches and the contagion index has decreased, and the landscape became more and more dense and aggregating, and the corresponding cohesion degree is also getting higher and higher, and the landscape equalization and even distribution are more and more obvious. At the same time, it is found that the influences of different time periods, different scale cities and different regions are significant for impact mechanisms of construction land expansion on landscape pattern changes. Besides geographical location, the other control factors have different influences on the evolution of landscape pattern.
[本文引用: 1]
DOI:10.1007/BF02573948URL [本文引用: 1]
[本文引用: 1]
[本文引用: 1]
DOI:10.31497/zrzyxb.20190704URL [本文引用: 1]
[本文引用: 1]
[本文引用: 1]
[本文引用: 1]
[本文引用: 1]
[本文引用: 1]
[本文引用: 1]
[本文引用: 1]
[本文引用: 1]
[本文引用: 1]
[本文引用: 1]
[本文引用: 1]
DOI:10.2307/143493URL [本文引用: 1]
[本文引用: 1]
[本文引用: 1]
[本文引用: 1]
DOI:10.11821/dlxb201606003 [本文引用: 1]
The boundary of urban built-up areas provides foundational information for urban studies and meets the requirements for urban pattern and urban spatial structure research. However, commonly used methods for identifying the boundary of urban built-up areas such as using remote sensing data of night-light and land use, cadastral data, and building coverage data, are limited in accuracy. To remedy this, this paper proposes to use POI (Point of Interest) data obtained from web maps, assuming that it well reflects the agglomeration of urban activities at higher precision. Based on the underlying connection between POI and the spatial distribution of urban activities, a new method called 'Densi-Graph' is proposed to identify the actual boundary of urban built-up areas with the contour map of the kernel density of POI, where the threshold value for the contour lines to make significant change from densely to loosely placed is picked, giving the boundary of urban and rural areas. Different contour structures for mono-centric, poly-centric and linear cities are discussed, whereby the Densi-Graph method using POI data is validated. The method is also used to study the boundaries of urban built-up areas in China's prefecture level cities. The relationships between the Density-Graph thresholds and the population and location of different cities are discussed. This study advances previous studies in presenting more reliable and objective data on the boundary of urban built-up areas.
[本文引用: 1]
DOI:10.1068/a34192URL [本文引用: 1]
[本文引用: 1]
[本文引用: 1]
DOI:10.1016/j.landurbplan.2016.05.031URL [本文引用: 1]
