 ,1, 汪倩旻1, 李艺,1,2, 李杨帆1,2
Evaluation of landscape connectivity in China's coastal terrestrial nature reserves based on an improved minimum cumulative resistance model
JIN Qihao,1, WANG Qianmin1, LI Yi,1,2, LI Yangfan1,2通讯作者:
收稿日期:2020-06-29修回日期:2021-06-21
| 基金资助: |
Received:2020-06-29Revised:2021-06-21
| Fund supported: |
作者简介 About authors
金奇豪(1996-), 男, 浙江温州人, 硕士生, 研究方向为海岸带地区景观连接度模拟。E-mail:

摘要
关键词:
Abstract
Keywords:
PDF (1914KB)元数据多维度评价相关文章导出EndNote|Ris|Bibtex收藏本文
本文引用格式
金奇豪, 汪倩旻, 李艺, 李杨帆. 中国沿海陆地自然保护区景观连接度评价. 地理学报, 2021, 76(11): 2830-2840 doi:10.11821/dlxb202111016
JIN Qihao, WANG Qianmin, LI Yi, LI Yangfan.
1 引言
地球已进入了全新的以人类为主导的地质时代—人新世(Anthropocene)[1],人类活动对生态系统的影响逐渐增加,与人类活动相关的生态环境效应研究已经成为热点话题[2]。快速城市化伴随而来的人口与建设用地需求的高速增长,森林、草地、水域等自然用地转为建设用地的现象在中国沿海地区尤为显著[3,4,5]。随之产生的自然景观破碎化造成了动植物生境的改变和丧失,进而对区域生物多样性造成威胁[6,7,8,9]。2010年《生物多样性公约》缔约方大会提出“到2020年实现全球海岸带自然保护区覆盖面积达到总面积的10%和构建良好连接网络”的目标决议,即爱知生物多样性保护目标11(Aichi Biodiversity Target 11)[10]。联合国可持续发展目标15(Sustainable Development Goals, SDG 15)“陆地生物”目标中也提出“保护、恢复和促进可持续利用陆地生态系统,遏制生物多样性的丧失”[11]。但近年来,全球范围内自然保护区管理等级下降、面积范围缩小甚至消失的现象(Protected Area Downgrading, Downsizing, and Degazettement, PADDD)日益加剧,这一问题引起了科研工作者和决策制定者的高度关注[12,13,14]。中国自然保护区包括典型的自然生态系统、珍稀濒危物种的聚集地以及具有特殊意义的自然遗迹等,在保护野生动植物和维护国土生态安全方面始终发挥着重要作用[15]。人类活动导致的景观破碎化直接或间接地影响自然保护区之间的相互联系。景观要素在空间格局、生态过程和生态功能上的有机联系被称为景观连接度(Landscape Connectivity),通过构建生态廊道(Ecological Corridor)表征景观基质促进或阻碍物种运动的能力,可用于定量描述不同自然保护区或栖息地之间的相互联系[16,17]。景观连接度较高的区域通常拥有较优的生态廊道来促进物种迁徙,提升自然保护区之间的生态廊道能为区域内珍稀物种的繁殖、觅食和迁徙提供便利途径,有利于促进区域间物种迁徙,在维持区域生物多样性上发挥着至关重要的作用[18]。
对于自然保护区斑块而言,其边缘地带是自然生态系统和人类社会系统的过渡地带,该区域有着不同于甚至高于保护区内部的物种丰富度,且人类活动的影响程度相比斑块内部更大,即景观生态学理论中的“边缘效应”[19]。随着人类活动对自然保护区边缘地带的干扰愈发强烈,对自然保护区之间的景观连接度造成的影响也更为显著。目前在自然保护区管理与规划和生物多样性保护等领域,关于人类活动对景观连接度的影响研究较多,如采用土地利用与覆盖、生境斑块、社会经济等指标构建生态廊道和生态网络,对生境和廊道进行重要性评价和格局优化。研究表明人类活动的干扰加剧了生境破碎化[20,21,22,23],进而降低了生境之间的景观连接度。目前的研究方法多集中于“最小累积阻力模型(Minimum Cumulative Resistance, MCR)”,该方法通过识别不同景观地类的流动性来构建生态阻力面,但主要基于景观基质对物种迁徙的负向阻碍作用,而针对生物多样性对物种迁徙的正向支持作用的研究较少[20,21,22,23],鲜少有研究评估“景观基质促进或阻碍物种运动的能力”。
国家级自然保护区在生物多样性保护工作中发挥着重要作用,但保护区周边的人地矛盾较为突出,分布着大量的农业用地和居民点,尤其是我国东部沿海经济较为发达的地区,受到了较为强烈的人类活动干扰[24]。因此,本文聚焦于中国沿海国家级自然保护区,通过量化人类活动影响范围和幅度两个指标,评估人类活动在自然保护区边缘地带与其中心区域的空间差异性;并在此基础上模拟由人类活动导致的保护区边界改变,探究自然保护区边缘地带人类活动对生态廊道的影响;最后,在MCR基础上叠加生物多样性数据,提出生态廊道的连通适宜性及生态支持力二维评价,识别保护区边缘地带人类活动对生态廊道的适宜性和支持力的影响特征。相比于现有评价方法,新方法量化评估了景观基质对物种迁徙的促进作用,在传统“阻碍维”基础上丰富了景观连接度评价的“促进维”。
2 研究方法与数据来源
2.1 研究区概况
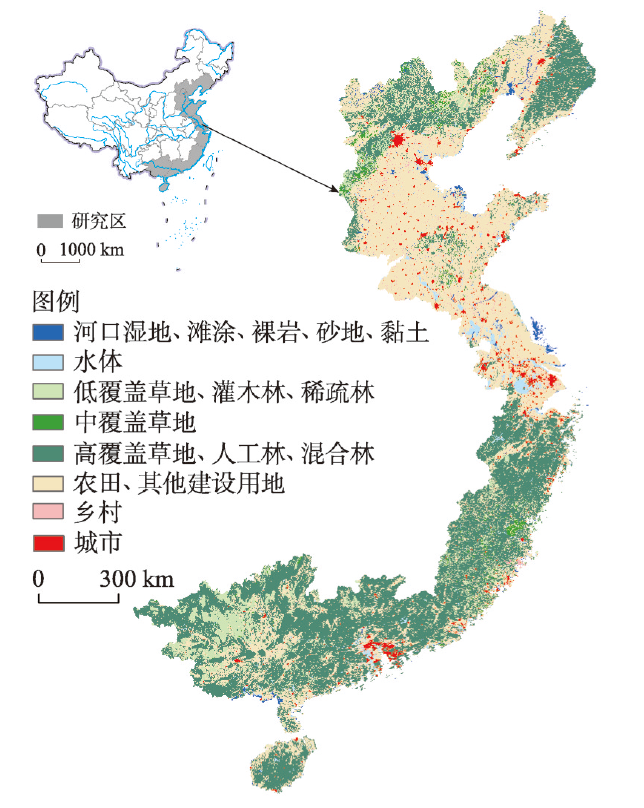
中国海岸带北起辽宁省鸭绿江口,南至广西壮族自治区北仑河口,拥有总长度超过18000 km的海岸线和约6500座岛屿,大陆和岛屿岸线总长度达到32000 km,涵盖土地范围辽阔,总面积达到248632 km2 [25, 26]。海岸带土地利用方式涉及三大产业的12个产业部门,利用类型包括农业用地、工商业用地、资源开发等18种[27]。本文以中国沿海省市作为研究区域(图1),因数据可获得性,研究区不包括港澳台地区。2017年研究区内共有国家级陆地自然保护区92个,总面积约15680 km2,涵盖的保护类型有森林生态系统、野生动物、海洋海岸、古生物遗迹、野生植物、地质遗迹和内陆湿地7种类型。图1
 新窗口打开|下载原图ZIP|生成PPT
图12017年研究区域土地利用与覆盖图
注:基于自然资源部标准地图服务网站审图号为GS(2006)1592号的标准地图制作,底图边界无修改。
Fig. 1Spatial distribution of land use and land cover in the study area in 2017
中国海岸带地区人口聚集度高,地级以上城市共有55个,人口超过百万的特大型城市有15座。同时海岸带地区是中国经济最发达的地区,其国内生产总值达到全国的40.1%(不包含香港、澳门、台湾地区),人均地区生产总值是全国人均水平的1.6倍,全国60%以上的GDP集中在该地区。海岸带地区作为陆地、大气、海洋三者交汇区域,因其自然环境复杂,人类活动频繁,地质作用活跃,是最为脆弱的区域之一。由于海岸带地区的经济社会快速发展,滨海湿地的围垦和沿海林地的过度利用直接或间接地加剧了自然景观的破碎化,导致自然保护区之间景观连接度显著降低。
2.2 数据与方法
在人新世背景下,人类活动主导的干扰对自然生态环境的胁迫成为生态学研究中的重点。综合考虑数据的可获取性及相关研究的延续性、可比性[28],本文量化评估了1995—2015年研究区内自然保护区边缘地带的人类影响程度及保护区景观连接度的响应变化特征,基于生物多样性数据的空间叠加解析,开展了生态廊道的连通适宜性及生态支持力二维评价。所有数据均按照研究区域进行裁剪处理,使用WGS_1984_Albers坐标系统。2.2.1 人类活动影响空间量化 参考景观连接度模拟研究中对土地利用与覆盖、人口密度和道路机场三类人类干扰活动的迁徙阻力赋值[28,29,30,31,32],通过阻力值的空间叠加获得人类影响指数(Human Impact Index, HI),见公式(1)[28]。该指数为无量纲指标,表征物种通过某地所需耗费的总能量。土地利用与覆盖和人口密度数据为2015年的1 km×1 km数据,来源于中国科学院资源环境科学数据中心(
式中:HIi表示景观单元i的总HI,取值范围为0~10;
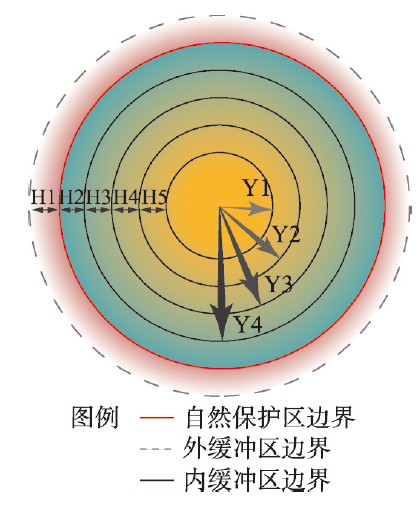
2.2.2 保护区边缘地带的人类影响评估 《中华人民共和国自然保护区条例(修订版)》中规定保护区核心区禁止任何人进入,而缓冲区则禁止旅游和生产经营活动,但是在外围实验区可按照主管部门批准的方案组织一定的参观和旅游活动[33]。为探究自然保护区不同径深范围内的人类影响空间差异,参考数据图层精度(1 km×1 km),以1 km为梯度将保护区划分为4个内部区域(图2,Y1~Y4)和5个边缘区(图2,H1~H5)。
图2
 新窗口打开|下载原图ZIP|生成PPT
图2自然保护区内部及外部的不同径深分区示意图
Fig. 2Illustration of outside and inside buffer zones of the nature reserve boundary
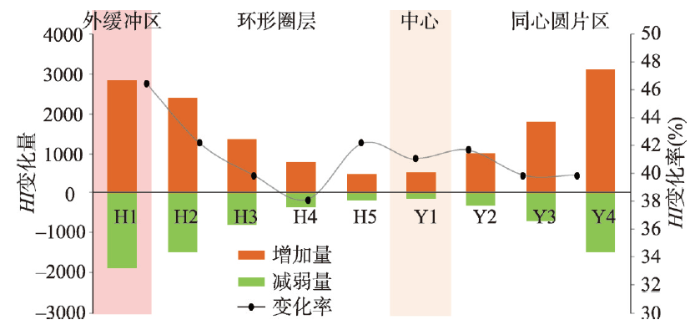
从人类影响范围和影响幅度两个方面分别对1995—2015年间自然保护区9个分区内的人类活动影响进行评价。影响范围为各分区内的HI指数增加和减少的面积总和与该片区总面积的比率,见公式(2);影响幅度为各分区内HI的增加量和减少量,见公式(3)。
式中:Fi表示片区i内人类影响范围(%);Aic表示片区i内1995年至2015年的HI发生变化的区域面积(km2);Ai表示片区i的总面积(km2)。
式中:Ii表示片区i内人类影响幅度,为无量纲指标;n表示片区i内的像元总数;ΔHIij表示片区i像元j内1995年至2015年HI指数的增加量或减少量。
2.2.3 人类活动影响下的保护区景观连接度模拟 本文在ArcGIS10.4平台使用Climate Linkage Mapper工具对保护区之间的廊道进行模拟[34]。该工具输入图层包括核心生境矢量图层(国家级自然保护区)和迁徙阻力栅格图层(HI指数),根据气候梯度(温度梯度)模拟核心生境之间物种迁徙的最低阻力,即最小累积阻力。本文保护区数据由《国家级自然保护区遥感监测图集》(测绘出版社)数字化得到,气温数据由中科院资源环境科学数据中心获得(
本文通过缩减保护区边界来模拟人类对保护区的影响,由于人类活动在保护区边缘地带的影响存在各向异性,即人类对保护区不同方位的影响程度有较大区别。因此,本文在缩减保护区边界时,针对不同方位计算人类活动对保护区景观连接度的影响。同时考虑到存在面积较小的保护区以及人类影响指数图层的空间分辨率为1 km×1 km,在保证方位精度最大化又不产生数据处理冗余的前提下,以自然保护区斑块的几何中心为圆心,以11.25°为单位方位角将保护区划分32个区域(32×11.25°=360°),得到保护区不同方位的人类影响程度。通过计算1995—2015年间各区域内HI变化均值,识别出保护区受人类干扰强烈的区域,并将该区域像元属性设置为非保护区。为保证较小面积的保护区在改变边界后不会完全消失,设定当HI均值每增加一单位,边界缩减300 m。将改变边界后的保护区图层再次代入Climate Linkage Mapper工具模拟各相邻保护区之间的廊道。
2.2.4 连通适宜性及生态支持力评价 本文借鉴国家自然资源部环境资源承载能力和国土空间开发适宜性评价[35],根据景观连接度“景观基质促进或阻碍物种迁徙的能力”的理论内涵[17],在最小累积阻力模型的基础上将生物多样性纳入景观连接度评价体系,构建了生态廊道的连通适宜性及生态支持力二维评价新方法。连通适宜性表征人类主导的社会经济活动对物种迁徙的阻碍作用,体现为在人类活动影响下物种通过该区域的适宜程度。该评价指标由Kavanagh和Nuñez等开发的Climate Linkage Mapper工具创建的连接相邻自然保护区的最小累积阻力组成,其值越低,表示人类活动干扰程度越小,廊道的适宜性越高,具体计算过程参考Kavanagh等[34]和Nuñez等[36]的研究。生态支持力包含生物多样性和廊道长度两个方面。该指标表征廊道支持物种迁徙的能力,由廊道起点栅格至终点栅格的物种丰富度累加值计算所得,见公式(4)。物种丰富度越高,适宜的生态位空间被充分占据的比例越高,生态系统功能所发挥的作用也越稳定,对物种迁徙的支持作用越大[37,38]。同时该指标探讨了不同长度的廊道在应对边缘地带人类活动干扰时的稳定性。因各廊道物种丰富度分布情况不同,公式(4)中用
式中:Ci表示廊道i内的生态支持力;n表示廊道i的长度(km);
3 结果分析
3.1 基于人类活动干扰的自然保护区边缘效应
分别对比研究区域内1995—2015年人类活动对自然保护区的影响范围和幅度,发现其影响范围和幅度由保护区边缘地带至中心区域依次降低(图3)。边缘地带的人类影响范围较大,保护区边缘地带(H1)的影响范围高达46.46%,说明该区域平均每100 km2约有46.46 km2面积受到人类活动影响,边缘地带存在大范围的人类活动,其他区域的人类活动显著低于该区域。边缘地带的人类影响幅度较高,H1和H2区域的人类影响总增加量分别为2848和2381,总减少量分别为1878和1508,明显大于保护区中心Y1的501和-122。本文使用不同的方法将自然保护区划分为Y1~Y4区域,展开边缘地带的人类影响评价,由于人类活动具有一定的空间聚集性特征,保护区中心地带的人类影响范围有所增加,但其影响幅度较低(图3)。以上结果均表明自然保护区的人类活动干扰存在明显的边缘效应,即保护区边缘地带的人类影响显著高于中心地带。图3
 新窗口打开|下载原图ZIP|生成PPT
图3自然保护区不同分区的人类影响范围及幅度差异
Fig. 3Scale and range variance of human disturbance in different regionsof nature reserves
尽管中国自然保护区标准对保护区内部的人类活动进行约束管理,但在其边缘地带仍然存在一定程度的人类活动[33],许多国家级自然保护区内存在大量的旅游开发项目[39]。中国横断山脉的自然保护区的研究显示,由保护区内部至边缘地带的人类活动威胁明显上升[37]。2016年《国务院关于自然保护区建设和管理工作情况的报告》中指出部分地区为追求经济利益在自然保护区内盲目开发建设,导致生态系统“碎片化”,影响自然保护区生态功能和价值,同时一些自然保护区中存在村镇、农田和工矿企业,制约了自然保护区健康发展[40]。
3.2 生态廊道的连通适宜性评价
通过模拟人类活动对相邻保护区间景观连接度的影响,发现研究区内自然保护区由于边界改变导致保护区总面积减少720.25 km2,在研究区域内的135个保护区中有34个面积显著减少(即降低值大于3/4分位数的区域),减少面积为559.95 km2。保护区边缘地带的人类活动强度升高,改变了保护区外沿的生态环境条件,使原来最适宜作为廊道起点或终点的区域受到了较高的人类活动影响,迫使物种绕过人类影响区域选择新的迁徙起点或终点(图4a)。保护区边缘地带的局部人类活动对景观连接度的影响还体现为保护区之间的连通适宜性降低(图4b),其最小累积阻力由2.58×10⁵ km上升至2.62×10⁵ km,保护区之间迁徙所消耗的能量明显提高。在区域尺度上,研究区内沿海经济城市圈中环渤海地区阻力上升较大,辽宁南部和河北北部尤为明显,长三角、珠三角及闽三角地区(厦门、泉州、漳州)的阻力上升幅度较小。图4
 新窗口打开|下载原图ZIP|生成PPT
图4人类影响下自然保护区边缘地带景观连接度响应特征
Fig. 4Response characteristics of landscape connectivity in the edge of nature reserves exposed to human disturbance
3.3 生态廊道的生态支持力评价
生态廊道的二维评价与传统方法的区别主要体现在对廊道的生态支持力的测度上,通过引入二维评价,优化了基于阻力维度的景观连接度模拟方法,该方法不仅反映景观基质对物种迁徙的阻碍作用,更能体现生物多样性在物种迁徙过程中的支持促进作用。结果表明,保护区边界变化后,研究区域内生态廊道连通适宜性下降但生态支持力上升,人类干扰程度提高的区域其生物多样性也更加丰富。在连接135个自然保护区的338条廊道中,连通适宜性下降的廊道合计95条,生态支持力上升的廊道合计78条,生态廊道支持力下降的廊道合计14条(图5),其余廊道未发生变化仍维持原有水平。研究区域内廊道支持力下降的数量远少于支持力上升的数量,且下降幅度远低于上升幅度,分别为-5.80%和27.42%,廊道支持力总体呈上升趋势。保护区边界改变导致的廊道路径改变,使物种迁徙更易经过高物种丰富度的区域,这些区域对物种迁徙有着较好的支持作用,降低了自然保护区之间的迁徙难度,提高了保护区之间的景观连通性。图5
 新窗口打开|下载原图ZIP|生成PPT
图5廊道的连通适宜性及生态支持力变化
Fig. 5Dynamics of corridor connectivity suitability and ecological capacity
自然保护区边缘地带的人类活动一方面影响着廊道的始末位置,另一方面影响着斑块之间的联系程度与廊道内物种迁移的难度,新生态廊道上的适宜性和支持力变化较为明显,保护区周边复杂且频繁的物质能量交换导致了该地区较高的生物多样性[19, 41],在生物多样性较高的地区,廊道路径的改变对支持力的影响程度较低。在人新世背景下,人类活动强度与日俱增,为保护生物多样性和国土安全,应提高斑块之间的景观连接度,进一步加强自然保护网络的连接,管理者需要明确自然保护区边缘地带的自然生态环境,识别廊道的重要连接点,并结合周边人为活动强度展开重点监督和管理。
4 讨论
4.1 保护区边缘地带人类活动对不同长度廊道的影响
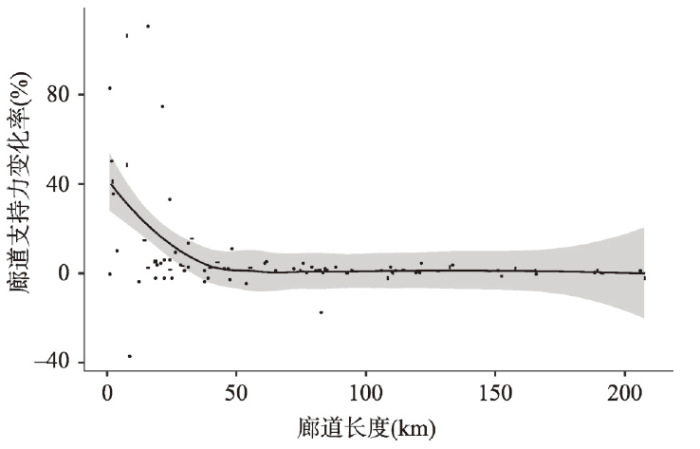
为了探索不同长度的廊道在应对保护区边缘地带人类活动干扰时的稳定性,本文采用包含廊道长度因素的生态支持力评价指标,对比分析保护区边缘地带人类活动对不同长度生态廊道的影响。本文发现廊道局部性人类干扰(边界改变)对廊道的影响存在尺度效应,即保护区边缘地带的人类活动干扰对不同长度的廊道的影响存在差异(图6)。长廊道具有更高的稳定性,即受人类活动影响较小;而短廊道的敏感性较高,易受到周围人类活动干扰。保护区边缘地带的人类活动改变了廊道的起点和终点位置,这种位置的变化对长距离廊道的影响较小,但对短距离廊道的影响较大,导致廊道起点和终点位置的大范围偏移。小尺度范围内,短廊道连接了两个(或两个以上)距离相近的自然保护区,保护区之间的人类活动驱使迁徙物种向生物多样性更高的区域转移。有研究指出,中国自然保护区边缘地带普遍存在大量的人类活动,如开垦、居住、农耕、采矿等活动[24],而这些地带作为生态廊道的起点和终点,对保护区之间的物种迁徙至关重要。也有研究表明生物多样性较高的地区通常与人类活动聚集地在空间上高度重叠,即生物多样性热点区(Biodiversity Hotspot)[42]。这些地区的人类活动导致了景观破碎化,严重影响着生态廊道内的生物多样性[43]。因此,亟需识别由于人类活动导致的物种迁徙廊道的变化(尤其是短距离迁徙物种),并及时评估人类活动对物种迁徙廊道的胁迫程度。图6
 新窗口打开|下载原图ZIP|生成PPT
图6廊道生态支持力对人类活动干扰的敏感性
Fig. 6Sensitivity analysis of corridors in different ecological capacity exposed to human disturbance
4.2 改进型MCR的优势与不足
传统景观连接度研究侧重于通过阻力描述景观基质对物种迁徙的累积负向阻碍作用,本文中生态支持力评价在最小累积阻力模型基础上叠加廊道的生物多样性空间分布数据,量化评估了景观基质对物种迁徙的促进作用,在传统“阻碍维”基础上丰富了景观连接度评价的“促进维”。该量化方法中涉及的参数无特定限制,在取得精度适宜的生物多样性数据的基础上,便可广泛应用在不同尺度及不同研究区域,生物多样性指标的选取也可根据实际问题和数据可获得性确定,针对不同精度的数据均可实现连通适宜性及生态支持力评价,具有较强的普适性,因此本方法在其他区域的可重复性及应用性较高。本文新方法通过廊道的生物多样性空间分布数据量化评估了景观基质对物种迁徙的促进作用,基于景观基质的阻碍和促进作用的二维评价可为中国未来自然保护区连通性和生物多样性保护提供更为完整的时空格局动态变化模拟,尤其是针对较高敏感性的自然保护区边缘地带改变而导致的不同尺度廊道变化模拟,为优化自然保护区空间布局提供更为完善的景观连接度评估新方法。
人新世背景下的人为干扰包括人类活动及气候变化两大重要方面,本文重点讨论了快速城市化背景下的人类活动对自然保护区的景观边缘效应,针对气候变化因素的考虑仅模拟了物种由高温至低温的迁徙方向,暂未模拟其他气候变化梯度下(如降水、湿度、风速等)的生态廊道。未来可综合降水、湿度及风速等因素完善生态廊道的模型构建,以研究由于气候变化综合因素导致的自然保护区间的景观边缘效应。本文关注的区域为沿海陆地自然保护区,尚未实现对海洋保护区的景观连接度模拟,下一步研究将进一步识别海岸带地区关键气候变化因素与人类活动干扰的综合影响,实现陆海统筹的自然保护区综合管理研究。
5 结论
本文围绕人新世背景下中国沿海地区人类活动影响这一关键因素,测度人类活动干扰在自然保护区的边缘效应,解析了人类活动干扰在自然保护区边缘地带与其内部的差异性;通过模拟人类活动对自然保护区边界的改变这一模式,探究其对自然保护区景观连接度的影响形式;最终将模拟结果与该研究区域内生物多样性数据进行空间叠加解析,评估了区域内生态廊道的连通适宜性和生态支持力。生态廊道的“二维评价”考虑生物多样性对自然斑块之间有机连接的支持作用,该方法有效地弥补了传统模型所忽略的景观基质对物种迁徙促进作用的测度,为自然保护区生态多样性保护与国土空间管理提供新支撑。参考文献 原文顺序
文献年度倒序
文中引用次数倒序
被引期刊影响因子
DOI:10.1177/2053019614564785URL [本文引用: 1]
DOI:10.1073/pnas.1602817113PMID:27298349 [本文引用: 1]

The contiguous United States contains a disconnected patchwork of natural lands. This fragmentation by human activities limits species' ability to track suitable climates as they rapidly shift. However, most models that project species movement needs have not examined where fragmentation will limit those movements. Here, we quantify climate connectivity, the capacity of landscape configuration to allow species movement in the face of dynamically shifting climate. Using this metric, we assess to what extent habitat fragmentation will limit species movements in response to climate change. We then evaluate how creating corridors to promote climate connectivity could potentially mitigate these restrictions, and we assess where strategies to increase connectivity will be most beneficial. By analyzing fragmentation patterns across the contiguous United States, we demonstrate that only 41% of natural land area retains enough connectivity to allow plants and animals to maintain climatic parity as the climate warms. In the eastern United States, less than 2% of natural area is sufficiently connected. Introducing corridors to facilitate movement through human-dominated regions increases the percentage of climatically connected natural area to 65%, with the most impactful gains in low-elevation regions, particularly in the southeastern United States. These climate connectivity analyses allow ecologists and conservation practitioners to determine the most effective regions for increasing connectivity. More importantly, our findings demonstrate that increasing climate connectivity is critical for allowing species to track rapidly changing climates, reconfiguring habitats to promote access to suitable climates.
DOI:10.13287/j.1001-9332.202004.012PMID:32530202 [本文引用: 1]
Habitat quality is an important index to evaluate regional ecological security. Revealing its spatial and temporal responses to urbanization is conducive to the in-depth implementation of new urbanization. Based on land use data, we analyzed the spatio-temporal characteristics of Changchun's landscape pattern, habitat quality and its sample zone from the grid scale with comprehensive utilization of spatial analysis and ecological model analysis. We further discussed the responses of habitat quality during urbanization. The results showed that the low values of patch density (PD), edge density (ED) and Shannon diversity index (SHDI) were distributed in the western plains, while the high aggregation index (AI) showed a patchy distribution in eastern and southern of the city. During 2000-2015, the habitat quality of Changchun showed a trend of degradation and significant spatial heterogeneity, showing a distribution of "high in the east, and low in the west". The expansion of construction land and the transportation infrastructure played a leading role in the degradation of regional habitat quality. The changes of habitat quality differed significantly in different zones. The overall variation of water belt was relatively small, while the variation frequency and amplitude of mountain, urban expansion, and traffic belt were relatively high. Natural factors including slope and elevation basically shaped the overall distribution pattern of habitat quality in Changchun, while urbanization factors including population density, GDP and night light index showed significant negative correlation with habitat quality. To alleviate the ecological pressure of urbanization and promote habitat quality, we proposed differentiated development strategies, such as preventing deforestation in the Dahei Mountains, using ecological strategies to restore habitat degradation areas, improving land use efficiency in built-up urban areas, promoting "smart growth" in urban areas, setting red line of farmland in hilly areas, and strengthening ecological infrastructure construction.
PMID:32530202 [本文引用: 1]
DOI:10.1360/SSTe-2019-0266URL [本文引用: 1]
[本文引用: 1]
[本文引用: 1]
[本文引用: 1]
DOI:10.1016/j.biocon.2013.02.018URL [本文引用: 1]
DOI:10.1073/pnas.1620503114URL [本文引用: 1]
DOI:10.1126/science.aap9565URL [本文引用: 1]
DOI:10.1038/s41586-019-1048-zURL [本文引用: 1]
DOI:10.1002/aqc.v26.S1URL [本文引用: 1]
[本文引用: 1]
DOI:10.1038/nature22902URL [本文引用: 1]
DOI:10.1126/science.aau5525URL [本文引用: 1]
DOI:10.1073/pnas.1716462115URL [本文引用: 1]
[本文引用: 1]
[本文引用: 1]
[本文引用: 1]
[本文引用: 1]
[本文引用: 2]
[本文引用: 2]
DOI:10.1016/0304-3800(93)90081-3URL [本文引用: 1]
[本文引用: 2]
[本文引用: 2]
DOI:10.1111/acv.2017.20.issue-1URL [本文引用: 2]
URL [本文引用: 2]
URL [本文引用: 2]
PMID:28393879 [本文引用: 2]
Fragmentation and reduced continuity of habitat patches threaten the environment and biodiversity. Recently, ecological networks are increasingly attracting the attention of researchers as they provide fundamental frameworks for environmental protection. This study suggests a set of procedures to construct an ecological network. First, we proposed a method to construct a landscape resistance surface based on the assessment of habitat quality. Second, to analyze the effect of the resistance surface on corridor simulations, we used three methods to construct resistance surfaces: (1) the method proposed in this paper, (2) the entropy coefficient method, and (3) the expert scoring method. Then, we integrated habitat patches and resistance surfaces to identify potential corridors using graph theory. These procedures were tested in Changzhou, China. Comparing the outputs of using different resistance surfaces demonstrated that: (1) different landscape resistance surfaces contribute to how corridors are identified, but only slightly affect the assessment of the importance of habitat patches and potential corridors; (2) the resistance surface, which is constructed based on habitat quality, is more applicable to corridor simulations; and (3) the assessment of the importance of habitat patches is fundamental for ecological network optimization in the conservation of critical habitat patches and corridors.
DOI:10.11821/dlyj020200458 [本文引用: 2]
Nature reserves are the core area for biodiversity conservation. National nature reserves are the main body of nature reserves in China. According to characteristic of each type of human activity, the patches of different human activities of 446 national nature reserves in 2015 and their change from 2013 to 2015 were interpreted with the aid of GIS and RS. Status of the distribution of human activities and their change are generally analyzed in different functional zones and different regions in China. Also according to different types of human activities, the intensity and characteristics of dynamic change of human activities are evaluated from 2013 to 2015. The results showed that in 2015, there were different kinds of human activities in 446 national nature reserves. Human activities were widely distributed, and agricultural land and residential areas were dominant. The area of the two types covered more than 88.94% of the total of human activities. And the number exceeded 77.67% of the total. In China, 66.59% of national nature reserves had new or expanded human activities from 2013 to 2015, and the amount of human activities increased by 2.45%. Compared with agricultural land and residential areas, the increase trend is more pronounced of the development or construction activities. From 2013 to 2015, the number of national nature reserves where human activities had no change covered 33.41% of the total number of national nature reserves in China, those with little change covered 45.06%, and those with and significant change covered only 21.53%. From the perspective of spatial distribution, the overall human activity in the national nature reserves of eastern China is greater than that of central and western parts of the country. The intensity of human activities in coastal and riverside national nature reserves is relatively strong.
[本文引用: 2]
[本文引用: 1]
[本文引用: 1]
[本文引用: 1]
[本文引用: 1]
[本文引用: 1]
[本文引用: 1]
DOI:10.1002/ldr.v30.1URL [本文引用: 3]
DOI:10.1038/nature14324URL [本文引用: 1]
DOI:10.1126/science.aaf3565PMID:27102469 [本文引用: 1]
DOI:10.1016/j.biocon.2011.02.004URL [本文引用: 1]
DOI:10.1016/0169-2046(92)90060-DURL [本文引用: 1]
URL [本文引用: 2]
URL [本文引用: 2]
URL [本文引用: 2]
URL [本文引用: 1]
URL [本文引用: 1]
DOI:10.1111/cobi.12014URL [本文引用: 1]
DOI:10.1038/nature04742URL [本文引用: 2]
[本文引用: 1]
[本文引用: 1]
[本文引用: 1]
[本文引用: 1]
[本文引用: 1]
[本文引用: 1]
DOI:10.1046/j.1523-1739.2002.00573.xURL [本文引用: 1]
PMID:12322582 [本文引用: 1]
The mass-extinction episode underway is largely centered on tropical forests, insofar as they contain at least half of all Earth's species and they are being depleted faster than any other biome. But species distributions and depletion patterns are anything but uniform throughout the biome. This paper identifies 10 areas that a) are characterized by exceptional concentrations of species with high levels of endemism and b) are experiencing unusually rapid rates of depletion. While these "hotspot" areas comprise less than 3.5% of remaining primary forests, they harbor over 34,000 endemic plant species (27% of all plant species in tropical forests and 13% of all plant species worldwide). They also feature 700,000 endemic animal species and possibly several times more. Unfortunately, they appear likely to lose 90% of their forest cover as soon as the end of the century or shortly thereafter, causing the extinction of almost 7% of Earth's plant species and at least a similar proportion of animal species, this occurring in only 0.2% of Earth's land surface. By concentrating on such areas where needs are greatest and where the pay-off from safeguard measures would also be greatest, conservationists can engage in a more systematized response to the challenge of large-scale extinctions impending in tropical forests.
DOI:10.1016/j.tree.2010.01.007URL [本文引用: 1]
