 ,1,2, 武悦1, 邓羽,3, 徐姗4
Model construction of urban agglomeration expansion simulation considering urban flow and hierarchical characteristics
WANG Haijun,1,2, WU Yue1, DENG Yu,3, XU Shan4通讯作者:
收稿日期:2021-03-15修回日期:2021-10-18
| 基金资助: |
Received:2021-03-15Revised:2021-10-18
| Fund supported: |
作者简介 About authors
王海军(1972-), 男, 陕西凤翔人, 博士, 教授, 主要从事地理模拟、国土空间规划和土地资源评价研究。E-mail:

摘要
关键词:
Abstract
Keywords:
PDF (4365KB)元数据多维度评价相关文章导出EndNote|Ris|Bibtex收藏本文
本文引用格式
王海军, 武悦, 邓羽, 徐姗. 基于城市流和层级性的城市群扩展模型构建. 地理学报, 2021, 76(12): 3012-3024 doi:10.11821/dlxb202112010
WANG Haijun, WU Yue, DENG Yu, XU Shan.
1 引言
1978年改革开放以来,中国城镇化进程显著加快。城市的经济、人口、交通和信息等联系不断增强,城际交互作用日渐紧密[1]。以城市为“节点”,城际交互作用为“线”,呈现出跨城市空间的网络结构,形成了具有一体化倾向的城市群[2]。“十三五”规划期间批准的长三角、珠三角和京津冀等19个城市群,以32.67%的土地,聚集了中国73.63%的人口,创造出中国90.87%的GDP[3],成为推动新型城镇化、引领区域发展的重要主体,在中国经济社会发展格局中的地位日益凸显。“十四五”规划明确提出要以城市群为主体推进区域协调发展和新型城镇化。因此,研究城市群空间扩展对推动区域协同发展和培育现代化都市圈具有重要意义。模拟与预测是研究城市群空间扩展的主要内容之一,对城市群发展趋势的识别、城市群未来格局的研判具有理论与实践价值。既有研究着眼于城市空间扩展模拟与预测,其中元胞自动机(Cellular Automata, CA)是模拟城市扩展的重要方法[4]。20世纪70年代Tobler[5]发现CA在解决地理问题上的优势,将其用于模拟底特律的城市扩展,使其在地理学领域发展起来。随着地理CA理论的深入探讨[6,7],CA模型得到进一步发展与完善,CA-Markov[8]、Logistic-CA[9]等模型均得到了广泛应用。现有研究大多关注CA模型与智能算法的耦合,通常将CA与多智能体(Multi-agent Systems, MAS)[10]、人工神经网络(Artificial Neural Network, ANN)[11,12]、最大熵模型(Maximum Entropy Model, MaxEnt)[13,14]、生物地理学优化算法(Biogeography-based Optimization, BBO)[15]等其他模型结合,以弥补CA模型本身缺陷,使模拟效果更接近于真实的城市扩展。上述研究通常以挖掘元胞转换规则、提高模型模拟精度为目标改进已有方法,大多关注单一城市空间扩展,忽略了城际交互影响。此外,与人工智能算法结合虽然会提高模拟精度,但智能算法多为黑箱模型,对城市扩展驱动机制解析能力较为欠缺。
作为城市发展到成熟阶段的最高空间组织形式,城市群中城市网络[16]与城市层级[17]并存。因此城市群空间扩展模拟不同于单一城市的模拟,既要考虑城市间的网络交互,又要顾及城市群的层级性。在城市空间扩展模型中,城市网络交互通常指城市间经济、人口等各类要素的流动,即“城市流”,是城市间交互与联系的重要形式。既有研究已经考虑到城市交互作用的影响,主要从以下两个方面开展研究:① 通过表征城市流对传统CA模型进行改进,如何建华等[18]量化城市流后将其作为转换规则嵌入CA模型,实现了城市群联动增长,发现考虑城市流后模拟精度得到提高;何力等[19]结合城市流与重力模型,对武汉城市圈进行模拟预测,得出城市流对城市群土地利用变化具有显著影响的结论;Xia等引入双向流改进了传统引力模型[20],从宏观、中观、微观3个角度构建模型[21],证实城市流是城市群扩展重要的驱动因素,考虑城市流的模拟结果更为准确;② 结合交互性模型反映城际远程联系,预测不同区域的城市土地需求量,融入CA转换规则中,如Chen等[22]结合MRIO模型刻画城市土地要素的流动,在估算城市土地供需关系的基础上模拟全国范围内的城市扩展,取得较好的模拟结果。由此可见,模拟城市群等大尺度区域的空间扩展时,城市流是不可忽略的因素之一。目前城市的层级性逐渐得到学术界关注,对城市层级的理解见仁见智,相关研究从不同角度切入:孙毅中等[23]面向多层次规划管控,根据城市规划体系中的层级关系构建多层次矢量CA,用于模拟江阴市土地利用变化;Shu等[24]从土地利用系统的层级特征出发,分为元胞与乡镇两个层级,通过构建多层逻辑CA模拟徐州市铜山区的城市扩展。上述研究涉及城市层级性的研究均具有更好的模拟效果,但既有研究的空间尺度普遍较小,多限于城市尺度内空间组团的模拟,未关注到城市群扩展的层级性问题。城市群体系由多个城市集聚而成,空间范围广,内部要素流动频繁,是多核心、多层次的复杂系统。因此城市群尺度下的城市流与层级性的作用更加突显,是城市群空间扩展研究中不可忽视的重要因素。
本文在研究城市群空间扩展时考虑城市网络交互的影响,运用城市流刻画城市群内部的交互作用,同时顾及城市群的层级性特征,采用分层广义线性模型(Hierarchical Generalized Linear Model, HGLM)研究城市群演变的分层驱动机制,构建HGLM-CA模型模拟城市群空间扩展情况。选取长江中游城市群为研究区展开实证研究,解释城市群空间扩展分层驱动机制,并将模拟结果与Logistic-CA模型、BBO-CA模型进行对比,探讨HGLM-CA模型的优势与不足。
2 研究方法
2.1 分层广义线性模型
分层广义线性模型(Hierarchical Generalized Linear Models, HGLM),也称非线性分层模型,由分层线性模型(Hierarchical Linear Model, HLM)发展而来。HLM的因变量局限于连续型数据,HGLM在此基础上进行改进,可以处理二元因变量。HLM系列模型是同时考虑总体因素与个体因素的统计分析方法,能够处理具有层级特征的数据。传统Logistic回归只能考虑单个层级下的因素,通常忽略层级差异,将高层级因素分解到低层级进行研究,使得从同一整体取得样本具有相关性,不满足独立性假设。HLM克服传统Logistic的缺陷,将个体层回归分析后得到的参数,进行聚合后在总体层再次进行回归分析,也被称为“回归的回归”,能有效处理层级特征数据[25]。在实际应用中,HLM系列模型对样本的群组个数有一定要求[26],组数过少可能导致模型无法收敛。多层结构数据是普遍存在的[27]。在城市群空间扩展问题中,城市群具有层级特征,用地单元(元胞)镶嵌于城市,元胞转换概率由于所在城市的不同而有所差异,因此用于描述元胞特征的自变量为个体变量,位于较低层级(level 1),用于描述城市特征的自变量为组变量,位于总体层,层级较高(level 2),同一城市内组变量的值相同。本文将城市群分为元胞层(level 1)与城市层(level 2)两个层级进行研究,公式如下:
level 1:
level 2:
式中:PSij(yij = 1)为元胞转变为城市用地的适宜性;ηij为描述元胞状态转变的向量;Xnij为元胞层(level 1)中位于城市j的元胞i的第n个自变量;k为元胞层中自变量的个数;
2.2 HGLM-CA模型
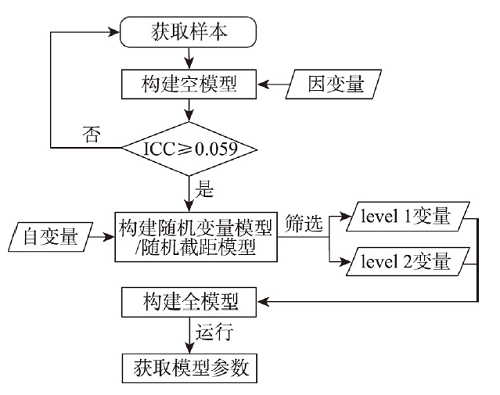
2.2.1 基于HGLM的权重参数获取 应用HGLM的第一步是建立空模型(Null Model),目的是通过计算组内相关系数(Intraclass Correlation Coefficient, ICC),判断数据是否适合分层研究。ICC为组间方差占总方差的比例,ICC值越大,说明群组之间产生的差异对因变量的影响越大,即元胞状态转变概率受到城市层因素的影响越大,城市层因素越不能被忽视。一般来说,ICC < 0.059时为低度组内相关,0.059 ≤ ICC < 0.138时为中度组内相关,ICC ≥ 0.138时为高度组内相关。公式如下:式中:ICC为组内相关系数;
将元胞层变量、城市层变量分别加入空模型中得到随机协变量模型与随机截距模型,可验证元胞层变量、城市层变量对因变量影响的显著性与对方差的解释程度。将两个层次的变量加入模型中构建全模型,得到各变量以及变量间关系的权重参数(图1)。
图1
 新窗口打开|下载原图ZIP|生成PPT
图1基于HGLM的参数获取流程图
Fig. 1Flow chart of parameter acquisition based on HGLM
2.2.2 城市群CA转换规则 定义转换规则是CA的核心[28],本文综合考虑元胞状态转变适宜性、约束条件以及邻域作用三方面的影响构建CA模型转换规则。由于后续实验中涉及到不同模型精度对比,暂不将随机效应纳入转换规则。公式如下:
式中:Pij为元胞转换概率;Ωij为邻域作用;PSij为元胞状态转变适宜性,通过HGLM得到:
式中:con(Sij)为约束条件,不允许开发的区域(如水域)赋值为0,其他为1。
本文选用3×3的Moore邻域进行研究,邻域对元胞转换的影响为:
设定转换阈值,判断元胞状态是否发生改变。根据元胞转换数量与迭代次数,得到每次迭代需要转换的元胞个数。计算元胞转换概率P,按概率大小排列可转换的元胞。本文选取对应迭代个数的元胞概率为转换阈值Pthreshold,判断元胞状态是否发生改变。元胞在下一时刻的状态
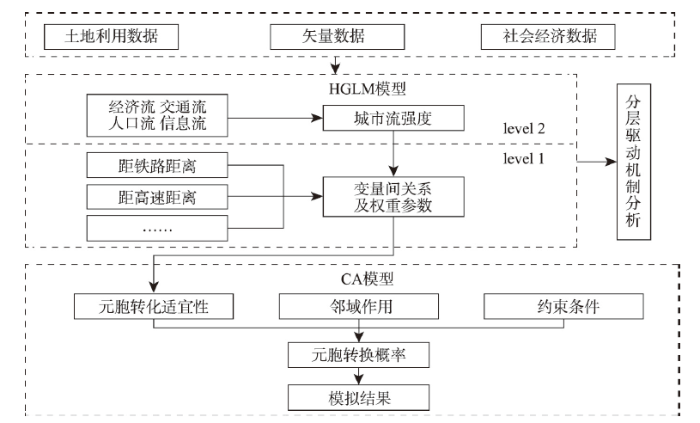
本文采用城市流强度刻画城市间交互作用,运用HGLM分析城市群空间扩展分层驱动机制,获取不同层次驱动因素及其相互关系的权重作为CA模型的参数,构建HGLM-CA模型模拟城市群空间扩展情况(图2)。
图2
 新窗口打开|下载原图ZIP|生成PPT
图2HGLM-CA模型框架
Fig. 2Framework of HGLM-CA model
3 案例分析
3.1 研究区与数据来源
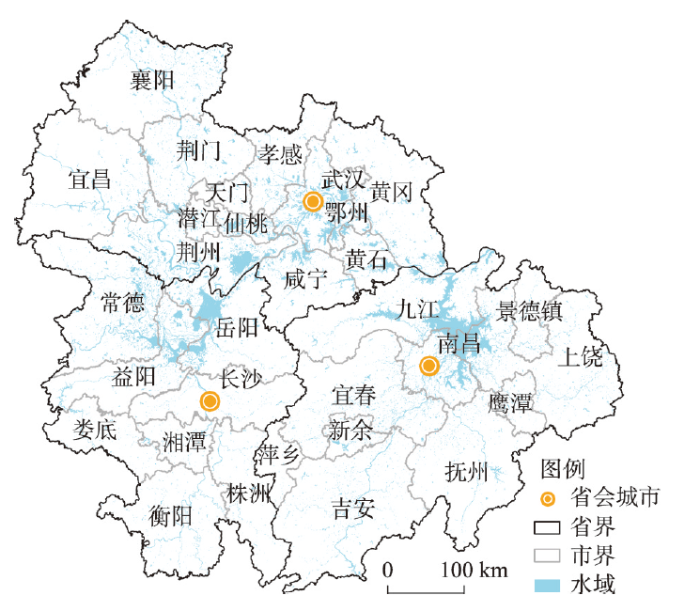
本文选取长江中游城市群为研究区,包括武汉、长沙、南昌在内的31个城市(图3)。长江中游城市群是由国务院批复的跨区域国家级城市群,是协调区域发展、推进新型城镇化的重点区域。长江中游城市群涵盖范围广,城市间经济实力与城镇化水平存在差异。武汉市2019年城镇常住人口超过900万人,常住人口城镇化率超过80%[29],成为中国中部的核心城市,长沙、南昌常住人口、人均GDP均位于前列,而黄冈、益阳等城市综合实力仍较弱,可见长江中游城市群各城市发展情况差异显著。研究数据主要有长江中游城市群2007年、2012年、2017年土地利用数据、道路数据、城市流数据等(表1)。图3
 新窗口打开|下载原图ZIP|生成PPT
图3研究区域图(长江中游城市群)
Fig. 3Location of the study area (urban agglomeration in the middle reaches of the Yangtze River)
Tab. 1
表1
表1主要数据来源与处理
Tab. 1
| 数据名称 | 数据说明 | 数据来源 |
|---|---|---|
| 土地利用数据 | 城市区域不透水面数据,利用不透水表面映射算法和GEE得到,分辨率为30 m×30 m,将不透水面视为城市用地,其他为非城市用地,重采样为90 m×90 m | 由清华大学宫鹏等[30]研究公布( |
| 道路数据 | 包括铁路、高速公路、国道在内的shp格式数据 | 中国科学院资源环境科学与数据中心( |
| DEM数据 | 基于最新的SRTM V4.1数据经整理拼接生成,分辨率为90 m×90 m | 中国科学院资源环境科学与数据中心( |
| 城市流数据 | 根据统计年鉴数据与时空地理大数据,分别构建经济流、人口流、交通流、信息流模型[31,32],得到各要素流强度,4种要素流加权平均得到城市流强度 | 见参考文献[31] |
新窗口打开|下载CSV
3.2 HGLM-CA模型运行与模拟
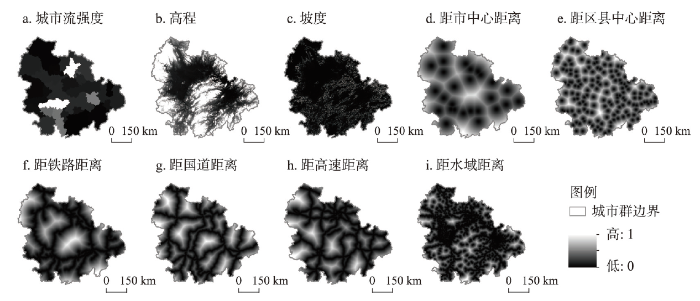
选取2007年、2012年、2017年土地利用数据进行研究,前两期数据用于模型参数校准,最后一期数据用于模型评价。本文选取包括城市流强度、高程、坡度及距市中心、区县中心、铁路、国道、高速公路、水域的欧式距离在内的9个驱动因素进行实验(图4)。在ArcGIS平台下,处理各驱动因素并标准化,叠加分析提取土地利用状态由非城市用地转变为城市用地的区域,随机抽样后剔除异常值点得到训练样本。由于研究范围较大,兼顾到计算效率,本文从用地状态转变区域与未转变区域分别抽取3000与30000个样本进行实验,通过HGLM得到变量参数,代入CA模型中得到模拟结果。图4
 新窗口打开|下载原图ZIP|生成PPT
图4长江中游城市群空间扩展驱动因素
Fig. 4Driving factors of urban agglomeration spatial expansion in the middle reaches of the Yangtze River
3.3 城市群空间扩展分层驱动机制
城市群空间扩展是驱动因素共同作用的结果,分析驱动机制对城市群发展规划具有重要意义[33]。本文借助HLM 6.08软件构建HGLM,分析长江中游城市群的分层驱动机制。首先构建空模型进行方差分析,初步运行结果如表2所示。通过表2可知,截距平均值(γ00)与斜率平均值(μ0)均存在(P < 0.01)。组间方差为0.431,逻辑回归残差方差通常为π2/3,可得ICC = 0.116,为中度组内相关,说明有11.6%的方差是由元胞所在城市不同而造成的,因此不同城市间的差异不可忽视,有必要进行分层分析。Tab. 2
表2
表2HGLM方差分析结果
Tab. 2
| 固定效应 | 系数 | 标准误差 | T检验 | P值 | 随机效应 | 标准差 | 方差分量 | 卡方检验 | P值 |
|---|---|---|---|---|---|---|---|---|---|
| γ00 | -2.081 | 0.120 | -17.337 | 0.000 | μ0 | 0.657 | 0.431 | 1571.213 | 0.000 |
新窗口打开|下载CSV
通过构建随机协变量模型、随机截距模型及完整模型,进行多次试验筛选自变量,将其分为解释变量与控制变量两类。城市群空间扩展驱动因素层级划分如下:元胞层(level 1)自变量包括距市中心距离、距区县中心距离、距铁路距离、高程、坡度、距水域距离、距国道距离、距高速距离,其中距市中心、区县中心、铁路的距离作为解释变量,其他变量为控制变量,不考虑城市层变量对其影响。城市层(level 2)为城市流强度,城市流强度因所在城市而异,同一城市内城市流强度相同。因变量为二分变量,1表示元胞转变为城市用地,0表示元胞状态未改变。最终构建HGLM框架如图5所示,运行HGLM后得到参数识别结果(表3)。
图5
 新窗口打开|下载原图ZIP|生成PPT
图5HGLM示意图
Fig. 5Schematic diagram of HGLM
Tab. 3
表3
表3HGLM变量参数识别结果
Tab. 3
| 系数 | P值 | 系数 | P值 | ||
|---|---|---|---|---|---|
| 截距: | 控制变量: | ||||
| level 1截距β0 | 高程 | ||||
| 截距γ00 | -1.429 | 0.000 | 截距γ40 | -0.592 | 0.000 |
| 城市流γ01 | 0.947 | 0.000 | 坡度 | ||
| 自变量: | 截距γ50 | -1.764 | 0.000 | ||
| 距市中心距离β1 | 距水域距离 | ||||
| 截距γ10 | -3.261 | 0.000 | 截距γ60 | 0.313 | 0.315 |
| 城市流γ11 | -8.176 | 0.000 | 距国道距离 | ||
| 距区县中心距离β2 | 截距γ70 | -0.486 | 0.111 | ||
| 截距γ20 | -1.899 | 0.001 | 距高速距离 | ||
| 城市流γ21 | -1.790 | 0.206 | 截距γ80 | -0.297 | 0.391 |
| 距铁路距离β3 | |||||
| 截距γ30 | -1.338 | 0.048 | |||
| 城市流γ31 | 4.752 | 0.021 | |||
新窗口打开|下载CSV
从参数识别结果可知,城市流与元胞状态转变概率呈正相关(γ01 > 0),说明城市流对城市群空间扩展的影响显著,城市中城市流强度越高,该城市内的元胞越容易转变为城市用地。自变量中,距市中心距离系数β1权重最大,反映出市中心对元胞转变概率有较大影响。市中心距离γ10以及城市流对市中心距离的作用γ11与元胞状态转变概率均呈负相关关系,说明城市流的存在,加剧了距市中心距离这一变量的影响,使得距市中心较近的土地单元,更容易转变为城市用地,而距市中心较远的土地转变为城市用地更加困难,这种现象在城市流强度越高的区域越明显。距区县中心距离对城市群空间扩展的影响仅次于市中心,但城市流对区县中心的作用不显著(γ21 = -1.790,P > 0.1)。道路因素中铁路对城市扩展的贡献较大,同时城市流对铁路的调节作用十分明显,使铁路对元胞转变概率的影响在不同城市中呈现不同的效果。由于元胞转换概率与距铁路距离γ30呈负相关,而与城市流对距铁路距离的作用γ31呈正相关,因而在城市流强度较低的城市中,城市流作用较为微弱,会弱化铁路对元胞转变概率的影响程度;在城市流强度较高的地区,随着城市流的增强,城市流对铁路因素的影响逐渐显现,极有可能使距铁路距离系数β3由负转正。因此,在经济社会发展水平较高的城市中会出现距铁路越远的土地单元转变为城市用地的概率反而越大的现象。控制变量中,高程γ40、坡度γ50对城市群空间扩展的影响较大,反映出地形因素仍是制约城市发展的重要因素之一,地形地貌对塑造城市形态起到一定作用。由HGLM分析结果可知,作为高层(城市层)因素的城市流不仅对元胞转换概率有显著的正向影响,同时会调节低层(元胞层)自变量对元胞转换概率的影响程度,使同一种驱动因素在不同城市中呈现出不同的影响效果。
3.4 HGLM-CA模拟结果分析
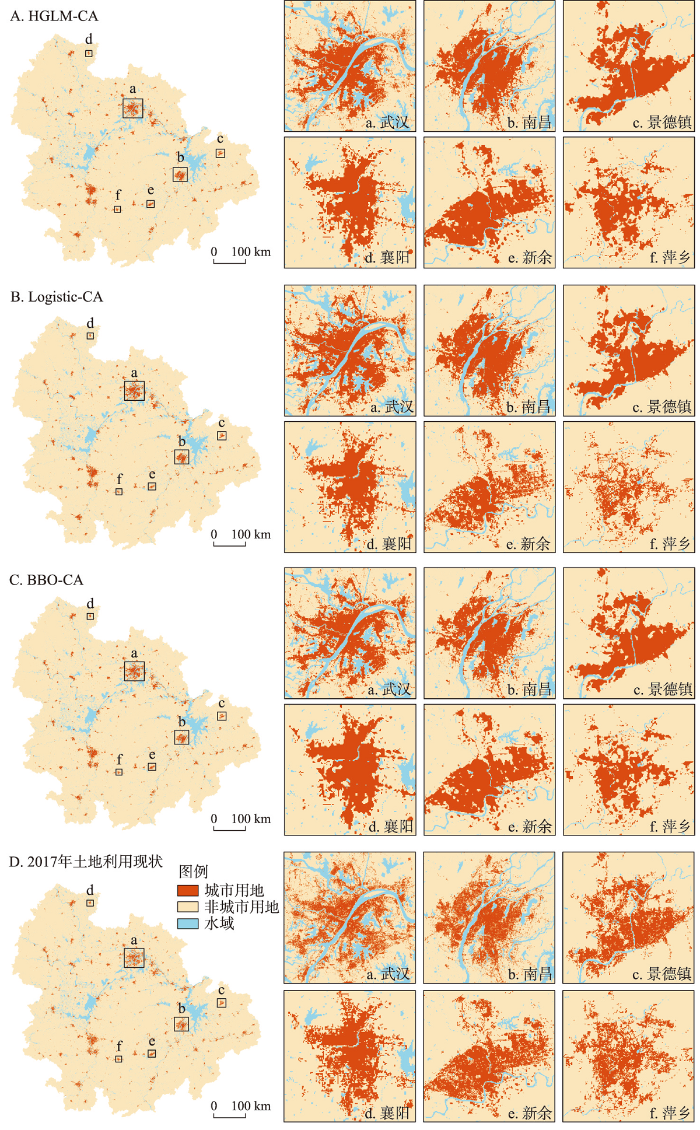
分别采用Logistic模型、BBO模型获取城市流强度在内的9个驱动因素参数,构建Logistic-CA模型、BBO-CA模型并进行模拟,得到HGLM-CA,Logistic-CA和BBO-CA模型的模拟结果(图6)。本文选用整体精度OA、Kappa指数、FoM值3个指标评价模拟结果,将HGLM-CA与Logistic-CA、BBO-CA模型对比,对比结果如表4所示。图6
 新窗口打开|下载原图ZIP|生成PPT
图62017年长江中游城市群空间扩展模型模拟结果对比
Fig. 6Comparison of the simulation result of the urban spatial expansion model in the middle reaches of the Yangtze River
Tab. 4
表4
表42017年长江中游城市群空间扩展模型模拟精度对比
Tab. 4
| HGLM-CA | Logistic-CA | BBO-CA | ||||||||||
|---|---|---|---|---|---|---|---|---|---|---|---|---|
| OA | Kappa | FoM | OA | Kappa | FoM | OA | Kappa | FoM | ||||
| 整体精度 | 城市群 | 0.99436 | 0.79872 | 0.18085 | 0.99427 | 0.79574 | 0.17374 | 0.99455 | 0.80567 | 0.19779 | ||
| 分区精度 | 武汉市 | 0.95525 | 0.78844 | 0.14126 | 0.93924 | 0.74020 | 0.18817 | 0.94952 | 0.77246 | 0.18303 | ||
| 黄石市 | 0.97859 | 0.81788 | 0.17746 | 0.98138 | 0.83651 | 0.16789 | 0.98146 | 0.83816 | 0.18391 | |||
| 宜昌市 | 0.99445 | 0.78486 | 0.20519 | 0.99461 | 0.78646 | 0.18571 | 0.99448 | 0.78702 | 0.21576 | |||
| 襄阳市 | 0.99498 | 0.82902 | 0.15516 | 0.99514 | 0.82517 | 0.03963 | 0.99475 | 0.82610 | 0.19173 | |||
| 鄂州市 | 0.94591 | 0.69046 | 0.14923 | 0.95070 | 0.70959 | 0.15293 | 0.96023 | 0.75093 | 0.16121 | |||
| 荆门市 | 0.99516 | 0.82205 | 0.11262 | 0.99563 | 0.83010 | 0.01952 | 0.99485 | 0.81586 | 0.14256 | |||
| 孝感市 | 0.98711 | 0.77240 | 0.17225 | 0.98773 | 0.77889 | 0.16251 | 0.98763 | 0.77942 | 0.17561 | |||
| 荆州市 | 0.99185 | 0.78990 | 0.15924 | 0.99196 | 0.79076 | 0.14808 | 0.99238 | 0.80328 | 0.18866 | |||
| 黄冈市 | 0.99170 | 0.76696 | 0.15049 | 0.99208 | 0.77326 | 0.14080 | 0.99192 | 0.77603 | 0.18343 | |||
| 咸宁市 | 0.99392 | 0.82252 | 0.12214 | 0.99464 | 0.83704 | 0.08533 | 0.99347 | 0.81337 | 0.13292 | |||
| 仙桃市 | 0.99208 | 0.83366 | 0.00041 | 0.99204 | 0.83445 | 0.02894 | 0.99065 | 0.82169 | 0.16428 | |||
| 潜江市 | 0.98856 | 0.81205 | 0.04288 | 0.98857 | 0.81206 | 0.04001 | 0.98702 | 0.80615 | 0.18890 | |||
| 天门市 | 0.99343 | 0.79276 | 0.01163 | 0.99346 | 0.79249 | 0.00210 | 0.99301 | 0.80157 | 0.19527 | |||
| 长沙市 | 0.97542 | 0.79792 | 0.19991 | 0.97230 | 0.78174 | 0.21561 | 0.97574 | 0.80148 | 0.21485 | |||
| 株洲市 | 0.98999 | 0.77736 | 0.18150 | 0.99006 | 0.77920 | 0.18720 | 0.99081 | 0.79106 | 0.18815 | |||
| 湘潭市 | 0.97724 | 0.75437 | 0.21572 | 0.97718 | 0.75427 | 0.21746 | 0.98161 | 0.78615 | 0.20658 | |||
| 衡阳市 | 0.99068 | 0.77667 | 0.20602 | 0.99089 | 0.78041 | 0.20796 | 0.99141 | 0.78814 | 0.20171 | |||
| 岳阳市 | 0.99359 | 0.81224 | 0.14242 | 0.99422 | 0.82528 | 0.12560 | 0.99355 | 0.81314 | 0.16095 | |||
| 常德市 | 0.99417 | 0.78845 | 0.17407 | 0.99461 | 0.79653 | 0.14288 | 0.99435 | 0.79537 | 0.19085 | |||
| 益阳市 | 0.99511 | 0.78612 | 0.18180 | 0.99544 | 0.79554 | 0.17560 | 0.99578 | 0.80790 | 0.18663 | |||
| 娄底市 | 0.99284 | 0.80869 | 0.19307 | 0.99392 | 0.82569 | 0.13254 | 0.99350 | 0.82162 | 0.19003 | |||
| 南昌市 | 0.96873 | 0.79236 | 0.25293 | 0.96683 | 0.78406 | 0.25614 | 0.97187 | 0.80732 | 0.25144 | |||
| 景德镇 | 0.98913 | 0.79545 | 0.27337 | 0.98991 | 0.80425 | 0.26468 | 0.99082 | 0.81581 | 0.25770 | |||
| 萍乡市 | 0.98945 | 0.79041 | 0.17084 | 0.99075 | 0.79585 | 0.01749 | 0.98967 | 0.79303 | 0.16650 | |||
| 九江市 | 0.99296 | 0.80933 | 0.21376 | 0.99308 | 0.81093 | 0.20696 | 0.99303 | 0.81233 | 0.22926 | |||
| 新余市 | 0.98812 | 0.85138 | 0.27223 | 0.99066 | 0.86902 | 0.09938 | 0.98876 | 0.85730 | 0.26929 | |||
| 鹰潭市 | 0.98118 | 0.73188 | 0.23667 | 0.98301 | 0.74787 | 0.23628 | 0.98613 | 0.77889 | 0.23856 | |||
| 吉安市 | 0.99532 | 0.77351 | 0.20956 | 0.99562 | 0.78092 | 0.19306 | 0.99591 | 0.79410 | 0.21761 | |||
| 宜春市 | 0.99310 | 0.81064 | 0.12226 | 0.99302 | 0.80679 | 0.09893 | 0.99240 | 0.80345 | 0.18943 | |||
| 抚州市 | 0.99558 | 0.80872 | 0.17760 | 0.99598 | 0.81430 | 0.09066 | 0.99566 | 0.81252 | 0.19129 | |||
| 上饶市 | 0.99397 | 0.79382 | 0.16224 | 0.99446 | 0.80489 | 0.14914 | 0.99459 | 0.81160 | 0.18193 | |||
新窗口打开|下载CSV
比较模拟结果发现,BBO-CA模拟效果整体优于HGLM-CA,HGLM-CA优于Logistic-CA。其中OA与Kappa值较为接近,BBO-CA的FoM值明显高于另外两种模型。相较于2017年土地利用现状,不同城市的模拟精度存在差异,如在武汉市中,Logistic-CA、HGLM-CA、BBO-CA的模拟效果均较差,尤其在边缘地带存在较多城市用地未被识别;而3种模型在南昌、景德镇等地区的模拟效果普遍较好,OA、Kappa、FoM值均较高,其中FoM值明显高于其他地区,均在0.25以上。此外,在同一城市中不同模型的模拟精度也存在较大差异。由于3类模型的OA与Kappa值差距较小,因而根据FoM值评价模拟结果:在长江中游城市群的大部分城市中BBO-CA模型的模拟效果最好,尤其是湖南湖北地区的FoM值普遍高于其他两类模型;在新余、萍乡等城市中,HGLM-CA模型的模拟精度最优,FoM值分别为0.27223与0.17084,BBO-CA的FoM值略低于HGLM-CA;在南昌等城市中,Logistic-CA模型表现出较好的模拟效果,FoM值为0.25614,略高于BBO-CA与HGLM-CA,但在襄阳、新余等城市中,FoM值均低于0.10,与另外2种模型的模拟精度存在较大差距。
HGLM-CA将驱动因素分为两个层级,城市流强度作为城市层因素,对元胞层因素进行调节。整体来看,HGLM-CA的OA、Kappa、FoM值相较于Logistic-CA均有小幅度的提高,在大多数城市的模拟效果优于Logistic-CA,说明考虑城市群的层级性一定程度上能够提高CA模型的模拟精度,同时反映出Logistic回归识别CA参数时存在欠拟合问题,模拟效果较差。考虑层级性影响后,HGLM-CA模型能够更深入的挖掘转换规则,得到更优的模拟效果。与BBO-CA相比,二者的OA与Kappa值相差不大,但HGLM-CA模型的FoM值明显低于BBO-CA,且在大部分城市中的模拟精度低于BBO-CA,说明相比智能算法HGLM在获取参数时仍存在一定局限性。BBO-CA模型虽然模拟精度最高,但对驱动机制的解析方面较为欠缺。
4 结论
与单一城市空间扩展相比,城市群空间扩展更为复杂。本文基于城市流与层级性,构建HGLM-CA模型,分析城市群空间扩展的分层驱动机制,实证模拟长江中游城市群空间扩展,并与Logistic-CA模型、BBO-CA模型进行对比。主要结论如下:(1)长江中游城市群作为中国中部的特大城市群,城际联系紧密,分析其空间扩展驱动机制时需要考虑城市流的影响。本文将城市流作为城市层驱动因素展开研究,发现城市流强度与城市群空间扩展具有显著的正相关关系,城市流是影响长江中游城市群空间扩展的重要因素。
(2)由于HGLM对样本群组数量有较高要求,利用HGLM方法分析分层驱动机制更适用于尺度较大、分区较多的区域。本文以涵盖31个城市的长江中游城市群为研究区进行实证,能够有效剖析城市群的分层驱动机制。通过实验得出城市层因素的城市流强度对元胞层各驱动因素起到重要的调节作用,在城市流作用下元胞层因素与元胞转换概率的相关关系发生改变,会弱化、加强甚至反向加强驱动因素对元胞转换概率的影响,使得不同城市的元胞层因素的驱动效果有所差异,体现出驱动因素的城际分异性。
(3)对比模型结果,HGLM-CA模型相较于传统Logistic-CA模型,整体OA、Kappa、FoM值均有一定程度的提高,分区精度中大部分城市呈现出更高的FoM值,因此考虑城市群的城市流与层级性使得模拟结果更为准确。相比BBO-CA模型,HGLM-CA模型精度略低。人工智能BBO-CA模型在参数获取方面具有一定优势,其城市群空间扩展模拟效果较HGLM-CA等线性模型更优,但其目的偏向于提高模型模拟精度,在寻优过程中设定的若干参数往往欠缺地理含义,因而不利于城市群演变机制的剖析。HGLM-CA模型通过分析不同层级驱动因素与城市群空间演变的相关关系,以及高层因素对低层因素的调节作用,解释城市群空间扩展机制,从而反映城市群空间扩展过程中多层级驱动因素间复杂的相互关系,便于科学把握城市群空间扩展的内在机制。
随着信息技术的发展,人工智能在遥感图像解译、地图制图等地理学领域突显出特有的优越性。但在城市群空间扩展模拟的相关研究中,传统线性模型在迅速崛起的人工智能面前并非完全不具优势。城市群是复杂的演化系统,研究城市群空间扩展的初衷,是将复杂的城市系统简化,从而便于理解与研究,而非使用更加繁杂的方法进行模拟与预测,换取模拟精度的略微提高。从这个角度来看,对传统线性模型的改进与对智能模型的创新同样具有研究价值。如何保留传统线性模型“简单”的优势,克服欠拟合的缺陷,同时将人工智能赋能传统线性模型是城市群空间扩展中值得讨论与研究的问题之一。此外,根据长江中游城市群的实验结果来看,HGLM-CA、Logistic-CA、BBO-CA模拟结果与2017年实际土地利用状况仍有较大差距,存在较多未识别出的城市用地。城市群具有复杂性,真实的城市群空间扩展往往更破碎化、零星化,如何理解城市群空间扩展驱动机制与时空分异规律进而有效支撑模型转换规则与整体优化,在后续研究中仍需不断探索。
参考文献 原文顺序
文献年度倒序
文中引用次数倒序
被引期刊影响因子
[本文引用: 1]
[本文引用: 1]
DOI:10.11821/dlxb201408009 [本文引用: 1]

Urban agglomeration has been the inevitable result of China's rapid industrialization and urbanization over the last 30 years. Since the early 2000s, urban agglomeration has become the new regional unit participating in international competition and the division of labor. China has declared urban agglomeration the main spatial component of new types of urbanization over the next decade as clarified at the first Central Urbanization Working Conference and in the National New-type Urbanization Plan (2014?2020). However, research on urban agglomeration remains weak and needs to be strengthened. From 1934 to 2013, only 19 papers published in Acta Geographica Sinica contained the theme of urban agglomeration (0.55% of the total number of articles published) and the first paper on urban agglomeration appeared less than 10 years ago. Despite a small number of divergent studies, this work has contributed to and guided the formation of the overall pattern of urban agglomeration in China. For example, spatial analyses have promoted the formation of the fundamental framework of China's urban agglomeration spatial structure and guided the National New-type Urbanization Plan; spatial identification standards and technical processes have played an important role in identifying the scope and extent of urban agglomeration; serial studies have facilitated pragmatic research; and problems with the formation and development of urban agglomeration have provided a warning for future choices and Chinese development. Future research into urban agglomeration in China should (1) review and examine new problems in China's urban agglomeration options and cultivation; (2) critically consider urban agglomeration when promoting the formation of the 5+9+6 spatial pattern; (3) rely on urban agglomeration to construct new urbanization patterns such as 'stringing the agglomerations with the axis, supporting the axis with the agglomerations'; and (4) deepen national awareness about resources, environment effects and environmental carrying capacity in high density urban agglomerations, management and government coordination innovation, the construction of public finance and fiscal reserve mechanisms, the technical regulation of urban agglomeration planning, and standards for identifying the scope and extent of urban agglomeration.
[本文引用: 1]
[本文引用: 1]
[本文引用: 1]
DOI:10.1080/13658816.2019.1568441URL [本文引用: 1]
DOI:10.2307/143141URL [本文引用: 1]
DOI:10.1068/a170585URL [本文引用: 1]
DOI:10.1068/b160141URL [本文引用: 1]
DOI:10.1016/S0167-8809(02)00219-0URL [本文引用: 1]
DOI:10.1080/0042098975286URL [本文引用: 1]
[本文引用: 1]
[本文引用: 1]
[本文引用: 1]
[本文引用: 1]
[本文引用: 1]
[本文引用: 1]
DOI:10.1080/13658816.2019.1687898URL [本文引用: 1]
DOI:10.1111/tgis.v24.6URL [本文引用: 1]
[本文引用: 1]
[本文引用: 1]
DOI:10.11821/dlyj201504010 [本文引用: 1]
Fuelled by globalization, informatization and rapid urbanization, the Chinese urban system has witnessed dramatic changes in the past four decades, which shows a combined changing characteristic in both expanded geographical scope and intensified intercity connections. This paper investigates an integrated network-based approaches and spatial analysis to explore the spatial organization process and the basic regularity of Chinese intercity networks. More specifically, this study examines how 330 Chinese cities are connected through 108,570 ownership linkages of 307,915 local corporations for the year 2010. Major findings include: (1) the backbone of the Chinese intercity corporate network is diamond-shaped and anchored by four major metropolitan areas (Beijing in the North; Shanghai, East; Guangzhou-Shenzhen, South; Chengdu, West), intercity network strengths reveal a significant spatial heterogeneity; (2) urban network organization is a complicated process that involve both preferential attachment and geographic proximity interactions; (3) the overall structure of the intercity corporate networks undergo a transition process that from a simple random period to a complex but orderly one and also features small-world network properties; (4) city degree distribution of Chinese intercity networks is characterized by weak assortativity and rich-club effects; and (5) a combination interpretation of clustering coefficient and degree distribution identifies hierarchical and regional tendencies.
[本文引用: 1]
DOI:10.11821/dlxb202001013 [本文引用: 1]
In recent years, land urbanization, as a spatial manifestation of China's expanding urbanization, has emerged as a core research field within urban geography and land science. Provincial administrative departments within China's distinctive administrative system significantly influence municipal administrative departments and urbanization levels. Individual-level influencing factors cannot fully explain the Chinese mode of urbanization. Therefore, a multilevel linear model was developed to identify factors influencing China's land urbanization process. The results indicated that in 2005, factor inputs, in particular, and public service critically influenced land urbanization in municipal urban areas. By 2016, economic development levels had superseded factor inputs, public service, and population agglomeration as the key influencing factor. At the provincial level, differences in economic development levels critically influenced land urbanization. The provincial government's prioritization of ecological and agricultural resource conservation had a significant negative impact on city-level factors and urban built-up areas. The relationship between the government's developmental attitude, geographical locations, and city-level factors was complex and varied according to regional development levels. A further finding was that since China's reform and opening-up policy was initiated in 1978, land urbanization has been driven by industrialization and urbanization, gradually shifting from government-led to economy-driven stage. Thus, a multilevel study of land urbanization reveals mechanisms and cross-level relationships among different factors that influence levels of land urbanization. Moreover, it provides a theoretical basis for rational policy formulation.
[本文引用: 1]
[本文引用: 1]
[本文引用: 1]
[本文引用: 1]
[本文引用: 1]
DOI:10.1080/13658816.2018.1562067URL [本文引用: 1]
URL [本文引用: 1]
DOI:10.1016/j.scitotenv.2018.10.283URL [本文引用: 1]
DOI:10.11821/dlxb202010009 [本文引用: 1]
Urban planning plays an important guiding role in land use change. The planning at all levels supports and complements each other, and influences the evolution of land-use pattern from top to bottom. Vector cellular automata, which takes irregular geographical entities as its basic units, can express the objective and complicated urban land use structure in a more realistic way, and has become one of the focus in the land use change research. However, when we face urban planning with the characteristics of hierarchical synergy, spatial guidance and controlled conductivity, some key issues are highlighted, such as the establishment of CA hierarchical system, the construction of hierarchical synergy and the acquisition of transition rules. After constructing the multilevel vector CA model, we chose Jiangyin City as the study area and its land use data covering the years 2007, 2012 and 2017 as the basic data to simulate the land use changes from 2012 to 2017. On the basis of multilevel vector cellular automata model, through the comparative analysis between the simulation results and the current situation of land use in 2017, the individual parameters of the model were modified to further improve the feasibility and applicability of the model, and then the urban land use pattern in 2022 was predicted. The simulation results indicated that the development of construction land in Central District has become saturated, while the expansions of construction land in Chengnan District, Chengdongnan District and Chengdong District were obvious. From an overall perspective, there was a tendency to gradually form a three-level urban-rural spatial settlement system "central city area-urban agglomeration-village". Using FoM index, we concluded that the simulation results had great simulation precision and the model had high feasibility and applicability, because the FoM values of the whole city and each district were almost greater than or close to 0.21. This shows that the simulation results are more accurate and the model is more effective in the simulation of land use change based on urban planning.
[本文引用: 1]
URL [本文引用: 1]
[本文引用: 1]
[本文引用: 1]
[本文引用: 1]
[本文引用: 1]
[本文引用: 1]
[本文引用: 1]
[本文引用: 1]
http://www.geog.com.cn/article/2021/0375-5444/www.wuhan.gov.cn/zwgk/tzgg, 2020-03-29(06).
URL [本文引用: 1]
http://www.geog.com.cn/article/2021/0375-5444/www.wuhan.gov.cn/zwgk/tzgg, 2020-03-29(06).]
URL [本文引用: 1]
DOI:10.1016/j.scib.2019.04.024URL [本文引用: 1]
[D].
[本文引用: 2]
[D].
[本文引用: 2]
[本文引用: 1]
[本文引用: 1]
DOI:10.11821/dlxb201806007 [本文引用: 1]
Research into urban expansion patterns and their driving forces is of great significance. Under the background of the integrated development of the Beijing-Tianjin-Hebei (Jing-Jin-Ji) urban agglomeration, it is important to study the temporal and spatial patterns of urban land expansion and the driving forces development. This paper uses land-use data of the Jing-Jin-Ji urban agglomeration from 1990 to 2015 and reveals the multi-dimensional characteristics of the urban land expansion patterns. We then combine the urban spatial interaction and the spatial and temporal nonstationarity of the urban land expansion process and build the center of gravity-geographically and temporally weighted regression (GTWR) model by coupling the center of gravity model with the GTWR model. Using the center of gravity-GTWR model, we analyze the driving forces of urban land expansion at the city scale, and summarize the dominant mode and core driving forces of the Jing-Jin-Ji urban agglomeration. The results show that: (1) Between 1990 and 2015, the expansion intensity of the Jing-Jin-Ji urban agglomeration showed a down-up-down trend, and the peak period of expansion was in 2005-2010. Before 2005, high-speed development was seen in Beijing, Tianjin, Baoding, and Langfang, which were then followed by rapid development in Xingtai and Handan. (2) Although the center of gravity of cities in the Jing-Jin-Ji urban agglomeration showed a divergent trend, the local interaction between cities was enhanced, and the driving forces of urban land expansion showed a characteristic of spatial spillover. (3) The spatial development mode of the Jing-Jin-Ji urban agglomeration changed from a dual-core development mode to a multi-core development mode, which was made up of three function cores: the transportation core in the northern part, the economic development core in the central part, and the investment core in the southern part. The integrated development between functional cores led to the multi-core development mode. (4) The center of gravity-GTWR model analyzes urban land expansion as a space-time dynamic system. The model proved to be feasible in the analysis of the driving forces of urban land expansion.
[本文引用: 1]
