 ,1,2,3, 武振伟1, 葛莹4, 孔繁花1
Analyzing the spatial mechanism of interprovincial migration in China under uncertainty
PU Yingxia,1,2,3, WU Zhenwei1, GE Ying4, KONG Fanhua1收稿日期:2020-10-23修回日期:2021-05-20
| 基金资助: |
Received:2020-10-23Revised:2021-05-20
| Fund supported: |
作者简介 About authors
蒲英霞(1972-), 女, 山东日照人, 博士, 副教授, 主要从事GIS与空间数据分析集成、区域人口迁移建模与复杂地理计算。E-mail:

摘要
关键词:
Abstract
Keywords:
PDF (1196KB)元数据多维度评价相关文章导出EndNote|Ris|Bibtex收藏本文
本文引用格式
蒲英霞, 武振伟, 葛莹, 孔繁花. 不确定性视角下的中国省际人口迁移机制分析. 地理学报, 2021, 76(12): 2964-2977 doi:10.11821/dlxb202112007
PU Yingxia, WU Zhenwei, GE Ying, KONG Fanhua.
1 引言
作为自然科学和哲学领域最早提出的一个范畴,不确定性及由此产生的“黑天鹅”问题已被经济学、地理学、社会学和心理学等众多领域所关注[1,2,3,4,5,6,7,8]。在人口迁移过程中,由于地区经济社会发展所面临的复杂性日益突出,同时迁移个体自身的文化知识、判断能力以及对目的地信息了解的局限性等,加剧了迁移过程的风险和不确定性[9,10,11,12]。当前随着空间自相关概念的引入,空间溢出效应为区域人口迁移过程提供了更为合理的解释[13,14,15,16,17,18,19,20]。然而,人口迁移建模中的不确定性问题,包括如何选择解释变量、如何设定模型结构、如何定义网络空间结构等,直接关系到区域人口迁移影响因素和动力机制分析的稳健性和可靠性[21]。若忽视这些问题,可能会对主导人口迁移过程的关键因素做出不恰当的分析和判断,进而影响科学制定区域人口发展规划、国土空间规划以及其他经济社会宏观战略决策等[22,23]。贝叶斯模型平均方法(Bayesian Model Averaging, BMA)为降低模型不确定性问题提供了一套切实可行的解决方案。Draper最早于1995年提出了BMA思想,即在“真”模型未知的情形下,通过构建一个两两互斥的模型空间M ={M1, M2, …, MK},以每个模型的后验概率为权重对所有可能出现的模型进行加权平均,得到一个尽可能“平均”的结果,以此表征“真”模型,进而避免逐步回归方法得到的单一“最优”模型所面临的不确定性问题[24,25]。在马尔可夫链—蒙特卡罗方法(Markov Chain Monte Carlo, MCMC)的基础上,马尔可夫链—蒙特卡罗模型综合方法(Markov Chain Monte Carlo Model Composition, MC3)应运而生,为BMA的实现提供了技术支撑[26,27]。目前,BMA方法以贝叶斯统计理论为基础,因能够克服人为主观遴选解释变量造成的信息损失等优势,在经济增长、金融管制和水资源管理等领域逐步得到应用[28,29,30,31,32],但主要集中在经典线性回归模型的变量筛选与预测分析等方面,缺乏针对空间模型的相关处理。目前,研究人员已将BMA方法拓展到空间回归模型中,并以美国1990—2000年州际人口迁移为例进行实证研究[33]。然而,随着空间计量模型的发展,单纯的系数估计已不能很好地解释自变量变化对因变量产生的影响,取而代之则是考虑空间溢出的效应估计[34]。
本文以2010—2015年中国省际人口迁移流为例,在考虑迁移流之间相互依赖关系的基础上,选取迁出地和迁入地常住人口规模、地区生产总值(GDP)、城镇职工平均工资、城镇化率、每千人医疗卫生机构床位数、每十万人口拥有大专及以上人数和迁移存量等区域经济社会变量以及时间距离因素,利用BMA和马尔可夫链—蒙特卡罗模型综合方法(MC3)对模型空间进行抽样,比较变量的后验包含概率,获得重要的影响因素,并根据后验模型概率对所有可能的模型进行加权平均,综合考虑人口迁移建模中变量选择所面临的不确定性问题,为中国省际人口迁移动力机制分析提供更为稳健和可靠的结果。为更好地解释区域经济社会变量对人口迁移的影响,本文在对模型系数估计的基础上,进一步计算变量的迁出地效应、迁入地效应和网络效应等,对人口迁移的影响因素和空间动力机制进行了定量分析。基于贝叶斯统计理论分析框架,顾及模型不确定性问题的BMA技术也可为商品流、信息流等其他要素流动现象提供有益的分析和借鉴[35]。
2 研究方法
2.1 贝叶斯模型平均
贝叶斯模型平均(BMA)在模型的拟合效果、解释力和预测精度等方面都优于单个模型,已成为当前解决模型不确定性问题的流行技术[36,37]。基于贝叶斯原理,BMA方法将模型本身和模型参数都看作具有某种统计分布形式的随机变量,以所有可能出现的模型组成模型空间,通过抽样技术计算每个模型的后验概率,以此为权重对所有模型进行加权平均。假定未知且不可观测的“真”模型由模型空间M = {M1, M2, …, Mk}按照某种概率分布生成,即:式中:θ为待估参数向量;D为观测样本数据;Mi为模型空间中第i个模型;k为模型数量;p(Mi|D)为模型Mi的后验概率;p(θ|Mi, D)是模型Mi中参数向量θ的后验概率密度;p(θ|D)为不同模型条件下参数向量θ的后验密度分布的加权平均。
根据贝叶斯原理,模型Mi的后验概率
式中:p(D|Mi)为模型Mi的似然函数;p(Mi)为模型Mi的先验概率;θi为模型Mi的参数向量;p(θi|Mi)表示模型Mi所对应的参数向量θi的先验概率分布。参数向量θ的后验方差与其后验均值一样,也是加权平均形式。
2.2 马尔可夫链—蒙特卡罗模型综合方法
对含有K个解释变量的线性回归模型而言,如何对模型空间(2K)进行抽样,寻找后验概率较高的模型是实现BMA方法的关键。目前,主流的抽样算法是马尔可夫链—蒙特卡罗模型综合方法(MC3),即在马尔可夫链—蒙特卡罗(MCMC)的基础上,采用取舍方法保留后验概率较高的模型,当抽样次数达到一定数量后能够保证抽样基于所有模型,且结果收敛[27]。具体地,假定当前马尔可夫链处在模型Mi的位置上,则下一步移动到新模型Mj的概率是:下一步仍继续停留在当前模型Mi位置上的概率为1-l。模型Mj是在一个新的模型空间上通过均匀分布方法生成的。对于一个含有2K个模型的空间,有:
引入或删除某个解释变量的先验概率为1/2,事先对变量和模型的选择均无任何偏好。
2.3 空间OD模型
在人口迁移过程中,某区域要素变化不仅影响本区域的迁入与迁出,还通过溢出效应对周边地区及整个迁移系统产生影响。空间OD模型是在重力模型的基础上,以因变量和/或自变量的空间滞后形式为补充的一类空间计量相互作用模型。其中,空间自回归模型(Spatial Autoregressive Model, SAR)作为一种全局溢出模型最为常见,其具体形式如下[15, 34]:式中:因变量迁移流y是一个N×1(N= n2)的列向量;ιN是一个N×1的单位列向量;α为截距项系数;Xo和Xd分别表示迁出地和迁入地的自变量向量,可通过一个n×K阶变量矩阵X的克罗内克积($\otimes$)得到,即Xo = X $\otimes$ In,Xd = In $\otimes$ X;βo和βd分别表示迁出地和迁入地变量的系数向量;g表示一个N×1阶距离列向量;γ为参数;ε为一个N×1阶扰动项,ε~ N(0, σ2V);V为一对角阵表示的异方差,元素为(v1, v2, …, vn),vi服从独立χ2(r)/r分布,σ2服从逆伽马分布;W为一行标准化的N×N阶网络权重矩阵;Wy是空间滞后因变量;ρ是网络自相关强度。
模型参数(β, σ2, ρ)的先验分布对模型后验概率分布具有实质性影响。
式中:参数β是a、βo、βd和γ的组合,其先验信息存在大量不确定性(或无信息型先验分布),通常设为:c = 0,T = I2K+1×10¹²(K为变量数,2K为迁出地和迁入地变量数);σ2是无信息型先验分布,a = b = 0;λmin和λmax分别为网络权重矩阵W的最小和最大特征根。采用Gibbs抽样方法对β和σ2进行抽样,Metropolis-Hastings(M-H)方法对ρ进行抽样[38]。
2.4 效应估计
空间OD模型的系数估计不再表示区域要素变化对迁移流产生的影响。其因变量对自变量的偏导数形式为变量的总体效应(式(7)),从中分解出直接效应(迁出地/迁入地效应)和间接网络效应,从不同角度描述区域要素变化对迁移流产生的多重影响[15]。考虑到各效应的矩阵维数较大,不利于直观显示,以下通过计算其标量形式予以简化。总体效应的标量式为
式中:Jdi是一个n×n阶零矩阵,且第i行等于
迁出地效应的标量式为
式中:
类似地,迁入地效应的标量式为
式中:
网络效应的标量式为
式中:Ji是值全为1的n×n阶矩阵。
3 中国省际人口迁移机制分析
3.1 数据来源
2010年以来,中国经济和人口同时进入了“新常态”[39,40],经济增长放缓和产业结构升级优化,同时人口低水平增长和人口素质显著提高,对中国人口迁移基本路径和空间格局产生了深刻影响[41]。本文以中国31个省(自治区、直辖市)的省际人口迁移流为研究对象(暂未包括港澳台地区和省内迁移),综合考虑现有文献研究成果[42,43,44,45,46],从人口因素、经济因素和社会因素等角度,选择迁出地/迁入地的常住人口规模、地区生产总值(GDP)、城镇职工平均工资、城镇化率、每千人医疗卫生机构床位数(医疗水平)、每十万人拥有大专以上人口数(教育水平)、迁移存量和时间距离等变量表征人口迁移影响因素(表1)。其中,2010—2015年省际人口迁移数据来自《2015年全国1%人口抽样调查资料》“全国按现住地和5年前常住地分的人口”(抽样比为1.55%)[47],社会经济要素采用2010年数据,来自《中国统计年鉴》(2011)[48],迁移存量来自《2010年第六次全国人口普查资料》“全国按现住地和5年前常住地分的人口”(抽样比为9.55%)[49],距离采用2010年省会城市之间铁路运输最短时间,来自《中国铁路旅客列车时刻表》(2010)[50]。所有变量在运算中均取自然对数,便于后面对效应估计进行弹性解释。Tab. 1
表1
表1模型解释变量描述
Tab. 1
| 变量名称 | 变量描述(单位) | 预期迁出地/迁入地效应 |
|---|---|---|
| O_POP/D_POP | 迁出地/迁入地2010年常住人口总数(万人) | +/+ |
| O_GDP/D_GDP | 迁出地/迁入地2010年地区生产总值(亿元) | -/+ |
| O_Wage/D_Wage | 迁出地/迁入地2010年城镇职工平均工资(元) | -/+ |
| O_Urban/D_Urban | 迁出地/迁入地2010年城镇化率(%) | +/+ |
| O_HB/D_HB | 迁出地/迁入地2010年每千人医疗卫生机构床位数(张) | +/+ |
| O_Edu/D_Edu | 迁出地/迁入地2010年每十万人口拥有大专及以上人数(人) | +/+ |
| O_Flow/D_Flow | 2005—2010年间地区迁出/迁入总量(人) | +/+ |
| Distance | 省会城市之间2010年铁路运输最短时间(s) | - |
新窗口打开|下载CSV
弹性原指某一物质抵抗外来冲击具有的稳定程度,现在也用来衡量一个因变量对另一个自变量变化的敏感程度,即自变量变化1%所引起因变量变化的百分比[51]。在当前人口迁移领域,预期人口迁移活动随着人口增长而持续活跃,即人口规模的迁出地效应和迁入地效应皆为正;地区GDP和工资水平分别表征区域宏观和个体微观经济状况,经济发展会促进外来人口迁入而降低本地人口迁出,预期迁出地效应为负,迁入地效应为正;城镇化是人口迁移的结果,也会反过来进一步促进人口迁移,预期迁出地和迁入地效应均为正;医疗水平和教育水平分别表征地区公共资源和人力资本质量,预期迁出地和迁入地效应均为正。随着时间距离的增长,省际人口迁移趋于下降,预期距离变量的符号为负。
网络结构主要考虑迁出地和迁入地的空间依赖关系。首先根据公共边界原则构建一个31×31阶空间权重矩阵C(定义海南省和广东省为邻居);其次通过克罗内克积分别得到迁出地网络权重矩阵Wo(Wo = C$\otimes$In)和迁入地网络权重矩阵Wd(Wd = In$\otimes$C),同时去除内部流所在的行与列,使之变成一个930×930阶矩阵。最后,综合考虑上述两种情形,即W = Wo + Wd。
3.2 MC3抽样结果
在模型抽样过程中,本文共进行30万次抽样,得到2615个唯一的模型。其中,146个模型的后验概率大于0.01%,概率总和达99.5%;58个模型的后验概率大于0.1%,概率总和为96.5%。表2是按后验概率大小排序得到的前10个模型及各变量的后验包含概率。其中,“1/0”分别表示模型包含/不包含该变量,最后一行表示模型后验概率。这10个模型的后验概率显著异于其先验概率(2-15),概率总和超过76%,其中排名第1的模型后验概率为0.405。Tab. 2
表2
表2空间OD模型中后验概率最大的10个模型
Tab. 2
| 变量 | 后验概率模型 | 后验包含概率 | |||||||||
|---|---|---|---|---|---|---|---|---|---|---|---|
| 10 | 9 | 8 | 7 | 6 | 5 | 4 | 3 | 2 | 1 | ||
| O_POP | 1 | 1 | 1 | 1 | 1 | 1 | 1 | 1 | 1 | 1 | 0.924 |
| O_GDP | 1 | 1 | 1 | 1 | 1 | 1 | 1 | 1 | 1 | 1 | 0.925 |
| O_Wage | 0 | 1 | 0 | 0 | 0 | 0 | 0 | 1 | 1 | 0 | 0.456 |
| O_Urban | 1 | 1 | 1 | 0 | 1 | 1 | 1 | 1 | 0 | 1 | 0.797 |
| O_HB | 1 | 0 | 1 | 0 | 1 | 1 | 0 | 1 | 0 | 1 | 0.696 |
| O_Edu | 1 | 1 | 0 | 1 | 0 | 0 | 1 | 0 | 1 | 0 | 0.459 |
| O_Flow | 0 | 0 | 0 | 0 | 0 | 0 | 0 | 0 | 0 | 0 | 0.238 |
| D_POP | 0 | 0 | 1 | 0 | 1 | 1 | 0 | 0 | 0 | 0 | 0.459 |
| D_GDP | 0 | 0 | 0 | 0 | 1 | 1 | 0 | 0 | 0 | 0 | 0.446 |
| D_Wage | 1 | 1 | 1 | 1 | 1 | 0 | 1 | 1 | 1 | 1 | 0.839 |
| D_Urban | 1 | 1 | 1 | 1 | 1 | 0 | 1 | 1 | 1 | 1 | 0.824 |
| D_HB | 0 | 0 | 0 | 0 | 0 | 0 | 0 | 0 | 0 | 0 | 0.205 |
| D_Edu | 1 | 1 | 1 | 1 | 1 | 1 | 1 | 1 | 1 | 1 | 0.923 |
| D_Flow | 1 | 1 | 1 | 1 | 1 | 1 | 1 | 1 | 1 | 1 | 0.962 |
| Distance | 1 | 1 | 1 | 1 | 1 | 1 | 1 | 1 | 1 | 1 | 0.926 |
| 后验概率 | 0.017 | 0.019 | 0.019 | 0.019 | 0.026 | 0.049 | 0.058 | 0.063 | 0.095 | 0.405 | |
新窗口打开|下载CSV
由表2可知:① 不同变量在模型空间中出现的后验包含概率大小不同。其中,O_POP、O_GDP、D_Edu、D_Flow和Distance等变量的包含概率均超过90%,说明迁出地人口与GDP、迁入地教育水平与迁移存量以及时间距离对于省际迁移的影响不可忽视;O_Flow、D_HB等变量的包含概率在25%以下,表明在研究时段内迁出地存量和迁入地医疗卫生等因素对省际迁移决策的影响较小。② 同一种类型的迁出地变量和迁入地变量发挥着不同的作用。例如,对于迁出地而言,人口规模和地区GDP具有较好的解释力;而对于迁入地,地区教育水平和迁入存量则更为关键,反映了“人往高处走”的迁移规律。这些因素在迁移中到底发挥多大作用,需要进一步计算各自的迁出地效应、迁入地效应和网络效应等。
3.3 系数估计分析
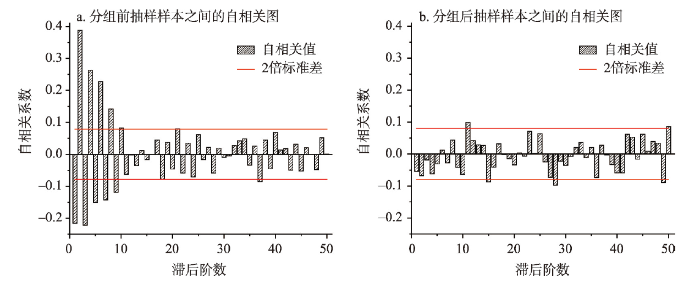
以后验概率大于0.1%的58个模型(概率总和超过96%)代表整个模型空间。经MCMC抽样得到的样本具有一定的自相关性。为了确保抽样的有效性,降低样本之间的自相关程度,需要对抽样进行分组,使得不同组之间的均值近似独立[52]。图1a表明,滞后30阶以上的样本间的自相关系数可忽略不计。为保险起见,将抽样次数设定为60000,并舍弃前10000次,将每批次抽样间隔设为100,则每个模型可得到完全独立的500个系数抽样记录。图1b表明分批次抽样后,样本之间的自相关系数几乎都在2个标准差范围内波动,极大克服了抽样间的自相关性,模型系数估计更加有效。图1
 新窗口打开|下载原图ZIP|生成PPT
图1分组前后抽样样本之间的自相关图
Fig. 1Autocorrelation coefficients before and after sampling in batches
经BMA之后,模型系数估计的均值和90%可信区间(Credible Interval)如表3所示。从表3可以看出,人口迁移明显受到周边迁移环境的影响,且不能忽视(ρ显著为正)。迁移主方向是从农业剩余劳动力大省迁往就业机会和劳动力市场较大的省份,人口增长对迁出影响较大。区域GDP或工资水平增长则会降低人口迁移增幅,符合预期。对迁出地而言,GDP的影响要大于工资水平;而对迁入地而言,工资变化影响更大些。城镇化率和医疗卫生水平提升有利于人口外迁;不同的是,城镇化率较高地区会抑制外来人口增长幅度。高素质人才增长将促进人口流动,相比较而言,对迁入地的影响更大。迁移存量的影响主要表现在迁入地。
Tab. 3
表3
表3BMA加权后的空间OD模型各系数估计的后验均值与90%可信区间
Tab. 3
| 变量 | Lower 5% | 均值 | Upper 95% | 变量 | Lower 5% | 均值 | Upper 95% |
|---|---|---|---|---|---|---|---|
| Const | 3.329 | 3.664 | 4.041 | Distance | -0.311 | -0.283 | -0.254 |
| O_POP | 1.057 | 1.165 | 1.282 | D_POP | 0.099 | 0.111 | 0.122 |
| O_GDP | -0.887 | -0.759 | -0.648 | D_GDP | -0.108 | -0.095 | -0.080 |
| O_Wage | -0.029 | -0.019 | -0.010 | D_Wage | -0.300 | -0.274 | -0.246 |
| O_Urban | 0.050 | 0.106 | 0.168 | D_Urban | -0.392 | -0.352 | -0.308 |
| O_HB | 0.091 | 0.113 | 0.139 | D_HB | 0.000 | 0.001 | 0.003 |
| O_Edu | 0.064 | 0.074 | 0.085 | D_Edu | 0.363 | 0.404 | 0.449 |
| O_Flow | -0.005 | -0.003 | -0.001 | D_Flow | 0.609 | 0.639 | 0.671 |
| ρ | 0.579 | 0.616 | 0.652 |
新窗口打开|下载CSV
由于存在空间依赖关系,要想真正量化区域经济社会要素变化对迁移流变动产生的影响,需要将整个人口迁移网络联系起来。
3.4 效应估计分析
根据模型后验概率与系数估计结果,按照公式(7)~(10)分别计算各变量的总体效应、迁出地效应、迁入地效应和网络效应(表4)。同时对单一模型(即解释变量100%出现在空间OD模型中)也进行了效应估计,作为比较的基准(表5)。考虑到区域经济社会因素的变化同时对迁出流和迁入流产生影响,下面不再区分迁出地和迁入地变量。总体上,除了迁移存量外,单一模型中变量的总体效应(绝对值)均大于BMA模型,这意味着若忽视变量选择中的不确定性,会高估区域经济社会因素对省际人口迁移的影响。更进一步,那些被高估的变量主要表现在迁入地效应和网络效应。经BMA后,工资水平、城镇化率、医疗状况、教育水平和迁出存量等的迁出地效应由不显著变为显著,表明这些因素共同对省际迁移产生了实质性影响。Tab. 4
表4
表4BMA加权后空间OD模型中各解释变量的效应分布
Tab. 4
| 变量 | 总体效应 | 迁出地效应 | 迁入地效应 | 网络效应 | |||||||||||
|---|---|---|---|---|---|---|---|---|---|---|---|---|---|---|---|
| Lower 5% | 均值 | Upper 95% | Lower 5% | 均值 | Upper 95% | Lower 5% | 均值 | Upper 95% | Lower 5% | 均值 | Upper 95% | ||||
| POP | 2.281 | 3.254 | 3.809 | 1.511 | 1.712 | 1.909 | 0.137 | 0.156 | 0.175 | 1.128 | 1.386 | 1.729 | |||
| GDP | -2.611 | -2.172 | -1.775 | -1.307 | -1.116 | -0.917 | -0.144 | -0.125 | -0.107 | -1.201 | -0.931 | -0.737 | |||
| Wage | -0.870 | -0.732 | -0.621 | -0.056 | -0.040 | -0.025 | -0.322 | -0.291 | -0.257 | -0.520 | -0.402 | -0.325 | |||
| Urban | -0.847 | -0.609 | -0.405 | 0.051 | 0.141 | 0.231 | -0.428 | -0.371 | -0.315 | -0.523 | -0.379 | -0.272 | |||
| HB | 0.224 | 0.295 | 0.386 | 0.127 | 0.166 | 0.206 | 0.003 | 0.005 | 0.008 | 0.087 | 0.124 | 0.175 | |||
| Edu | 1.023 | 1.191 | 1.395 | 0.106 | 0.125 | 0.144 | 0.378 | 0.430 | 0.482 | 0.521 | 0.635 | 0.793 | |||
| Flow | 1.392 | 1.592 | 1.841 | 0.018 | 0.025 | 0.032 | 0.631 | 0.680 | 0.726 | 0.732 | 0.887 | 1.093 | |||
新窗口打开|下载CSV
Tab. 5
表5
表5全要素空间OD模型(单一模型)各变量的效应分布
Tab. 5
| 变量 | 总体效应 | 迁出地效应 | 迁入地效应 | 网络效应 | |||||||||||
|---|---|---|---|---|---|---|---|---|---|---|---|---|---|---|---|
| Lower 5% | 均值 | Upper 95% | Lower 5% | 均值 | Upper 95% | Lower 5% | 均值 | Upper 95% | Lower 5% | 均值 | Upper 95% | ||||
| POP | 2.862 | 4.609 | 6.832 | 1.270 | 2.012 | 2.842 | 0.178 | 0.519 | 0.863 | 1.061 | 2.077 | 3.566 | |||
| GDP | -4.281 | -2.764 | -1.456 | -1.682 | -1.090 | -0.546 | -0.764 | -0.398 | -0.089 | -2.270 | -1.275 | -0.618 | |||
| Wage | -5.202 | -3.267 | -1.628 | -1.060 | -0.496 | 0.060 | -1.539 | -1.064 | -0.563 | -3.037 | -1.707 | -0.901 | |||
| Urban | -4.327 | -1.776 | 0.282 | -0.597 | 0.314 | 1.273 | -1.572 | -1.013 | -0.474 | -2.400 | -1.077 | -0.045 | |||
| HB | -0.145 | 1.383 | 3.118 | -0.188 | 0.577 | 1.269 | -0.243 | 0.176 | 0.571 | -0.090 | 0.630 | 1.536 | |||
| Edu | 1.680 | 3.431 | 5.558 | -0.067 | 0.596 | 1.258 | 0.617 | 1.060 | 1.495 | 0.834 | 1.775 | 3.072 | |||
| Flow | 0.764 | 1.300 | 1.918 | -0.245 | -0.020 | 0.183 | 0.466 | 0.585 | 0.710 | 0.429 | 0.735 | 1.154 | |||
新窗口打开|下载CSV
3.4.1 总体效应 人口规模的总体效应在所有变量中居首位,表明人口压力是省际迁移活动的首要因素。平均地,若某地区人口规模相对增长1%,从长期来看,整个省际迁移流量的增幅将达到3.254%,其中迁出流增幅1.712%,迁入流增幅0.156%,其他周边区域迁移流增幅1.386%。这意味着地区人口增长不仅会产生更多迁出流,也会通过集聚效应吸引更多外来人口,与现有研究结果相一致[53,54]。不同的是,GDP、工资水平和城镇化率的提升对整个迁移网络的增幅具有负向作用,这与2008年金融危机以来中国正处于经济结构调整和产业转型期有较大关系[41]。迁移存量对于整个迁移网络的发展不可小觑,存量越多社会网络关系越复杂,人们获取就业、居住等的信息渠道越畅通,越能够有效降低迁移成本与风险[55]。地区教育水平居第4位,是影响省际迁移的重要因素。平均而言,若某地区大专以上人口数量相对增长1%,则整个省际迁移流量增幅为1.191%,其中迁往教育科技水平相对发达地区是主流方向。医疗卫生水平反映了地区公共服务的供给优势,其提升在一定程度上会促进人口迁移。
3.4.2 迁出地效应 区域要素变化不仅直接改变自身迁移流,还通过周边地区进一步反馈到自身区域。通过比较各迁出地变量的系数(表3)与迁出地效应(表4),可以发现各个变量的反馈效应对迁出地效应的贡献。总体上,人口规模对省际迁出的影响最大。若当前某区域人口规模相对增长1%,则跨省迁出人口数量平均增幅长期将达1.712%。而地区GDP则有所不同,若某区域GDP相对增长1%,其跨省迁出人口增幅平均降低1.116%。地区经济发展将会降低本地人口外迁增长速度,表明生存和发展仍是人口迁移的主因。值得注意的是,地区城镇职工工资增长也会降低人口跨省外迁的增速,但作用相对有限。随着区域经济发展和城镇化水平的提高,整个地区教育水平和医疗状况不断改善,增强了人们对外界环境的适应能力,进一步促进人口外迁[56,57,58]。类似地,迁出存量对跨省迁移的影响也相对较小,但由单一模型中的不显著变得显著。
3.4.3 迁入地效应 通过比较迁入地变量的系数(表3)和迁入地效应(表4),可发现变量的反馈作用对迁入地效应的贡献。此时,迁移存量和教育水平成为影响省际迁移的重要因素。平均地,若某地区迁入存量相对增长1%,从长期来看,外来跨省迁入人口增幅将达0.68%;若某地区大专以上人口相对提高一个百分点,则跨省迁入人口长期平均增幅为0.43%。同时,人口规模产生的集聚作用也会吸引外来人口,但相对于迁移存量和人口质量的提升,人口规模的影响相对较小。新古典主义经济理论认为,地区经济发展较好、工资水平较高地区更容易吸引移民,其城镇化水平也较高[59,60]。然而,在中国经济和人口“新常态”背景下,经济结构转型和优化升级、经济增长明显放缓以及劳动年龄人口减少等,使得GDP、工资水平和城镇化发展在不同程度上降低了当前及未来省际迁移的增长幅度,表现出明显不同于过去的发展趋势[41, 61]。
3.4.4 网络效应 最新的人口迁移理论认为,网络效应是形成大规模人口迁移的主要原因之一,特别是在迁移网络形成之前[62,63]。表4表明,各变量的网络效应占总体效应的40%以上,甚至超过各自的迁出地效应或迁入地效应,进一步证实了网络效应在省际人口迁移过程中扮演着非常重要的角色,且不容忽视。以人口规模为例,若某地区人口相对增幅1%,除了本地区的迁出流和迁入流相应持续增长外,其他周边区域跨省迁移量的平均增幅长期将达到1.386%,远大于对本地迁入流的影响。而教育水平的网络溢出效应甚至超过了其迁入地效应和迁出地效应之和。若地区大专以上人口数量相对增长1%,则周边跨省迁移人口的平均增幅长期将达0.635%,充分反映了高素质人才在省际迁移中的关键作用。需要指出的是,网络效应和其他效应一样,均是一种长期效应,在区域社会经济因素发生变化后,迁移网络系统随着时间的推移而达到再平衡状态时对人口迁移产生的累积综合性结果。
4 结论与讨论
本文从变量选择的不确定性入手,基于贝叶斯模型平均方法(BMA),对经济和人口“新常态”背景下的2010—2015年中国省际人口迁移影响因素和动力机制进行了定量分析。在综合考虑迁出地和迁入地空间依赖关系的基础上,利用马尔可夫链—蒙特卡罗模型综合方法(MC3)对区域经济社会要素(人口规模、GDP、工资水平、城镇化率、医疗水平、教育水平和迁移存量)以及距离进行概率分析,对后验概率大于0.1%的58个模型进行加权平均,基于系数估计结果计算变量的迁出地效应、迁入地效应和网络效应等,得到以下结论:(1)当前中国省际人口迁移主要由迁出地效应和网络效应推动,迁入地效应为辅。BMA分析结果表明,迁出地人口和GDP的变量后验包含概率在90%以上,其迁出地效应和网络效应(绝对值)远大于其相应的迁入地效应;迁入地教育水平和迁移存量的变量后验包含概率也大于90%,其迁入地效应虽居各变量前列,但仍低于其相应的网络效应。这是普通重力模型所无法解释的,也为中国供给侧结构性改革提供新的证据。
(2)地区人口数量、质量以及迁移存量在省际迁移中发挥关键作用。当前人口规模变动产生的影响最为显著,各地区人口势能差为大规模迁移活动提供了潜在动力。同时,人口质量提升也注入不竭动力,高素质人才集聚地区经济发展和社会综合实力较强,更能吸引外来人口。通过亲属、朋友等社会关系网络,迁移个体能够获得相对准确信息,减少迁移成本。
(3)在经济发展“新常态”背景下,GDP和工资等变量的相对增速总体上对省际迁移的增幅产生负向效应。随着区域协调发展战略的深入实施和东部沿海地区经济结构性减速,劳动密集型产业向中西部有序转移,省际迁移增速呈现放缓迹象。然而,新型城镇化不仅有赖于人口迁移,在迁出地通过政府公共产品的投入和消费质量升级进一步促进迁移活动。
(4)区域经济社会因素通过空间结构对整个迁移网络起到了共同演化的作用。区域要素变化对从该区域出发或抵达的人口迁移流产生直接影响,进一步通过空间结构关系影响周边地区,对其产生网络溢出效应,同时该区域反过来又作为周边地区的邻居,对区域自身迁移流产生一定的反馈作用。经BMA后,区域各要素的效应估计皆显著,表明对人口迁移网络的发展与演化产生共同的影响,这是不考虑模型不确定性情形下无法观测到的。
本文利用BMA方法,对人口迁移建模中变量选择方面的不确定性问题进行了讨论,一定程度上提高了模型估计结果的稳健性和可靠性。然而,本文仍存在以下问题有待研究:① 变量选择需要进一步优化。本文在解释变量选择时主要基于现有文献,而当前对2010年以来省际迁移影响因素和动力机制方面的研究相对较少,因此在变量选择方面仍存在一定的局限性;② 其他模型不确定性问题。目前采用固定的网络空间结构(Wo+Wd)和空间自回归模型(SAR)在重力模型中的扩展,仅对变量选择中的不确定性进行了考虑。其他网络权重矩阵设定方式以及空间杜宾模型、空间误差项模型等扩展形式,都有待于进一步设定和检验;③ 时间结构的设定。空间OD模型本质上是一个横截面模型,不能显式表达时间维度。因此,模型估计结果是区域要素变化达到新的平衡状态时对系统产生的累积影响,是一个长期均衡值。今后将进一步考虑时空耦合关系[64];④ 不同空间尺度的应用。省际人口迁移在国家和区域人口再分布中具有重要意义。然而,相对于省内迁移,其数量和规模均较小,地域空间关系对于省际迁移的影响也会小于地市级或县级尺度人口迁移。下一步将会考虑省内人口迁移,进一步分析更细空间尺度和邻接关系对人口迁移的影响。
参考文献 原文顺序
文献年度倒序
文中引用次数倒序
被引期刊影响因子
[本文引用: 1]
[本文引用: 1]
[本文引用: 1]
[本文引用: 1]
[本文引用: 1]
[本文引用: 1]
[本文引用: 1]
[本文引用: 1]
DOI:10.11821/dlxb201808001 [本文引用: 1]

Since 2010, big data has played a significant role in various fields of science, engineering and society. The paper introduces the concepts of geographic big-data, the fourth paradigm and nonlinear complex geographic system, and discusses interactive relationships of these concepts. It is proposed that geographic big-data and the fourth paradigm would become a new opportunity to research on geography complexity. Then the paper discusses how to use the methods of geographic big-data and complexity science to examine geography complexity. For example, based on big-data, a series of indicators of statistical physics fields could be constructed to describe the complex nonlinear characteristics of the real geographic world. Deep learning, complex network and multi-agent methods can be used to model and simulate the complex nonlinear geographic systems. These methods are important for a better understanding of the complexity of geographic phenomena and processes, as well as the analysis, simulation, inversion and prediction of complex geographic systems. Finally, the paper highlights that the combination of geographic big-data and complexity science would be the mainstream scientific method of geography in the 21st century.
[本文引用: 1]
[本文引用: 1]
[本文引用: 1]
[本文引用: 1]
[本文引用: 1]
DOI:10.1002/psp.663URL [本文引用: 1]
DOI:10.1080/00324728.2015.1122826URL [本文引用: 1]
DOI:10.1111/jors.2008.48.issue-5URL [本文引用: 1]
[本文引用: 1]
DOI:10.1111/jors.12114URL [本文引用: 3]
[本文引用: 1]
[本文引用: 1]
DOI:10.11821/dlxb201602003 [本文引用: 1]
Population migration flows between different regions are related to not only the origin- and destination-specific characteristics, but also to the migration flows to and from neighborhoods. Intuitively, changes in the characteristics of a single region will impact both inflows and outflows to and from other regions. In order to explore the spatial interaction mechanism driving the increasing population migration in China, this paper builds the spatial OD model of interprovincial migration flows based on the sixth national population census data and related social-economic data. The findings are as follows: (1) Migration flows show significant autocorrelation effects among origin and destination regions, which means that the migration behavior of migrants in some region is influenced by that of migrants in other places. The positive effects indicate the outflows from an origin or the inflows to a destination tend to cluster in a similar way. Simultaneously, the negative effects suggest the flows from the neighborhood of an origin to the neighborhood of a destination tend to disperse in a dissimilar way. (2) Multilateral effects of the regional economic and social factors through the spatial network system lead to the clustering migration flows across interrelated regions. Distance decay effect plays the most influential force in shaping the patterns of migration flows among all the factors and the negative spillover effect further aggravates the friction of distance. As for destinations, the influence of wage level and migration stocks is beyond that of GDP and the positive spillover effects of these factors enhance the attraction of neighborhood regions. The spillover effects of unemployment rate and college enrollment of higher education are significantly negative while the effect of population in a destination is not significant. As for origins, population and migration stocks lead to positive spillover effects on the neighborhoods while the effects of other factors are negative. (3) Changes in the regional characteristics will potentially lead to a series of events to the whole migration system, and the flows to and from the center of oscillation and its neighborhoods vibrate greatly compared with other regions. The simulation results of 5% GDP increase in Jiangsu province indicate that the outflows to other regions decrease while the inflows from all others increase to some different extent. Comparatively, the influence on the flows to and from the regions neighboring Jiangsu is significant while that of remote regions is much less, which cannot be explained by the traditional gravity model.
[本文引用: 1]
[本文引用: 1]
[本文引用: 1]
DOI:10.11821/dlxb201902002 [本文引用: 1]
According to previous studies, not only does the conditional gravity model based on ordinary least squares often bring about poor fitting of migration flows in reality, but also there exists overdispersion in the extended Poisson gravity model. Simultaneously, network autocorrelation usually exists in population migration data (e.g., the spatial interaction among migration flows). The problems mentioned above result in biased estimation. In order to capture network autocorrelation and deal with the issue of overdispersion, we build an eigenvector spatial filtering negative binomial gravity model (ESF NBGM) based on the data of 1% national population sample survey in 2015, to analyze the driving mechanism of interprovincial population migration flows in China. The results are as follows: (1) Positive spatial spillover effect exists in interprovincial population migration flows, and ESF can capture network autocorrelation in data, so as to reduce the estimated deviation of the model. Furthermore, eigenvectors ranking top 1.4% can properly interpret the spatial pattern of high network autocorrelation in data. (2) There exists overdispersion in China's interprovincial migration flows. Considering this problem, a negative binomial regression model is more suitable for the estimation of driving mechanism for population migration, together with statistical enhancement. (3) Network autocorrelation leads to overestimation of distance variables and underestimation of non-distance variables. The results of the improved model reveal that: chief factors the affect driving mechanism are regional population characters, social network, economic development and education level. Meanwhile, living environment and road network gradually become one of the most crucial pulling factors that influence migration flows. (4) Compared to previous studies, social network (i.e. migration stock) plays a more significant role in population migration flows, while the impact of spatial distance keeps weakening.
[本文引用: 1]
[本文引用: 1]
[本文引用: 1]
[本文引用: 1]
[本文引用: 1]
http://english.www.gov.cn/policies/latest_releases/2017/01/25/content_281475551306587.htm, 2017-01-25.
URL [本文引用: 1]
http://www.gov.cn/zhengce/content/2017-01/25/content_5163309.htm, 2017-01-25.]
URL [本文引用: 1]
[本文引用: 1]
[本文引用: 1]
DOI:10.1080/01621459.1995.10476635URL [本文引用: 1]
DOI:10.2307/1403615URL [本文引用: 2]
DOI:10.1002/jae.623URL [本文引用: 1]
DOI:10.1080/0003684042000245534URL [本文引用: 1]
[本文引用: 1]
DOI:10.1016/j.econmod.2011.08.007URL [本文引用: 1]
DOI:10.1016/j.jimonfin.2013.08.021URL [本文引用: 1]
DOI:10.1111/gean.2007.39.issue-3URL [本文引用: 1]
[本文引用: 2]
http://english.www.gov.cn/policies/latestreleases/202004/10/content_WS5e8faa09c6d0c201c2cc0922.html, 2020-04-10.
URL [本文引用: 1]
http://www.gov.cn/zhengce/2020-04/09/content_5500622.html, 2020-04-09.]
URL [本文引用: 1]
[本文引用: 1]
[本文引用: 1]
[本文引用: 1]
[本文引用: 1]
[本文引用: 1]
[本文引用: 1]
[本文引用: 1]
[本文引用: 1]
[本文引用: 3]
北京: 中国人口出版社,
[本文引用: 3]
[本文引用: 1]
[本文引用: 1]
[本文引用: 1]
[本文引用: 1]
[本文引用: 1]
[本文引用: 1]
[本文引用: 1]
[本文引用: 1]
[本文引用: 1]
[本文引用: 1]
[本文引用: 1]
[本文引用: 1]
[本文引用: 1]
[本文引用: 1]
[本文引用: 1]
[本文引用: 1]
[本文引用: 1]
[本文引用: 1]
[本文引用: 1]
[本文引用: 1]
DOI:10.1080/00343404.2013.812783URL [本文引用: 1]
[本文引用: 1]
DOI:10.2747/1538-7216.46.3.165URL [本文引用: 1]
DOI:10.1093/qje/qjs050URL [本文引用: 1]
DOI:10.1016/j.jebo.2013.12.011URL [本文引用: 1]
[本文引用: 1]
DOI:10.1086/258726URL [本文引用: 1]
[本文引用: 1]
[本文引用: 1]
[本文引用: 1]
DOI:10.1080/13691830801961597URL [本文引用: 1]
DOI:10.1080/1369183X.2010.489361URL [本文引用: 1]
[本文引用: 1]
[本文引用: 1]
