 ,2,3, 傅伯杰2,4, 尹礼唱2,5, 于丹丹1
The effects of vegetation coverage changes on ecosystem service and their threshold in the Loess Plateau
ZHANG Kun1, LYU Yihe,2,3, FU Bojie2,4, YIN Lichang2,5, YU Dandan1通讯作者:
收稿日期:2019-03-22修回日期:2020-02-7网络出版日期:2020-05-25
| 基金资助: |
Received:2019-03-22Revised:2020-02-7Online:2020-05-25
| Fund supported: |
作者简介 About authors
张琨(1988-),男,山东济南人,博士,助理研究员,主要从事生态恢复与生态系统服务研究E-mail:zhangkun@nies.org。

摘要
关键词:
Abstract
Keywords:
PDF (3608KB)元数据多维度评价相关文章导出EndNote|Ris|Bibtex收藏本文
本文引用格式
张琨, 吕一河, 傅伯杰, 尹礼唱, 于丹丹. 黄土高原植被覆盖变化对生态系统服务影响及其阈值. 地理学报[J], 2020, 75(5): 949-960 doi:10.11821/dlxb202005005
ZHANG Kun.
1 引言
生态系统服务是人类从生态系统中获取的收益,包括水源涵养、土壤保持、碳固定、生物多样性维护等多种类型。生态系统服务是生态系统功能向人类福祉转化的媒介[1,2],也是人类生存和发展的必要条件。目前,生态系统服务已经成为学术界和管理者关注的焦点。生物多样性公约缔约方大会在《2011—2020年生物多样性战略计划》提出,需要对产生重要服务的生态系统进行保护和恢复(目标14)。2012年生物多样性和生态系统服务政府间科学政策平台(Intergovernmental Platform on Biodiversity and Ecosystem Services, IPBES)成立,整合学术界和政府部门的多重资源并聚焦于生态系统服务相关研究。近年来,中国政府以提升生态系统服务为导向全面实施生态保护红线政策,表明生态系统服务已被纳入国家层面的生态管理目标之中。植被是影响生态系统服务的重要因素,二者的关系是学术界的研究热点[3]。在生态管理实践中,管理者倾向于通过改善植被达到提升生态系统服务的目标。然而,生态系统服务对植被变化的响应是一个复杂的过程。在植被变化影响下,不同服务类型变化趋势各异,不同类型间存在权衡或协同关系,使得区域生态系统服务整体呈现高度非线性的变化趋势。明确此趋势能够为生态环境的科学管理提供支持。
阈值效应是生态系统服务非线性变化的重要特征。阈值状态下,影响因素的小幅变化可能引发生态系统服务出现明显改变。明确阈值存在与否并进一步进行识别是科学研究和管理实践的共同需求。目前,学术界已围绕该问题进行探索[4]。Foudi等以马德里为研究区,分析绿色屋顶覆盖度对城市生态系统服务的影响,并强调该影响的非线性特征和阈值效应[5]。Peng等整合土壤保持等4类生态系统服务获取总体生态系统服务(Total Ecosystem Service),分析城市化因素对生态系统服务的影响,定量识别人口城市化和经济城市化的影响阈值[6]。此外,Zhang等提出应当统筹考虑生态阈值和经济阈值、Collins等所构建的“压力—脉冲动力学”框架(Press-Pulse Dynamics, PPD)等均为阈值效应分析提供了有益思路[7,8]。具体到植被影响,已有研究表明,植被覆盖对生态系统服务的影响同样具有阈值效应,如Gao等发现,当植被覆盖低于特定阈值时,土壤保持、肥力维持等生态系统服务会明显减弱[9];Cao等进一步指出,植被影响的阈值在人工生态恢复过程中同样存在[10]。然而,目前涉及植被影响阈值的研究多在样方尺度开展,在区域尺度进行分析的研究较少,难以满足大尺度生态管理的决策需求。
黄土高原是中国“两屏三带”生态安全格局的重要组成部分,对国家生态安全有重要影响。同时,该地区也是生态环境高度脆弱的农业区,水土流失严重,是世界土壤侵蚀最严重的地区之一[11]。1999年中国政府启动退耕还林工程,旨在通过增加林地和草地来提升生态环境质量。黄土高原是退耕还林工程的重点区和示范区。多项研究显示,黄土高原的植被覆盖已得到明显改善,多项生态系统服务相应提升[12,13,14]。然而也有****持不同意见,质疑造林活动对生态系统的长期影响[15,16,17,18]。另一方面,黄土高原的造林活动需要以大量人力物力投入为前提,需要对恢复目标和进程进行科学规划。因此,有必要评估黄土高原植被变化对生态系统服务的影响,定量分析植被变化影响的阈值,为区域生态管理提供支撑。
本文以黄土高原为研究区,综合土壤保持服务、产水服务、碳固定服务表征区域生态系统服务整体水平。将研究区植被覆盖与生态系统服务进行空间分析,确定植被变化对生态系统服务的影响,基于此对植被变化影响的阈值效应进行分析。本研究的结果能够为黄土高原生态环境的科学规划及合理恢复提供重要参考。
2 研究方法与数据来源
2.1 研究区概况
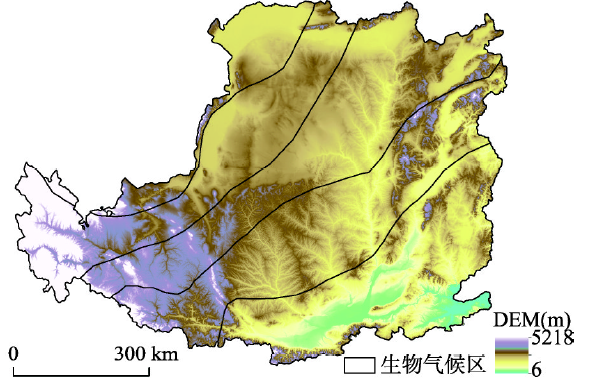
黄土高原位于黄河中游流域,处于33°43'N~41°16'N、100°54'E~114°33'E范围内,总面积约为62.6 万km2(图1)。该区域具有典型的黄土地貌,地形破碎,沟壑纵横[18]。气候以半湿润和半干旱气候为主,受季风影响明显[19]。黄土高原在行政区划上涉及山西、陕西等7个省(自治区)、44个地区(市、州、盟)、339个县(旗),总人口约1.08亿。高度聚集的人口和强烈的人类活动使得该区域生态环境面临沉重压力。黄土高原是世界上水土流失现象最为严重的区域之一,年均土壤侵蚀速率可达5000~10000 t/km2,年最大侵蚀速率则高达20000~30000 t/km2,土壤侵蚀主要发生在坡度为8°~35°的区域[20]。该区域还是黄河流域泥沙的最主要来源,黄河近90%入河泥沙来自于此[21]。图1
 新窗口打开|下载原图ZIP|生成PPT
图1黄土高原区域概况及生物气候区分区
Fig. 1The general situation of the Loess Plateau and the division of the bioclimatic zones
根据黄土高原的植被及气候特征,将其自南向北划分为5个生物气候区(图1),即林地区、林地—草地区、草地区、草地—沙漠区以及沙漠区[22]。
2.2 数据源
植被数据主要为归一化植被指数(Normalized Difference Vegetation Index, NDVI),采用MODIS-NDVI产品,空间分辨率250 m,时间分辨率16 d;气象数据来自中国气象科学数据共享网(2.3 分析方法
2.3.1 植被覆盖变化分析(1)评价指标
采用植被覆盖度(Fractional Vegetation Cover, FVC)作为主要的植被指标。该指标能够有效降低无植被区域光谱特征带来的不确定性,提升分析精度,并得到广泛应用[23,24,25]。FVC是采用像元二分法对NDVI数据进行处理所得[26,27],方法如下:
式中:NDVI为MODIS-NDVI数据产品经Savitzky-Golay滤波处理后结果[28];NDVIsoil和NDVIveg分别为纯裸土和纯植被对应的NDVI值,由土地利用数据结合野外实测数据确定。
(2)变化趋势分析
线性回归是广为认可的趋势变化分析方法[29,30]。本文采用线性回归方法对FVC变化情况进行逐像元定量分析,具体方法如下:
式中:y为像元对应FVC;a为线性趋势系数;t为时间序列;b为截距;ε为随机误差。当a > 0时,表明植被覆盖度呈恢复趋势;反之,则表明其呈退化趋势。显著性检验置信度为95%。该方法亦用于生态系统服务变化趋势分析。
2.3.2 生态系统服务变化分析
(1)土壤保持服务
土壤保持服务用土壤保持量作为指标。土壤保持量为土地在没有植被覆盖和人类管理条件下的潜在土壤侵蚀量与实际土壤侵蚀量之差[31]。土壤保持量基于USLE模型计算:
式中:A、Ap和Av分别表示土壤保持量、潜在土壤侵蚀和实际土壤侵蚀;R表示降水侵蚀因子;K表示土壤侵蚀因子;L表示坡长因子;S表示坡度因子;C表示植被覆盖因子;P表示管理因子。涉及土地利用数据时,2000—2004年采用2000年数据,2005—2009年采用2005年数据,以此类推。各因子的计算方法详见参考文献[32,33,34,35]。
(2)产水服务
产水服务采用以下模型计算:
式中:W为产水(mm);P为降水(mm);ET为蒸散(mm)。
由于产水服务的分析在年尺度上开展,所以将蒸散定义为各月份实际蒸散量之和。各月份蒸散的计算是通过Zhang等提出的经验模型来实现[36],如下所示:
式中:ω因子为植物水利用系数,无量纲,该因子取值在林地为2.0,在灌木为1.0,在草地为0.5,在耕地为0.5,在建设用地和未利用地均为0.1[36,37];PET因子为潜在蒸散(mm),基于Hamon等设计的模型来计算获取[38,39]。
(3)碳固定服务
选取植被净初级生产力(Net Primary Productivity, NPP)为表征碳固定服务指标[22]。NPP计算基于CASA(Carnegie Ames-Stanford Approach)模型实现,该模型可以表示为:
式中:NPP为像元x于t时刻的净初级生产力,单位为gC/m2·a;APAR为光合有效辐射,单位为MJ/m2·a,通过太阳总辐射量(SOL)、光合有效辐射吸收比例(FPAR)估算获取;ε为光合有效辐射转化为有机碳的效率,单位为gC/MJ2,通过最大光能利用率(εmax,本文取0.389 gC/MJ2)、温度胁迫(Tε)以及水分胁迫(Wε)估算获取。
(4)生态系统服务综合指数
对土壤保持服务、产水服务和碳固定服务进行标准化并累加,获取生态系统服务综合指数(以下简称综合指数),表征区域生态系统服务的总体水平。将此处理应用于历年数据,获取综合指数时间序列。具体处理方法如下:
式中:ESb为生态系统服务的标准化结果;ES为生态系统服务初始值;ESmax为生态系统服务最大值;ESmin为生态系统服务最小值。为避免异常值的干扰,将ESmax与ESmin分别取95%和5%分位数。CIES为综合指数;ESbi为第i类生态系统服务的标准化结果;n为3。
(5)弹性系数
通过分析综合指数与植被覆盖度的弹性系数对植被覆盖影响的阈值进行识别。弹性系数指植被覆盖度每增加1单位带来的综合指数变化,表征植被覆盖影响的强度和效率。弹性系数通过对植被覆盖度与综合指数的拟合函数进行求导获取。设CIES = f(FVC)为综合指数和植被覆盖度之间的表达函数,弹性系数EC为:
3 结果分析
3.1 植被覆盖与生态系统服务时空变化
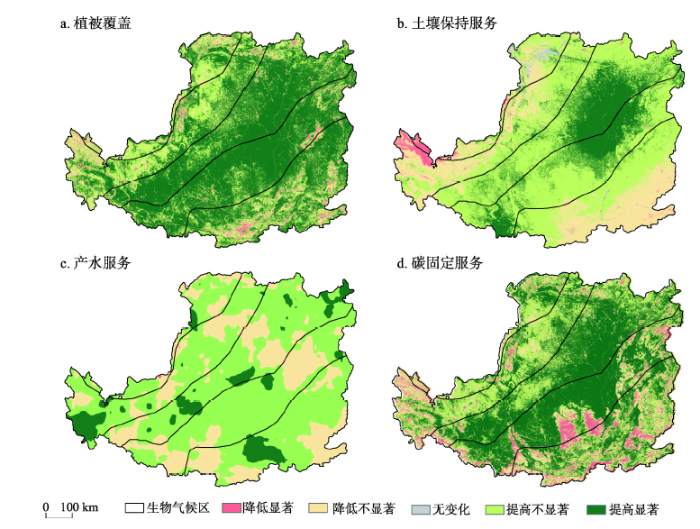
2000—2015年黄土高原植被覆盖显著恢复(图2a)。结果显示,黄土高原植被未发生显著变化的区域比例为35.8%,主要位于沙漠区和草地—沙漠区的中部及西部;植被显著退化区域约占2.2%;62%的区域植被呈现显著恢复态势,草地区和林地—草地区是植被覆盖度增加最明显的区域。总体来看,黄土高原植被表现为明显的净增加态势。图2
 新窗口打开|下载原图ZIP|生成PPT
图22000—2015年黄土高原植被覆盖度及各类生态服务变化
Fig. 2The changes of vegetation coverage and ecosystem services in the Loess Plateau in 2000-2015
2000—2015年土壤保持服务、产水服务及碳固定服务变化趋势如图2b~图2d所示。根据空间分析结果,就土壤保持服务而言,2000年以来黄土高原土壤保持服务总体得到提升(图2b)。土壤保持量在大部分地区保持稳定而在小部分地区出现显著变化,呈现明显的空间聚集特征。具体而言,土壤保持量在76.5%的区域内未出现显著变化;土壤保持量显著增加(p < 0.05)的区域比例为21.7%,大部分位于研究区中东部,在南部也有少量分布。草地区是土壤保持服务提升最明显的区域,其次为林地—草地区。就产水服务而言,产水服务总体保持稳定(图2c)。产水显著增加(p < 0.05)的区域比例为8.2%,分布较为分散,位于研究区东北部和南部地区。各生物气候区中,产水显著增加的地区在草地区的所占比例最大,其次为草地—沙漠区。就碳固定服务而言,碳固定服务显著提升(图2d)。NPP显著增加(p < 0.05)的区域所占比例达到47.7%。在空间上,NPP显著增加区域主要集中连片分布在黄土高原中部,沿西南—东北方向延展,另有少部分位于黄土高原北部以及东部地区。各生物气候区中,草地区的NPP增加趋势最明显,NPP显著增加区域在草地区占比达到66.8%,其次为林地—草地区,占比为62.8%。
3.2 植被覆盖对生态系统服务的影响
3.2.1 植被覆盖与生态系统服务的关系(1)植被覆盖与土壤保持服务。2000—2015年植被覆盖与土壤保持服务的关系如图3a所示。结果显示,FVC与土壤保持量呈显著正相关(p < 0.05)的区域占研究区总面积的53.1%,表明植被覆盖与土壤保持服务间具有高度相关性,近年来的植被改善能够有效促进土壤保持服务的提升。在空间上,二者显著相关的区域集中在黄土高原东北部,少量位于西南部。黄土高原中部的草地区是植被与土壤保持服务关联性最强的区域,其次为林地—草地区和草地—沙漠区。
图3
 新窗口打开|下载原图ZIP|生成PPT
图3黄土高原植被覆盖与生态系统服务关系
Fig. 3The relationships between vegetation coverage and ecosyatem services in the Loess Plateau
(2)植被覆盖与产水服务。2000—2015年植被覆盖与产水服务的关系如图3b所示。FVC与产水量的关联相对较弱。植被覆盖度与产水服务呈显著相关(p < 0.05)的区域占研究区总面积的10.7%。在空间格局方面,二者显著相关区域主要聚集于黄土高原西部,少量位于中部,另有部分在东北部零散分布,其范围内植被变化以显著增加为主。草地区是植被覆盖度与产水服务关系最明显的区域。
(3)植被覆盖与碳固定服务。2000—2015年植被覆盖与碳固定服务的关系如图3c所示。结果显示,FVC与NPP呈显著正相关(p < 0.05)的区域占黄土高原总面积的87.6%。二者显著相关区域总体沿东北—西南方向分布,主要位于黄土高原西南部、中部、北部以及东北部,其范围内植被变化趋势以显著恢复为主。分析结果表明,植被覆盖与碳固定服务存在广泛且紧密的联系,植被覆盖度的增加能够明显促进碳固定服务的提升。结合前两组分析结果发现,植被与碳固定服务的关联强度远超出与其他服务类型的关系。在各生物气候区中,植被覆盖度与碳固定服务关系在草地区最为显著,同时在林地—草地区以及林地区表现得也较为明显。
3.2.2 植被覆盖对生态系统服务的影响 整合土壤保持、产水、碳固定三项服务获取综合指数,结合FVC时间序列数据开展定量分析,以明确区域尺度植被覆盖对生态系统服务总体影响的趋势,识别影响的阈值。
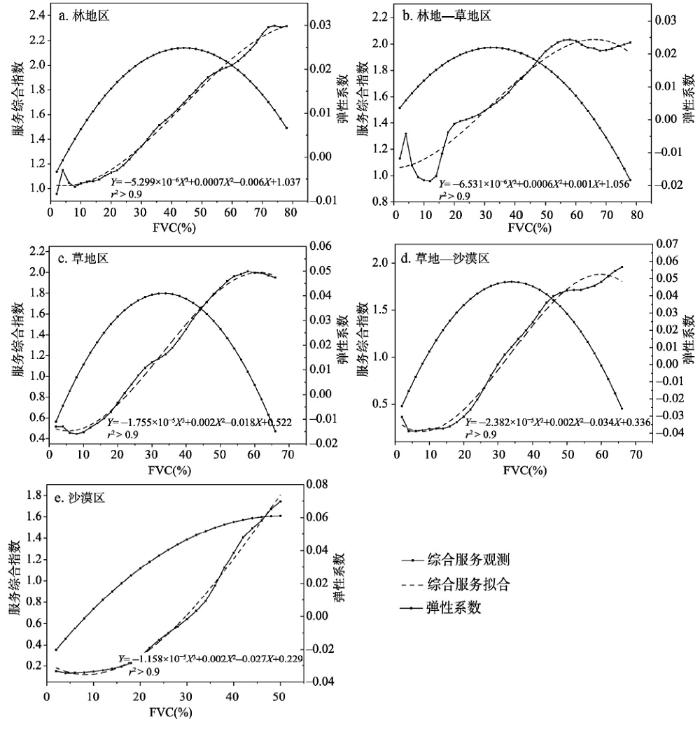
(1)林地区是黄土高原植被覆盖水平最高的区域,FVC与综合指数的关系如图4a所示。随着FVC的升高,综合指数相应增加,最大值为2.32(FVC为74%),但增速趋于减缓。分析弹性系数可以发现,此过程中弹性系数表现为一条为先升高后降低的曲线。在6% < FVC < 44%条件下,弹性系数呈增长态势,FVC升高带动综合指数的持续加速提升;在FVC达到44%的阈值时,弹性系数达到最大值0.025,FVC对生态系统服务的影响达到最大强度;超过阈值,FVC的影响强度降低,植被改善对生态系统服务的提升趋于减弱。
图4
 新窗口打开|下载原图ZIP|生成PPT
图4各生物气候区综合指数及弹性系数随植被覆盖度的变化
Fig. 4The changes of the comprehensive index of ecosystem service and the elasticity coefficient along with vegetation coverage change in each bioclimatic zone
(2)林地—草地区FVC与综合指数的关系见图4b。结果表明,综合指数在FVC增加的带动下呈现明显提升,并在FVC为70%时达到峰值。对弹性系数的分析显示,FVC < 32%的条件下,弹性系数随着FVC的提高而递增,表明区域生态系统服务随着植被改善而持续加速提升;植被影响的阈值于FVC为32%处出现;FVC > 32%,弹性系数的变化趋势转为递减。
(3)草地区FVC与综合指数的关系如图4c所示。可见,草地区综合指数随FVC变化表现为一条先增后减的曲线,最小值为0.47,最大值为2。在FVC较低时,综合指数随FVC增加而提升,FVC超过62%后,综合指数反而会出现小幅降低。弹性系数的变化表现为一条先上升后下降的曲线,表明植被覆盖对生态系统服务的影响强度先增强后减弱,阈值于FVC为34%的条件下出现。
(4)草地—沙漠区的综合指数总体随FVC增加而提升(图4d)。弹性系数的变化显示,植被覆盖对生态系统服务的影响强度呈先增强后减弱的趋势,影响的阈值在FVC为34%的条件下出现;FVC超过阈值,植被覆盖增加对生态系统服务的促进作用逐渐弱化。
(5)沙漠区的植被覆盖较低,综合指数与FVC的关系也相对简单(图4e)。结果表明,综合指数随FVC增加而持续提升,且提升速率未见减缓,即植被覆盖增加对生态系统服务的促进效果不断增强。但受环境条件所限,该区域脆弱的生态系统难以承受强度较高的生态恢复措施,因此植被覆盖和生态系统服务应以维持当前水平为宜。
4 讨论
本文通过模型模拟计算黄土高原土壤保持、产水和碳固定三类生态系统服务,并将其整合得到综合指数。基于此,分析植被覆盖对生态系统服务的影响,并对影响阈值进行定量识别。研究方法的局限性主要有两点:① 仅选择三种服务类型可能难以充分表征区域生态系统服务状况,未来研究中可以考虑增加生态系统服务类型,如水质净化、粮食生产、木材生产等;② 阈值识别的尺度依赖性[6],随着空间尺度的不同,阈值的出现条件可能随之改变,可以在未来研究中开展多尺度分析予以验证。退耕还林工程实施以来,黄土高原植被覆盖发生显著变化,继而引发生态系统服务相应改变。本研究结果表明,植被改善能够降低土壤侵蚀,促进土壤保持服务的提升。****在黄土高原开展的野外试验和流域尺度土壤侵蚀评估均佐证了此结果[31,40]。植被的促进作用主要体现在研究区东北部和西南部,多属于丘陵沟壑区。通过增加坡地植被覆盖,可以有效控制细沟和沟道侵蚀,降低土壤侵蚀速率,降幅可达90%[41]。此外,植被还在降低坡面流输沙能力、改善土壤结构等方面促进土壤保持服务[35,36]。就产水服务而言,在区域尺度,其与植被覆盖的关系并不显著。但是有研究认为植被增加会导致黄土高原产水降低[42]。考虑到水资源对于黄土高原的重要影响以及区域气候暖干化趋势[43,44],有必要对产水服务继续予以关注。碳固定服务呈增长趋势且与植被覆盖高度相关。Feng等在研究中也发现了碳固定服务的显著提升,指出黄土高原生态系统已由碳源转变为碳汇,并明确植被恢复因素的主导作用[22]。此外,植被覆盖增加对土壤侵蚀的控制也有助于降低生态系统碳流失,增强碳固定服务[45]。植被覆盖与碳固定服务的相关性在草地区和林地—草地区表现较为明显。Wang等通过样地调查证实草地生态系统的固碳作用,并强调典型草原和森林草原在固碳方面的重要作用[46]。
综合指数与植被覆盖的分析表明,区域生态系统服务与植被覆盖呈非线性关系,且植被覆盖的影响具有阈值效应。定量识别阈值能够为生态管理实践提供重要参考[47]。Martin等在研究中提出决策阈值(Decision Thresholds)的概念,即在此状态下,生态系统的小幅变化引发管理者的决策行为发生明显变化[48]。本文确定的影响阈值可以作为界定决策阈值的参照。在生态恢复的规划与实施中,可以将阈值出现条件作为参考,在各生物气候区采用差异化的生态恢复规模和强度,同时采用“植被适度恢复以实现尽量高的生态系统服务”的思路对恢复进程和目标进行规划,促进资源的合理高效利用,降低水资源过度消耗等潜在风险[17]。
5 结论
本文分析了2000—2015年黄土高原植被覆盖以及主要生态系统服务的时空变化,分析植被覆盖变化对生态系统服务的影响,并对植被覆盖影响阈值进行定量识别。研究的主要结论包括:(1)2000—2015年黄土高原植被净增加。生态系统服务变化差异明显,土壤保持服务总体提升,21.7%的区域出现土壤保持量显著增加;产水服务总体较为稳定;碳固定服务明显增强,NPP显著增加区域比例达到47.7%。
(2)植被覆盖恢复与生态系统服务变化密切相关,但是与不同生态系统服务的关联程度存在差异。在变化过程中,植被覆盖与土壤保持服务显著相关的比例为53.1%,与产水服务显著相关的比例为10.7%,与碳固定服务显著相关的比例达到87.6%。草地区是植被覆盖变化对生态系统服务影响最明显的区域。
(3)植被覆盖改善促进区域生态系统服务提升,但促进作用存在阈值。阈值出现的条件在不同生物气候区存在差异,在林地区、林地—草地区、草地区和草地—沙漠区分别为植被覆盖度44%、32%、34%和34%。植被覆盖超过阈值后,其对生态系统服务的促进作用趋于弱化。
参考文献 原文顺序
文献年度倒序
文中引用次数倒序
被引期刊影响因子
DOI:10.3390/su4113066URL [本文引用: 1]
[本文引用: 1]
[本文引用: 1]
DOI:10.17521/cjpe.2015.0090URL [本文引用: 1]

The concept of ecological thresholds was raised in the 1970s. However, it was subsequently given different definitions and interpretations depending on research fields or disciplines. For most scientists, ecological thresholds refer to the points or zones that link abrupt changes between alternative stable states of an ecosystem. The measurement and quantification of ecological thresholds have great theoretical and practical significance in ecological research for clarifying the structure and function of ecosystems, for planning sustainable development modes, and for delimiting ecological red lines in managing the ecosystems of a region. By reviewing the existing concepts and classifications of ecological thresholds, we propose a new concept and definition at two different levels: the ecological threshold points, i.e. the turning points of quantitative changes to qualitative changes, which can be considered as ecological red lines; the ecological threshold zones, i.e. the regime shifts of the quantitative changes among different stable states, which can be considered as the yellow and/or orange warning boundaries of the gradual ecological changes. The yellow thresholds mean that an ecosystem can return to a stable state by its self-adjustment, the orange thresholds indicate that the ecosystem will stay in the equilibrium state after interference factors being removed, whereas the red thresholds, as the critical threshold points, indicate that the ecosystem will undergo irreversible degradation or even collapse beyond those points. We also summarizes two types of popular methods in determining ecological thresholds: statistical analysis and modeling based on data of field observations. The applications of ecological thresholds in ecosystem service, biodiversity conservation and ecosystem management research are also reviewed. Future research on ecological thresholds should focus on the following aspects: (1) methodological development for measurement and quantification of ecological thresholds; (2) emphasizing the scaling effect of ecological thresholds and establishment of national-scale observation system and network; and (3) implementation of ecological thresholds as early warning tools in ecosystem management and delimiting ecological red lines.
DOI:10.17521/cjpe.2015.0090URL [本文引用: 1]
The concept of ecological thresholds was raised in the 1970s. However, it was subsequently given different definitions and interpretations depending on research fields or disciplines. For most scientists, ecological thresholds refer to the points or zones that link abrupt changes between alternative stable states of an ecosystem. The measurement and quantification of ecological thresholds have great theoretical and practical significance in ecological research for clarifying the structure and function of ecosystems, for planning sustainable development modes, and for delimiting ecological red lines in managing the ecosystems of a region. By reviewing the existing concepts and classifications of ecological thresholds, we propose a new concept and definition at two different levels: the ecological threshold points, i.e. the turning points of quantitative changes to qualitative changes, which can be considered as ecological red lines; the ecological threshold zones, i.e. the regime shifts of the quantitative changes among different stable states, which can be considered as the yellow and/or orange warning boundaries of the gradual ecological changes. The yellow thresholds mean that an ecosystem can return to a stable state by its self-adjustment, the orange thresholds indicate that the ecosystem will stay in the equilibrium state after interference factors being removed, whereas the red thresholds, as the critical threshold points, indicate that the ecosystem will undergo irreversible degradation or even collapse beyond those points. We also summarizes two types of popular methods in determining ecological thresholds: statistical analysis and modeling based on data of field observations. The applications of ecological thresholds in ecosystem service, biodiversity conservation and ecosystem management research are also reviewed. Future research on ecological thresholds should focus on the following aspects: (1) methodological development for measurement and quantification of ecological thresholds; (2) emphasizing the scaling effect of ecological thresholds and establishment of national-scale observation system and network; and (3) implementation of ecological thresholds as early warning tools in ecosystem management and delimiting ecological red lines.
DOI:10.1016/j.ecoser.2017.03.004URL [本文引用: 1]
[本文引用: 2]
DOI:10.1890/100068URL [本文引用: 1]
DOI:10.1016/j.landusepol.2018.02.050URL [本文引用: 1]
DOI:10.1111/j.1365-2664.2011.02011.xURL [本文引用: 1]
1. During the past three decades, conservation and restoration biologists have increasingly recognized that ecological communities are likely to exhibit threshold changes in structure. However, because long-term monitoring data are generally lacking, little is known about the consequences of such ecological thresholds for the processes of ecosystem degradation and recovery.
2. To identify whether a degradation threshold exists that defines the boundary between the possibility of natural recovery and the need for artificial restoration of an ecosystem and to use this knowledge to support the development of a suitable strategy for environmental restoration, we performed long-term monitoring of vegetation recovery in China's Changting County since 1984.
3. A major problem was identified, which we refer to as the 'irreversible loss of soil services'; when vegetation cover decreases below a degradation threshold, this leads to sustained degeneration of the vegetation community, erosion of the surface soil and declining soil fertility. These changes represent a severe and long-lasting disturbance that will prevent ecosystem recovery in the absence of comprehensive artificial restoration measures.
4. Synthesis and applications. We identified a degradation threshold at about 20% vegetation cover suggesting that for some sites, vegetation cover can serve as a simple proxy for more sophisticated approaches to identifying thresholds; restoration must start with the restoration of soil fertility and continue by facilitating vegetation development. Our results support the concept of ecological thresholds (specifically, for soil services in a warm and wet region) and provide a model to inform restoration strategies for other degraded ecosystems.
[本文引用: 1]
DOI:10.1016/j.ecocom.2011.07.003URL [本文引用: 1]
Soil erosion in terrestrial ecosystems, as an important global environmental problem, significantly impacts on environmental quality and social economy. By protecting soil from wind and water erosion, terrestrial ecosystems supply human beings with soil erosion control service, one of the fundamental ecosystem services that ensure human welfare. The Loess Plateau was one of the regions in the world that suffered from severe soil erosion. In the past decades, restoration projects were implemented to improve soil erosion control in the region. The Grain-to-Green project, converting slope croplands into forest or grasslands, launched in 1999 was the most massive one. It is needed to assess the change of soil erosion control service brought about by the project. This study evaluated the land cover changes from 2000 to 2008 by satellite image interpretation. Universal Soil Loss Equation (USLE) was employed for the soil erosion control assessment for the same period with localized parameters. Soil retention calculated as potential soil erosion (erosion without vegetation cover) minus actual soil erosion was applied as indicator for soil erosion control service. The results indicate that ecosystem soil erosion control service has been improved from 2000 to 2008 as a result of vegetation restoration. Average soil retention rate (the ratio of soil retention to potential soil loss in percentage) was up to 63.3% during 2000-2008. Soil loss rate in 34% of the entire plateau decreased, 48% unchanged and 18% slightly increased. Areas suffering from intense erosion shrank and light erosion areas expanded. Zones with slope gradient of 8 degrees-35 degrees were the main contribution area of soil loss. On average, these zones produced 82% of the total soil loss with 45.5% of the total area in the Loess Plateau. Correspondingly, soil erosion control capacity was significantly improved in these zones. Soil loss rate decreased from 5000 t km(-2) yr(-1) to 3600 t km(-2) yr(-1), 6900 t km(-2) yr(-1) to 4700 t km(-2) yr(-1), and 8500 t km(-2) yr(-1) to 5500 t km(-2) yr(-1) in the zones with slope gradient of 8 degrees-15 degrees, 15 degrees-25 degrees, and 25 degrees-35 degrees respectively. However, the mean soil erosion rate in areas with slope gradient over 8 degrees was still larger than 3600 t km(-2) yr(-1), which is far beyond the tolerable erosion rate of 1000 t km(-2) yr(-1). Thus, soil erosion is still one of the top environmental problems that need more ecological restoration efforts. (C) 2011 Elsevier B.V.
DOI:10.1016/j.ecolind.2014.07.031URL [本文引用: 1]
DOI:10.1371/journal.pone.0031782URL [本文引用: 1]
DOI:10.1080/07900627.2012.668650URL [本文引用: 1]
The sediment load of the Loess Plateau has shown a sharp decreasing trend in the past decades. This paper gives a comprehensive review of the driving factors of the sediment decrease with respect to human activities, including soil and water conservation, dam construction, and vegetation restoration. Also presented is an overview of the main achievements of soil and water conservation and the main soil erosion control programmes implemented in the Loess Plateau. The paper concludes with suggestions for further policy modifications that could move management towards ecological sustainability and will be greatly beneficial to the regional water resources management and restoration of an eco-environmental system in the Loess Plateau.
DOI:10.1016/j.geoderma.2007.10.013URL [本文引用: 1]
DOI:10.1016/j.jhydrol.2009.09.042URL [本文引用: 1]
DOI:10.1016/j.earscirev.2010.11.002URL [本文引用: 2]
Afforestation is a primary tool for controlling desertification and soil erosion in China. Large-scale afforestation, however, has complex and poorly understood consequences for the structure and composition of future ecosystems. Here, we discuss the potential links between China's historical large-scale afforestation practices and the program's effects on environmental restoration in arid and semi-arid regions in northern China based on a review of data from published papers, and offer recommendations to overcome the shortcomings of current environmental policy. Although afforestation is potentially an important approach for environmental restoration, current Chinese policy has not been tailored to local environmental conditions, leading to the use of inappropriate species and an overemphasis on tree and shrub planting, thereby compromising the ability to achieve environmental policy goals. China's huge investment to increase forest cover seems likely to exacerbate environmental degradation in environmentally fragile areas because it has ignored climate, pedological, hydrological, and landscape factors that would make a site unsuitable for afforestation. This has, in many cases, led to the deterioration of soil ecosystems and decreased vegetation cover, and has exacerbated water shortages. large-scale and long-term research is urgently needed to provide information that supports a more effective and flexible environmental restoration policy. (C) 2010 Elsevier B.V.
DOI:10.1016/j.agrformet.2010.11.016URL [本文引用: 2]
A dried soil layer (DSL) formed in the soil profile is a typical indication of soil drought caused by climate change and/or poor land management. The responses of a soil to drought conditions in water-limited systems and the impacts of plant characteristics on these processes are seldom known due to the lack of comparative data on soil water content (SWC) in the soil profile. The occurrence of DSLs can interfere in the water cycle in soil-plant-atmosphere systems by preventing water interchanges between upper soil layers and groundwater. Consequently, a DSL may limit the sustainability of environmental restoration projects (e.g., revegetation, soil and water conservation, etc.) on the Loess Plateau of China and in other similar arid and semiarid regions. In this study, we investigated and compared the impacts of soil type, land use and plant characteristics within each of the three climatic regions (arid, semiarid, semihumid) of the Loess Plateau. A total of 17,906 soil samples from 382 soil profiles were collected to characterize DSLs across the Plateau.
Spatial patterns of DSLs (represented by four indices: (1) DSL thickness, DSLT; (2) DSL forming depth, DSLFD; (3) mean SWC within the DSL, DSL-SWC; and (4) stable field water capacity, SFC) differed significantly among the climatic regions, emphasizing the importance of considering climatic conditions when assessing DSL variations. The impact of land use on DSLs varied among the three climatic regions. In the arid region, land use had no significant effect on DSLs but there were significant effects in the semiarid and semihumid regions (P < 0.05). The development of DSLs under trees and grasses was more severe in the semiarid region than in the semihumid region. In each climatic region, the extent of DSLs depended on the plant species (e.g., native or exotic, tree or grass) and growth ages; while only in the semiarid region, the DSL-SWC and SFC (P < 0.001) were significantly influenced by soil type. The DSL distribution pattern was related to the climatic region and the soil texture, which both followed gradients along the southeast-northwest axis of the Plateau. Optimizing land use can mediate DSL formation and development in the semiarid and semihumid regions of the Loess Plateau and in similar regions elsewhere. Understanding the dominant factors affecting DSLs at the regional scale enables scientifically based policies to be made that would alleviate the process of soil desiccation and sustain development of the economy and restoration of the natural environment. Moreover, these results can also be useful to the modeling of the regional water cycle and related eco-hydrological processes. (C) 2010 Elsevier B.V.
DOI:10.1016/j.gloplacha.2014.08.008URL [本文引用: 1]
We have developed a 272-year ring-width chronology of Chinese pine (Pinus tabulaeformis) growing in the Huanglong Mountains, North China. Climatic response analyses revealed that mean January-July Palmer drought severity index (PDSI) has positive effect on the radial growth of pine trees. Based on the relationships, the mean January-July PDSI was reconstructed for the period from 1760 to 2010. The percentage of variance in the data explained by the reconstruction was 41% during the calibration period of 1950-2010. Spatial correlation analyses between the PDSI reconstruction and gridded PDSI data show that the PDSI reconstruction captures regional drought variations over the environmentally-sensitive area linked to the East Asian summer monsoon. Relatively wet periods are identified for AD 1766-1781, 1795-1804, 1811-1821, 1838-1859, 1884-1889, 1909-1914, 1937-1977 and 2003-2008. Dry conditions prevailed during AD 1760-1765, 1782-1794, 1805-1810, 1822-1837, 1860-1883, 1890-1908, 1915-1936, 1978-2002 and 2009-now. There is a reasonable agreement with dry/wet periods previously estimated from tree-ring data of the Kongtong Mountains of the Loess Plateau. Spatial correlation analyses with sea surface temperature in the Pacific Ocean and tropical Indian Ocean indicated that the Asian summer monsoon circulations play a role in modulating drought variations in the study area whereas the effects of the Pacific Decadal Oscillation are relatively strong. (C) 2014 Elsevier B.V.
DOI:10.1007/BF02837376URL [本文引用: 1]
The Loess Plateau is well known to the world for its intense soil erosion. The root cause for river sedimentation of Yellow River (Huanghe) and its resultant “hanging river” in certain section is soil and water loss on the Loess Plateau. The Loess Plateau has a long cultivation history, hence population growth, vegetation degeneration and plugging constitute the chief reason for serious soil and water loss on Loess Plateau. This paper analyses several successful cases and failures in soil conservation, presents practical soil conservation technique and related benefit analysis, and discusses some effective methods adopted in China in soil erosion control, research directions and future perspectives on Loess Plateau.
DOI:10.1016/j.landusepol.2015.09.002URL [本文引用: 1]
URL [本文引用: 3]
URL [本文引用: 1]
DOI:10.1017/S1755691018000518URL [本文引用: 1]
DOI:10.14358/PERS.76.8.965URL [本文引用: 1]
DOI:10.1016/j.ecolind.2012.10.012URL [本文引用: 1]
DOI:10.1016/j.agrformet.2015.03.003URL [本文引用: 1]
DOI:10.11821/xb201209010URL [本文引用: 1]
Global climate change has led to significant vegetation changes in the past half century. Inner Mongolia, most of which was located in arid and semi-arid areas, is undergoing a process of prominent warming and drying. It is necessary to investigate the response of vegetation to the climatic variations (temperature and precipitation) for a better understanding of the accumulated consequence of climate change. Vegetation coverage, which is an important indicator for evaluating terrestrial environment, is used to monitor vegetation change. MODIS-NDVI data and climate data were used to analyze the vegetation dynamics and its relationship with climate change on different spatial (forest, grassland and desert biome) and temporal (yearly and monthly) scales in Inner Mongolia during 2001-2010. It was found that vegetation coverage increased from west to east across Inner Mongolia with a change rate of 0.2/10°N. During 2001-2010, the mean vegetation coverage was 0.57, 0.4 and 0.16 in forest, grassland and desert biome, respectively, exhibiting evident spatial heterogeneities. There is a slight increase of vegetation coverage over the study period. Across Inner Mongolia, the vegetation coverages with extremely significant and significant increase accounted for 11.25% and 29.13% of the total study area, respectively, while those with extremely significant and significant decrease were 7.65% and 26.61%, respectively. The correlation analysis between vegetation coverage and climate shows that annual vegetation coverage was better correlated with precipitation, while the change of monthly vegetation coverage is consistent with both the changes of temperature and precipitation, indicating that the vegetation growth within a year is more sensitive to the joint function of hydrothermal combination rather than either climate factor. The vegetation coverage of forest biome was mainly affected by temperature on both yearly and monthly scales, while that of desert biome was mainly influenced by precipitation on the two temporal scales.
DOI:10.1007/s11629-013-2558-zURL [本文引用: 1]
DOI:10.1016/j.gloplacha.2013.06.012URL [本文引用: 1]
[本文引用: 2]
[本文引用: 1]
[本文引用: 1]
[本文引用: 1]
DOI:10.1007/s10980-014-0106-zURL [本文引用: 2]
DOI:10.1029/2000WR900325URL [本文引用: 3]
DOI:10.1016/j.jhydrol.2012.12.020URL [本文引用: 1]
[本文引用: 1]
DOI:10.1111/jawr.2005.41.issue-3URL [本文引用: 1]
DOI:10.1007/s11442-009-0321-8URL [本文引用: 1]
By scouring experiments, the changeable process and characteristics of sediment yield in the hillslope-gully side erosion system with different coverage degrees and spatial locations of grass were studied. Five grass coverage degrees of 0, 30%, 50%, 70%, 90%, three spatial locations of grass (upslope, mid-slope, low-slope) and two water inflow rates of 3.2 L/min, 5.2 L/min were applied to a 0.5 by 7 m soil bed in scouring experiments. Results showed that the sediment yield decreased with the increase of grass coverage degree at 3.2 L/min water inflow rate in scouring experiments and the sediment yield with different grass locations on the sloping surface was in the order of upper > middle > lower. At 5.2 L/min water inflow rate, the differences of sediment yield among various grass coverage degrees were increased, whereas the changeable tendency of sediment yield with different grass locations on the whole sloping surface was not very obvious. The proportion of sediment yield from the gully side increased in an exponential relationship with the increase of grass coverage degree. When the grass was located on the lower position of hillslope, the influence for accelerating gully erosion is the greatest.
DOI:10.1016/S1002-0160(06)60071-4URL [本文引用: 1]
DOI:10.5194/hess-16-2617-2012URL [本文引用: 1]
DOI:10.1146/annurev-earth-063016-020552URL [本文引用: 1]
DOI:10.1016/j.gloplacha.2015.05.011URL [本文引用: 1]
DOI:10.1016/j.gloplacha.2019.03.017URL [本文引用: 1]
DOI:10.1016/j.catena.2018.01.007URL [本文引用: 1]
DOI:10.1016/j.landusepol.2017.02.008URL [本文引用: 1]
DOI:10.1890/08-0255.1URL [本文引用: 1]
