 ,, 李艳红河南大学环境与规划学院,开封 475004
Multi-scale analysis of trade-off/synergy effects of forest ecosystem services in the Funiu Mountain Region
ZHANG Jingjing, ZHU Wenbo, ZHU Lianqi,, LI YanhongCollege of Environment and Planning, Henan University, Kaifeng 475004, Henan, China通讯作者:
收稿日期:2019-03-27修回日期:2020-03-12网络出版日期:2020-05-25
| 基金资助: |
Received:2019-03-27Revised:2020-03-12Online:2020-05-25
| Fund supported: |
作者简介 About authors
张静静(1991-),女,河南柘城人,博士,主要从事全球变化与生态系统服务研究E-mail:zhang1126x@qq.com。

摘要
关键词:
Abstract
Keywords:
PDF (3915KB)元数据多维度评价相关文章导出EndNote|Ris|Bibtex收藏本文
本文引用格式
张静静, 朱文博, 朱连奇, 李艳红. 伏牛山地区森林生态系统服务权衡/协同效应多尺度分析. 地理学报[J], 2020, 75(5): 975-988 doi:10.11821/dlxb202005007
ZHANG Jingjing.
1 引言
陆地生态系统为人类社会提供多种多样的产品和服务,在形成与维持人类生存与发展的环境条件及物质基础方面发挥重要作用[1,2]。不同方式的自然资源利用与管理导致生态系统功能的明显变化,使生态系统的物质生产、水源供给、土壤保持和碳储存等服务之间形成此消彼长的权衡或相互增益的协同关系[3,4]。千年生态系统评估(Millennium Ecosystem Assessment, MA)指出人类对某些生态系统服务的利用程度正在快速增加,导致一些关键类型的服务尤其是调节服务和文化服务的供给能力在持续衰减,严重影响人类福祉,直接威胁区域乃至全球的生态安全[5]。为了减少服务之间相互关系的负面效应,服务权衡关系研究应运而生,成为当前生态系统服务研究的一个重要议题[6]。目前,许多****在国家、区域以及流域等多种尺度上探讨了生态系统服务之间的权衡关系[3-4, 8-14],发现同一对服务在不同研究尺度或不同区域上的权衡与协同关系存在差异性。比如,研究表明涵养水源与固碳释氧这一对服务在较大空间尺度上主要以协同关系为主[11,12],而在中小尺度上则以权衡关系为主[13,14]。究其原因,主要是自然条件和生态过程在不同尺度空间均存在不整合或者生态系统服务供给与需求在空间上的不匹配造成的[15]。不同空间尺度内的利益群体对不同生态系统提供的产品与服务各有侧重,如木材生产、涵养水源等主要服务于区域尺度,而生物多样性、固碳释氧等则服务于全球尺度[2]。这必然导致不同利益相关者对不同类型生态系统服务重视程度的差异以及管理策略之间的权衡[15]。因此生态系统服务权衡研究必须超越单一尺度模式,应综合考虑不同空间尺度上利益相关者的实际需求,开展多尺度多类型服务之间的权衡研究,厘清多种服务之间的权衡或协同关系及其尺度依存与空间差异特征,以明确服务权衡管理的优先顺序与侧重点,从而更加有效地实施生态系统服务管理[8-9, 15]。森林生态系统作为陆地生态系统的重要组成部分,为不同尺度区域提供不同类型的服务和福祉[16,17,18];而科学认识森林生态系统服务之间的权衡与协同关系是实现森林生态系统多目标经营与管理的前提[19,20]。国内外****围绕森林生态系统服务空间格局特征、服务之间相互作用关系以及服务受益方赔偿支付等方面开展了深入研究[16-17, 21-22],探讨了森林生态系统服务之间的相互关系:供给服务之间以权衡关系为主[23,24];供给服务与调节、支持及文化服务之间以权衡关系为主[19, 25-26],但也有少数协同关系[19, 24];供给服务与支持服务之间普遍以权衡关系为主[24-25, 27],少数为协同关系[28];调节服务之间以协同关系为主[24];调节与支持服务之间既存在权衡关系[24, 28],也存在协同关系[29,30];支持服务之间以协同关系为主[31]。由此,同一种类服务(除供给服务外)两两之间普遍以协同关系为主,而不同种类的两种服务之间权衡/协同关系存在明显的尺度依存和空间差异特征,这将会导致对服务权衡关系的认识存在一定片面性,无法正确引导决策者制定合理的管理措施来提升区域生态系统服务整体水平。而森林生态系统一般位于山区,特殊的地形特征导致服务之间的相互作用呈现复杂的空间异质性特征,然而多数研究忽略了地形的影响,难以更好地为决策制定提供更加精准的信息。因此,从多种空间尺度上全面探讨服务权衡/协同关系是当前森林生态系统服务与可持续经营研究亟需解决的问题。
伏牛山处于中国北亚热带向南暖温带过渡的地区,也是秦岭山地与黄淮海平原的过渡地带,具有优越的自然环境条件,是中国重要的生态功能区。但该区面临着比较严峻的生态环境问题[32],这些问题的产生都是在人类活动或自然因素影响下不同生态系统服务之间相互竞争的结果。为了使该区更好地发挥经济效益,而又不减弱生态效益与社会效益,有必要深入研究该区森林生态系统服务之间权衡与协同关系。目前针对该区森林生态系统服务的研究,多集中于局部地区如宝天曼自然保护区、西峡县等,或仅探讨某一类型的森林生态系统如栎类林、锐齿栎林生态系统[33,34,35],没有从综合性和整体性的角度展开研究,使相关研究成果呈现局域化和碎片化,而服务之间作用关系的研究更是少见,很难为管理者提供系统的森林可持续经营方案。鉴于此,本文以伏牛山地区森林生态系统为研究对象,综合森林类型图、NDVI、气象和土壤等多源数据,借助CASA模型、InVEST 3.2模型和ArcGIS 10.2软件,开展综合森林生态系统服务评估,采用空间叠置等方法,从不同空间尺度(区域、南北坡、垂直带)探讨服务权衡与协同效应,有助于制定分区域、分类型的森林资源管理方案,可为伏牛山地区森林可持续经营管理提供理论指导和决策支持。
2 数据来源与研究方法
2.1 研究区概况
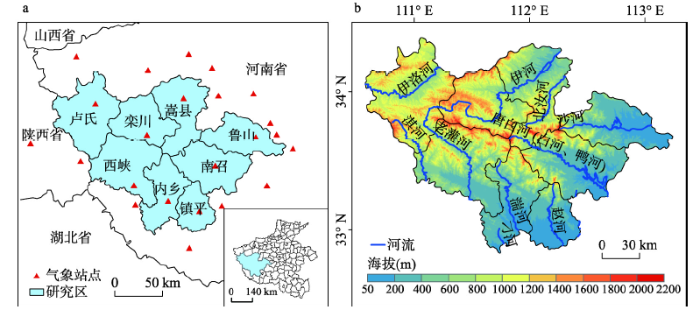
伏牛山位于河南省西部,是秦岭山系的重要余脉,呈西北—东南走向,西至河南、陕西省界,东至方城北部,北与熊耳山、外方山相接,南至南阳盆地。研究区包括8个完整县域单元,面积约2万km2,卢氏、栾川、嵩县和鲁山位于伏牛山北坡,内乡、西峡、镇平和南召位于南坡(图1)。地势自西向东逐渐降低,海拔介于50~2200 m,地貌类型复杂,高差起伏较大;植被类型属于北亚热带常绿落叶混交林向暖温带落叶阔叶林的过渡类型,植被和气候特征垂直差异显著[36]。图1
 新窗口打开|下载原图ZIP|生成PPT
图1研究区位置及高程示意图
Fig. 1Location and elevation map of the study area
2.2 数据来源与处理
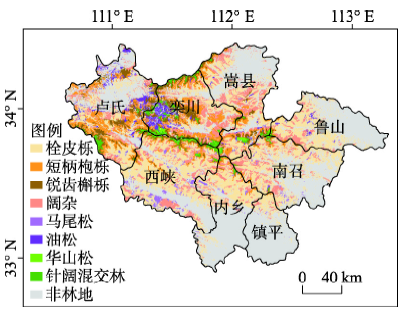
本文基础数据包括:① 森林类型图。选取35景高分1号影像,时间为2016—2017年6—10月,将2 m全色和8 m多光谱影像进行融合,经镶嵌、裁剪得到研究区2 m分辨率多光谱图像。基于此,参照2015年1:10万土地覆被图、1:100万植被类型图等数据,对研究区森林类型进行目视解译,生成森林类型分布图(图2)。伏牛山森林生态系统主要优势树种有栓皮栎(Quercus variabilis)、短柄枹栎(Quercus glandulifera var. brevipetiolata)、锐齿槲栎(Quercus aliena var. acuteserrata)、阔杂、油松(Pinus tabulaeformis)、马尾松(Pinus massoniana)、华山松(Pinus armandi)与华山松—锐齿槲栎混交林(Pinus armandi, Quercus aliena var. acuteserrata,以下简称针阔混交林)[37]。并采用179条野外调查数据进行精度验证,解译精度为82.39%。② DEM数据。采用ASTER GDEM,来源于地理空间数据云,空间分辨率为30 m。③ NDVI数据。采用2016—2017年MODIS NDVI数据,空间分辨率为250 m,来源为http://ladsweb.nascom.nasa.gov/data/。④ 气象数据。包括研究区及周边24个气象站点2016—2017年逐日平均气温、最高气温、最低气温、平均相对湿度、降水量、风速、日照时数和平均气压,来源于河南省气象局和国家气象数据网(http://data.cma.cn/)。⑤ 土壤属性数据。包含1:100万的土壤质地、土壤有机质、土壤深度等数据,来源于中国科学院资源环境科学数据中心(http://www.resdc.cn)。图2
 新窗口打开|下载原图ZIP|生成PPT
图2伏牛山地区森林类型分布图
Fig. 2Spatial distribution of forest types in Funiu Mountain
由于森林类型图解译所用影像为2016年和2017年两年影像拼接而成,因此NDVI、气象数据均采用2016—2017年两年的平均值。
基于森林类型图和DEM数据,统计伏牛山南北坡主要森林类型分布的海拔范围,据此划分南北坡垂直带谱。南坡垂直带谱相对北坡较为复杂,南坡包括低山落叶阔叶林带(SI)(≤ 800 m)、含常绿树种的针阔混交林带(SII)(800~1200 m)、中山落叶阔叶林带(SIII)(1200~1600 m)和中山针阔混交林带(SIV)(> 1600 m)4个垂直带;北坡包括低山落叶阔叶林带(NI)(≤ 1000 m)、中山落叶阔叶林带(NII)(1000~1500 m)和中山针阔混交林带(NIII)(> 1500 m)3个垂直带。
2.3 生态系统服务评估方法
本文借助CASA模型、InVEST模型和ArcGIS 10.2软件,定量评估研究区森林蓄积量、固碳、水源供给、土壤保持和生境支持5种服务的空间格局。模型所需参数计算过程如表1所示。Tab. 1
表1
表1模型所需参数计算方法
Tab. 1
| 服务类型 | 计算模型或思路 | 所需主要参数及处理 |
|---|---|---|
| 蓄积量 | 利用CASA模型计算森林植被净初级生产力(NPP)[38],参照文献[39,40],确定伏牛山地区不同森林类型NPP与蓄积量之间的转换公式,从而得到森林蓄积量空间数据。 | 植被指数采用MODIS NDVI,气温、降水量和太阳辐射均运用ANUSPLIN软件进行空间插值获得。太阳辐射是由日照时数计算所得[41]。 |
| 固碳 | InVEST模型碳储量模块[42] | 碳密度的获取主要参照文献[43,44],并根据不同树种的根茎比[36],计算得到地上和地下碳密度。 |
| 水源供给 | InVEST模型水源供给模块[42] | 潜在蒸散量,利用Penman-Monteith公式(日尺度)[38],并经ANUSPLIN插值得到;土壤深度,由土壤数据通过栅格化所得;植被可利用含水量,采用非线性拟合土壤可用含水率估算模型计算所得[45];流域和子流域图,基于DEM数据,运用Hydrology分析工具提取得到。 |
| 土壤保持 | InVEST模型土壤保持模块[42] | 降雨侵蚀力因子,采用Wischmeier的月尺度公式计算得到[46];土壤可蚀性因子,采用土壤可蚀性估算模型计算得到[47];工程措施因子,均赋为1,表示均未采取水土保持措施;植被覆盖和管理因子,参考文献[48]中关于林地植被管理因子的计算方法计算得到。 |
| 生境支持 | InVEST模型生境支持模块[42] | 生境威胁源包括水田、旱地、农村居民点、城镇建设用地、工矿用地及交通用地,由2015年1:10万土地覆被提取得到,并转为30 m的栅格数据;生境威胁源表和敏感性表参照文献[49],并结合研究区实际情况进行赋值;法律准入性矢量图,利用伏牛山国家级自然保护区植被图提取出保护区边界,并根据保护区程度分级,在属性表中分别赋予其可达度值。 |
新窗口打开|下载CSV
2.4 服务权衡/协同效应分析方法
本文采用空间叠置分析方法识别服务权衡或协同的类型和区域[17],该方法可以直观地展示多种服务之间权衡或协同关系的空间分异特征,有助于服务权衡管理决策有效地落实到特定空间位置上。具体计算步骤如下:(1)服务能力分级。由于不同类型服务物质量的单位不同,无法进行同一尺度上的关联和比较,因此首先对各项服务进行标准化处理[50],并运用自然间断点法将各服务的供给能力分为3个级别:低、中、高,编号依次为1、2、3(表2)。
Tab. 2
表2
表2各生态系统服务能力分级
Tab. 2
| 服务类型 | 低(1) | 中(2) | 高(3) |
|---|---|---|---|
| 蓄积量服务 | 0~0.224 | 0.224~0.329 | 0.329~1 |
| 固碳服务 | 0~0.293 | 0.293~0.619 | 0.619~1 |
| 水源供给服务 | 0~0.325 | 0.325~0.569 | 0.569~1 |
| 土壤保持服务 | 0~0.184 | 0.184~0.541 | 0.541~1 |
| 生境支持服务 | 0~0.111 | 0.111~0.362 | 0.362~1 |
新窗口打开|下载CSV
(2)服务空间叠置。将5种服务标准化并分级后的栅格数据进行叠置,规则如下:
式中:“蓄”、“碳”、“水”、“土”和“生”分别代表蓄积量、固碳、水源供给、土壤保持和生境支持服务;CODE是五位数代码,每一个代码序列都是1、2和3任意组合的栅格值,代表对应服务类型的供给能力。
(3)服务权衡或协同关系分类标准。根据5种服务叠置结果及权衡和协同的定义[2],制定权衡/协同分类标准(表3)。将权衡划分为强权衡和弱权衡,强权衡为一种服务供给能力较强而其他较低的状态;弱权衡为2种、3种或4种服务能力较高而其他服务较低的状态。协同划分为高协同和低协同,高协同即5种服务能力都较高,是最协调的状态,也是生态系统管理的最终目标;低协同即5种服务能力都较低,这种状态是最不理想的。
Tab. 3
表3
表3生态系统服务权衡/协同划分标准及统计
Tab. 3
| 服务关系 | 面积占比(%) | 亚类 | 面积占比(%) | 供给能力组合 | 面积占比(%) | 样例 |
|---|---|---|---|---|---|---|
| 权衡 | 61.06 | 强权衡 | 24.56 | 1高4低 | 1.45 | 11311、11113 |
| 1高1中3低 | 2.07 | 11321、12113 | ||||
| 1高2中2低 | 7.37 | 12312、12321 | ||||
| 1高3中1低 | 13.67 | 22312、32212 | ||||
| 弱权衡 | 36.5 | 2高3低 | 1.89 | 11133、11313 | ||
| 2高1中2低 | 4.72 | 23113、31123 | ||||
| 2高2中1低 | 10.78 | 23213、23123 | ||||
| 3高2低 | 3.99 | 33113、13313 | ||||
| 3高1中1低 | 12.41 | 33213、23313 | ||||
| 4高1低 | 2.72 | 33313、33133 | ||||
| 协同 | 38.94 | 高协同 | 28.79 | 5高 | 0.83 | 33333 |
| 4高1中 | 4.52 | 33233、23333 | ||||
| 3高2中 | 7.82 | 33223、32332 | ||||
| 2高3中 | 7.83 | 22332、32322 | ||||
| 1高4中 | 6.54 | 22322、22232 | ||||
| 5中 | 1.24 | 22222 | ||||
| 低协同 | 10.15 | 1中4低 | 0.25 | 11211、12111 | ||
| 2中3低 | 2.11 | 12112、12211 | ||||
| 3中2低 | 3.6 | 12212、22112 | ||||
| 4中1低 | 4.2 | 22212、22122 | ||||
| 5低 | 0 | 11111 |
新窗口打开|下载CSV
3 结果分析
3.1 森林生态系统服务总量评估
2016—2017年研究区森林生态系统总蓄积量6.18×10⁷ m3,单位蓄积量49.26 m3/hm2;固碳量1.97×108 t,碳密度156.94 t/hm2;水源供给量6.06×109 m3,供水深度494.46 mm;土壤保持量1.16×10⁹ t,单位土壤保持量955.4 t/hm2;生境质量指数约0.79(表4)。Tab. 4
表4
表4不同森林类型各生态系统服务总量及比例
Tab. 4
| 森林类型 | 蓄积量 | 固碳 | 水源供给 | 土壤保持 | 生境质量 | |||||||
|---|---|---|---|---|---|---|---|---|---|---|---|---|
| 总量(106 m3) | 比例(%) | 总量(106 t) | 比例(%) | 总量(108 m3) | 比例(%) | 总量(107 t) | 比例(%) | |||||
| 栓皮栎 | 27.37 | 44.29 | 92.15 | 46.82 | 31.95 | 52.70 | 54.79 | 47.27 | 0.71954 | |||
| 阔杂 | 12.25 | 19.83 | 43.97 | 22.34 | 12.31 | 20.31 | 26.18 | 22.59 | 0.79984 | |||
| 短柄枹栎 | 10.12 | 16.38 | 29.63 | 15.05 | 7.45 | 12.28 | 16.18 | 13.96 | 0.88991 | |||
| 锐齿槲栎 | 6.00 | 9.71 | 16.67 | 8.47 | 3.56 | 5.88 | 7.29 | 6.29 | 0.97995 | |||
| 油松 | 2.33 | 3.78 | 5.15 | 2.62 | 1.82 | 3.00 | 3.63 | 3.13 | 0.81979 | |||
| 针阔混交林 | 2.41 | 3.90 | 5.63 | 2.86 | 1.69 | 2.78 | 4.31 | 3.72 | 0.99998 | |||
| 马尾松 | 0.78 | 1.26 | 2.39 | 1.21 | 1.45 | 2.40 | 2.15 | 1.86 | 0.70949 | |||
| 华山松 | 0.53 | 0.86 | 1.24 | 0.63 | 0.40 | 0.66 | 1.37 | 1.18 | 0.99798 | |||
| 合计/平均值 | 61.78 | 100 | 196.83 | 100 | 60.64 | 100 | 115.9 | 100 | 0.7934 | |||
新窗口打开|下载CSV
不同森林类型各项服务总量变化规律与其面积大小基本一致(表4)。栓皮栎林面积比重最大(49.03%),其提供的各项服务总量所占比重也分别达到最大,均在44%~53%之间,尤其对水源供给量的贡献最大,超过50%;其次为阔杂林(20.12%),各项服务总量均占20%左右,其中对土壤保持和固碳的贡献最大,为22.59%和22.34%;短柄枹栎林(13.83%)和锐齿槲栎林(7.25%)次之,各项服务总量分别占12%~17%和5%~10%,两者尤其对蓄积量贡献最大,分别占16.38%和9.71%;油松林(3.72%)和针阔混交林(3.31%)所占面积相当,其对各项服务的贡献也比较相近,均在2.6%~4%之间,其中除水源供给外,蓄积量、固碳量和土壤保持量均表现为针阔混交林的贡献高于油松林;面积较小的马尾松林(1.96%)和华山松林(0.78%),各项服务总量都较小,均不超过2.5%,其中马尾松林对水源供给量的贡献最大(2.4%),华山松林对土壤保持量的贡献最大(1.18%)。由此,栓皮栎、阔杂、短柄枹栎和锐齿槲栎等地带性阔叶林是研究区森林生态系统服务总量的主要贡献者。
不同森林类型的生境质量存在明显差异(表4),其中针阔混交林、华山松林和锐齿槲栎林最大,均高于0.97;其次为短柄枹栎林,约0.89;油松林和阔杂林相当,约0.8;栓皮栎林和马尾松林最差,约0.7。由此,以天然林为主的针阔混交林、锐齿槲栎林和华山松林生境质量明显高于以天然次生林或人工林为主的栓皮栎林和马尾松林等。
3.2 服务能力分级的空间分布和统计分析
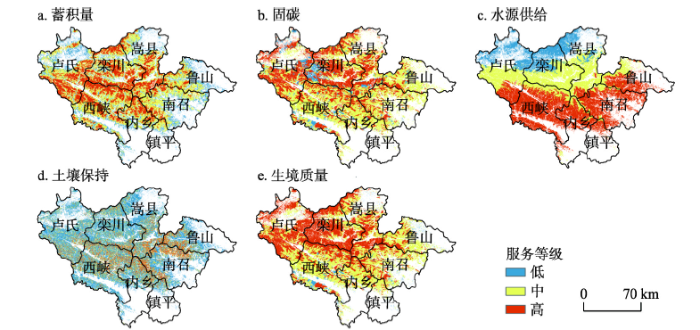
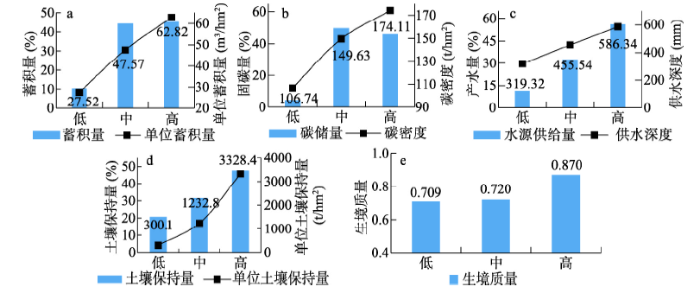
各类型生态系统服务不同分级区的空间特征(图3)、森林面积比重(图4)以及服务总量和单位量(图5)均表现出明显的差异。图3
 新窗口打开|下载原图ZIP|生成PPT
图3各生态系统服务供给能力分级区域的空间分布
Fig. 3Spatial pattern of the five ecosystem services based on the providing capacity classification
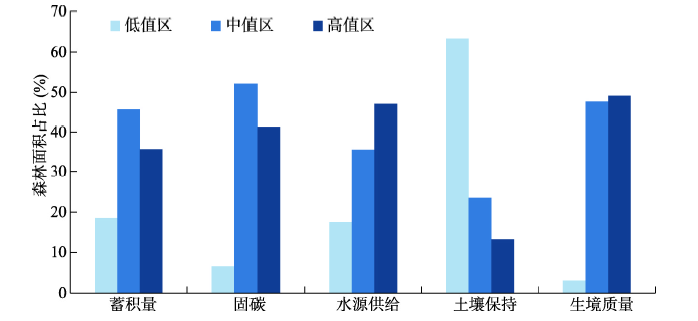
图4
 新窗口打开|下载原图ZIP|生成PPT
图4各类型生态系统服务不同分级区内的森林面积占比
Fig. 4Forest area in different classification regions of the five ecosystem services
图5
 新窗口打开|下载原图ZIP|生成PPT
图5各服务不同分级内服务总量和单位量
Fig. 5Total amount and unit amount of different regions for various ecosystem services
由图3、图4和图5a发现,蓄积量高值区内森林面积占35.51%,主要位于海拔1500 m以上的中高山地带,单位蓄积量达到最大(62.82 m3/hm2),总蓄积量占45.29%;中值区内,森林面积比重最大(45.9%),但总蓄积量(44.33%)略低于高值区,单位量为47.57 m3/hm2,主要位于高值区周边的中山地带;低值区内,森林面积比重最小(18.58%),主要位于海拔低于1000 m的低山和山麓地带,单位量最低(27.52 m3/hm2),总蓄积量仅占10.38%。由图3、图4和图5b发现,固碳服务高值区内森林面积占41.34%,碳密度最大(174.11 t/hm2),碳储量占45.86%,主要位于北坡卢氏和栾川境内的中高山地带;中值区森林面积(52.1%)超过研究区一半,其碳储量(49.68%)也将近达到研究区总碳储量的一半,碳密度为149.63 t/hm2,主要位于伏牛山南坡及北坡鲁山境内的中低山地带;低值区内森林面积占6.56%,碳密度为106.74 t/hm2,碳储量仅占4.46%,主要位于南坡马尾松林及北坡油松林区。由此,森林蓄积量和固碳服务整体上处于中等以上水平,但中值区占比例较大,未来若能提升中低值区的森林质量,将能够更明显地提升两种服务的整体水平。
由图3、图4和图5c发现,水源供给服务高值区内森林面积比重(47.2%)、水源供给量比重(56.08%)和供水深度(586.34 mm)均达到最大,提供着研究区一半以上的供水量,主要位于降水量丰富的伏牛山南坡及北坡卢氏和鲁山的南部;中值区内森林面积占35.34%,供水深度为455.54 mm,水源供给量占32.62%,主要位于干燥度指数较大的北坡中高山地带;低值区内森林面积比重最小(17.46%),供水深度为319.32 mm,水源供给量占11.3%,主要位于北坡卢氏、栾川、嵩县的北部,这些地区降水量少,蒸发量高。由此,水源供给服务整体处于中等以上水平,但空间差异明显,研究区北部地区供水能力较弱,水资源安全形势相对严峻。由图3、图4和图5d发现,土壤保持中值区和高值区内森林面积分别占23.52%和13.14%,土壤保持量占31.61%和47.67%,单位量为1232.81 t/hm2和3328.4 t/hm2。高值区主要位于东部各县交界处,中值区主要位于西峡北部及其与内乡、栾川和嵩县等地的交界处。低值区内森林面积比重最大,为63.34%,但其土壤保持量仅占20.72%,单位量也最低,仅为300.08 t/hm2,主要位于南坡海拔1000 m以下的低山区,以及北坡海拔1200 m以下的中低山地区。由此,高值区单位土壤保持量分别约为中值区和低值区近3倍和10倍。可见研究区超过一半的森林土壤保持服务处于较低水平,土壤保持服务还有巨大潜力,未来应加强伏牛山南坡低山区以及北坡中低山地区的水土保持工作,改善其生态环境,以提升研究区整体土壤保持服务。
由图3、图4和图5e发现,生境质量中值区和高值区内森林面积相当,分别占47.75%和49.13%,生境质量指数分别为0.72和0.87。中值区主要位于南坡以及北坡鲁山境内中低山区,高值区主要位于山脉主脊地带以及北坡卢氏、栾川和嵩县境内中高山地区。低值区森林面积比重较小(3.13%),生境质量指数最低(0.709),主要位于伏牛山南坡马尾松和栓皮栎人工林和次生林区。由此,研究区森林生境质量整体处于较高水平,但山麓地带的人工林和次生林生境质量较差,亟需加强管理和生态恢复,以提升整体生境支持服务水平。
3.3 生态系统服务权衡/协同效应多尺度分析
3.3.1 区域尺度服务权衡/协同效应分析 由表3和图6a发现,研究区有28.79%的森林服务之间存在高协同效应,主要位于伏牛山主脊地带、南坡海拔1000 m以上的中高山以及北坡海拔1500 m以上的高山地区。其中5种服务同时达到高值的森林面积仅占0.83%,仍有大面积的森林5种服务之间未达到最优协同状态。由表3和图6b发现,有10.15%的森林服务之间存在低协同效应,即5种服务都较低,主要位于北坡山麓地带,受人为干扰严重,多为人工林和次生林,林龄较小,蓄积量、碳储量、土壤保持和生境支持服务都较低,且该区降水量较少,导致水源供给服务能力也较弱。因此,亟需加强对该区森林资源的保护,及时对其环境条件与森林资源状况进行修复和优化管理。图6
 新窗口打开|下载原图ZIP|生成PPT
图6森林生态系统服务权衡(强、弱)/协同(高、低)空间分布
Fig. 6Spatial distribution of trade-offs (severe or weak) and synergies (good or bad) among ecosystem services
由表3和图6c发现,有24.56%的森林服务之间存在强权衡效应,即仅有1种服务能力较高,服务之间竞争激烈,效益冲突明显。一部分位于南坡中低山区以及鲁山南部,其水源供给占主导优势;其次零星分布在北坡栾川、嵩县和卢氏境内,多为油松人工林和飞播林区,海拔较高,人为干扰弱,生境质量较高,但其他服务都较低。由表3和图6d发现,弱权衡区面积比重较大(36.5%),至少有2种服务处于高值水平,但至少有1种处于低值水平。一部分位于北坡较高海拔区,蓄积量、固碳等服务能力较高,但降水量少,干燥度指数大,导致水源供给能力弱;另一部分零星地分布在南坡中低山区,其水源供给和蓄积量服务能力较强,而生境支持和土壤保持服务较弱。
综上,研究区有28.79%的森林服务之间存在高协同效应,但仍有71.21%的森林5种服务之间的作用关系还不够理想。由此,研究区服务整体效益较低,未来应将低协同和强权衡区作为森林资源管理和效益调控的重点对象。
3.3.2 南北坡尺度服务权衡/协同效应分析 伏牛山北坡和南坡森林生态系统服务权衡与协同效应具有一定差异(图7a、图7b),均为高协同区占比重最大,但南坡(37.09%)明显高于北坡(22.32%);低协同区则为北坡(17.06%)明显高于南坡(1.24%),由此南坡服务之间协同关系优于北坡。其次,北坡分别有17.51%和17.39%的区域为3种服务(蓄+碳+生)和2种服务(碳+生)协同主导,与其余服务呈弱权衡关系;而南坡则是水源供给单一服务主导占比重较大(34.6%),存在强权衡关系。
图7
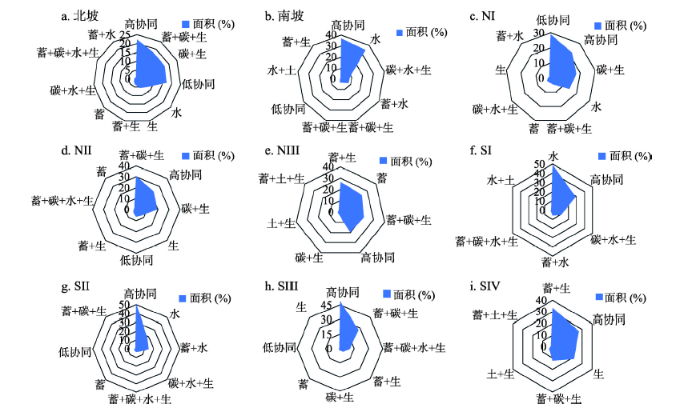 新窗口打开|下载原图ZIP|生成PPT
图7南北坡和垂直带尺度森林生态系统服务权衡与协同效应
Fig. 7Ecosystem service trade-off and synergy on the north and south slopes and on the vertical belt scale
3.3.3 垂直带尺度服务权衡/协同效应分析 不同垂直带服务权衡与协同效应也存在明显差异(图7c~图7i)。北坡低山落叶阔叶林带(NI)(图7c),有28.95%的区域服务之间存在低协同效应;22.05%的区域存在高协同关系;17.27%的区域为固碳+生境支持服务协同主导,14.45%的区域为水源供给单一服务主导。北坡中山落叶阔叶林带(NII)(图7d),蓄积量+固碳+生境支持服务协同主导、高协同及固碳+生境支持服务协同主导分别占30.58%、22.94%和19.31%,可见2种及2种以上服务协同主导面积比重较大,因此该垂直带服务之间协同关系良好。中山针阔混交林带(NIII)(图7e),蓄积量+生境支持服务协同主导、蓄积量单一服务主导以及蓄积量+固碳+生境支持服务协同主导面积分别占26.71%、24.31%和21.24%;高协同区占19.58%,略低于前两个垂直带。由此,NII服务之间协同关系最好;NI低协同区占比重较大,亟待进行低效林改造和优化管理,并考虑蓄积量和土壤保持服务的提升;NIII要注重水源供给和土壤保持服务的提升。
南坡低山落叶阔叶林带(SI)(图7f),水源供给单一服务主导占比最大(48.95%);其次为高协同区(28.98%);固碳+水源供给+生境支持服务协同主导占10.63%。南坡含常绿树种的针阔混交林带(SII)(图7g)和中山落叶阔叶林带(SIII)(图7h),高协同区占比相当(约50%);其次,SII水源供给单一服务主导与蓄积量+水源供给2种服务协同主导占32.17%,而SIII内3种(蓄+碳+生)和4种(蓄+碳+水+生)服务协同主导占37.71%,可见SIII服务之间的协同关系优于SII。中山针阔混交林带(SIV)(图7i),蓄积量+生境支持服务协同主导占比重最大(33.52%);其次为高协同区(26.74%);生境支持单一服务主导、蓄积量+固碳+生境支持服务协同主导分别占21.61%和12.24%。由此,SIII服务之间协同关系最好,SII次之,SI要注重提升蓄积量和土壤保持服务,SIV要注重提升水源供给和土壤保持服务。
综上,南坡中山落叶阔叶林带(SIII)服务之间协同关系最好,北坡低山落叶阔叶林带(NI)服务之间协同关系最差。
4 结论与讨论
4.1 结论
(1)研究区森林生态系统平均蓄积量为49.26 m3/hm2,碳密度为156.94 t/hm2,供水深度为494.46 mm,土壤保持量为955.4 t/hm2,生境质量指数为0.79。(2)不同分级区内服务供给能力存在一定差异。土壤保持服务变化幅度较大,高值区约是中值区和低值区的3倍和10倍,其余4种服务变化幅度相对较小,高值区约是低值区的1~2.5倍。由此,应亟需加强土壤保持服务中低值区的林分改造,或采取工程措施提升土壤保持服务,以充分发挥研究区森林生态系统土壤保持服务的潜力。
(3)区域尺度上,有28.79%的森林服务之间表现为高协同效应,有10.15%的森林存在低协同效应,有61.06%的森林存在强权衡和弱权衡效应。由此,研究区森林生态系统服务整体效益还较低,服务之间的作用关系还不够理想。未来应将低协同和强权衡区作为森林资源管理和效益调控的重点对象。
(4)南北坡尺度上,南坡服务之间的协同关系优于北坡。垂直带尺度上,SIII服务之间协同关系最好,NI协同关系最差。
4.2 讨论
本文从区域、南北坡和垂直带3种空间尺度出发,运用空间叠置法判别5种森林生态系统服务之间的权衡与协同效应,该方法可以识别多种服务之间权衡关系发生的特定区域[17],有助于权衡管理决策与特定空间位置相对应,从而更加有效地实施森林资源管理。研究发现伏牛山地区有71.21%的森林5种服务之间的作用关系还不够理想,不同空间尺度存在不同程度、不同类型的效益冲突,亟需进行分区域、分类型的管理权衡。就南北坡尺度而言,南坡服务之间的协同关系优于北坡,北坡水源供给能力较弱是导致服务之间权衡发生的主要原因,而南坡水源供给单一服务主导占据明显优势,因此在进行低效林改造时,北坡需要考虑结合气候背景和立地条件,采取科学管理方案或工程措施提升水源供给服务,而南坡则应注意监测森林结构变化对水源供给服务的影响。就垂直带尺度而言,北坡低山落叶阔叶林带(NI)内服务之间的协同关系最差,亟需进行优化管理,这些地区位于北坡山麓地带,5种服务供给能力都较弱。针对这些地区的森林资源,应加强保护,禁止乱砍乱伐,一方面可通过增加成熟林和近成熟林比例,提升森林蓄积量、固碳和生境支持服务水平,另一方面可通过结合气候背景和立地条件,采取工程措施,提升水源供给和土壤保持服务。其次,南坡低山落叶阔叶林带(SI)内服务之间强权衡区占据明显优势,也亟待进行优化管理。具体来看,SI内降水量充沛,且大多位于河流的中下游地区,海拔较低,汇水量大,因此该区水源供给能力达到最大,但由于该区地形起伏相对平缓,人为活动频繁,林分质量不高,多为栓皮栎林、阔杂林和马尾松林等林龄较小的次生林和人工林,因此其余4种服务供给能力都相对较弱,导致服务之间强权衡关系显著。针对这些地区,一方面要加强对次生林和人工林的管理,推广针阔混交林代替纯林,提升蓄积量、固碳、土壤保持和生境支持服务的供给能力,以缓解服务之间的强权衡关系;另一方面还应结合当地经济发展需要,引入生态补偿措施,或协助转变该区粗放型的农业生产方式,做好森林资源的维护和监管,以提升服务整体效益。
以上讨论了伏牛山地区森林资源分区域、分类型的权衡管理策略,但是这些策略多是宏观尺度上的建议,有助于为不同空间尺度上森林资源的管理目标提供导向和科学依据。未来的森林资源管理还需要结合森林生态学知识,并考虑当地环境条件,因地制宜地制定管理方案。此外,本文未对服务之间权衡关系的驱动机制进行定量探讨,明确自然过程和社会经济发展过程对服务权衡关系的驱动机制有助于制定科学高效的管理方案[6]。因此,未来应定量探讨自然环境因素、社会经济因素以及森林资源管理行为对服务之间权衡关系的影响程度及差异,厘清服务之间权衡关系的主要驱动因素,为生态系统服务管理筛选最适宜的自然环境条件、社会经济条件及森林资源管理行为,以改进森林资源管理方式,促进研究区森林生态系统多种服务的可持续供给,从而实现森林资源的可持续经营与管理。
参考文献 原文顺序
文献年度倒序
文中引用次数倒序
被引期刊影响因子
DOI:10.11821/dlxb201807007URL [本文引用: 1]

Runoff generation is an important part of water conservation service, and also plays a critical role in soil and water retention. Under the background of the ecosystem degradation, which was caused by the vulnerable karst ecosystem combined with human activity, it is necessary to understand the spatial pattern and impact factors of runoff services in the karst region. The typical karst peak-cluster depression was selected as the study area. And the calibrated and verified Soil and Water Assessment Tool (SWAT) was one of the main techniques to simulate the runoff services of typical karst basin. Further, the spatial variability of different services were analyzed with the assistance of the methods of gradient analysis and local regression. Results indicated that the law of spatial difference was obvious. And the surface runoff was at a low level, but the groundwater runoff was rich (about 2-3 times the surface runoff). The runoff coefficients of total and groundwater were 70.0% and 23.9%, respectively. Terrain is a significant factor contributing to macroscopic control effect on the runoff service in the Sanchahe River Basin, where the total and groundwater runoff increased significantly with the rising elevation and slope. Then, the distribution of vegetation has great effects on surface runoff. There were spatial differences between the forest land in the upstream and orchard land in the downstream, in turn the surface runoff presented a turning point due to the influence of vegetation. Moreover, the results of spatial overlay analysis showed that the highest value of total and groundwater runoff was observed in the forest land. It is not only owing to the stronger capacity of soil water conservation of forest ecosystem, and geologic feature of rapid infiltration in this region, but also reflected the combined effects on the land cover types and topographical features, that is, forest land was mostly distributed in the area with relatively great elevation and slope. Overall, this study will promote the development and innovation of ecosystem services fields in the karst region, and further provide a theoretical foundation for ecosystem restoration and reconstruction.
DOI:10.11821/dlxb201807007URL [本文引用: 1]
Runoff generation is an important part of water conservation service, and also plays a critical role in soil and water retention. Under the background of the ecosystem degradation, which was caused by the vulnerable karst ecosystem combined with human activity, it is necessary to understand the spatial pattern and impact factors of runoff services in the karst region. The typical karst peak-cluster depression was selected as the study area. And the calibrated and verified Soil and Water Assessment Tool (SWAT) was one of the main techniques to simulate the runoff services of typical karst basin. Further, the spatial variability of different services were analyzed with the assistance of the methods of gradient analysis and local regression. Results indicated that the law of spatial difference was obvious. And the surface runoff was at a low level, but the groundwater runoff was rich (about 2-3 times the surface runoff). The runoff coefficients of total and groundwater were 70.0% and 23.9%, respectively. Terrain is a significant factor contributing to macroscopic control effect on the runoff service in the Sanchahe River Basin, where the total and groundwater runoff increased significantly with the rising elevation and slope. Then, the distribution of vegetation has great effects on surface runoff. There were spatial differences between the forest land in the upstream and orchard land in the downstream, in turn the surface runoff presented a turning point due to the influence of vegetation. Moreover, the results of spatial overlay analysis showed that the highest value of total and groundwater runoff was observed in the forest land. It is not only owing to the stronger capacity of soil water conservation of forest ecosystem, and geologic feature of rapid infiltration in this region, but also reflected the combined effects on the land cover types and topographical features, that is, forest land was mostly distributed in the area with relatively great elevation and slope. Overall, this study will promote the development and innovation of ecosystem services fields in the karst region, and further provide a theoretical foundation for ecosystem restoration and reconstruction.
DOI:10.5846/stxbURL [本文引用: 3]
DOI:10.5846/stxbURL [本文引用: 3]
DOI:10.1016/j.ecocom.2018.09.003URL [本文引用: 2]
DOI:10.11821/dlxb201805007URL [本文引用: 2]
Bailongjiang watershed in Gansu belongs to the upper reaches of Yangtze River water conservation area and the environment fragile area with frequent landslides and debris flow. Recently, the high-intensive human activities have caused the deterioration of natural systems. Therefore, it is of great significance to study the changes of ecosystem services and its trade-offs. In this paper, the spatial and temporal changes, spatial aggregation and the trade-offs/synergies between ecosystem services from 1990 to 2014 were quantitatively analyzed via the ecosystem service change index, spatial autocorrelation and correlation coefficient. The results showed that the ESCI ranges of the four typical ecosystem services types, namely, water yield, carbon storage, soil conservation and crop production were different from 1990 to 2014 with the difference of spatial distribution. There are spatial autocorrelation in four typical ecosystem services with obvious clustering characteristics. The cluster character and agglomeration of positive correlation of the local scale is strong, the agglomeration of the negative correlation type is low and scattered, and the spatial heterogeneity is significant. There is a negative correlation trade-offs between the two provisioning services (water yield and crop production), and positive correlation synergies between the two regulating services (carbon stocks and soil conservation). The relationships between the provisioning and regulating services have both trade-offs and synergies. There were both strong positive correlation synergies between water yield and soil conservation, and between water yield and carbon storage, and there were weak negative correlation trade-offs between soil conservation and crop production. As for the numerical relation, the trade-offs/synergies of ecosystem service changed differently in terms of Moran's I and correlation coefficient. There is significant heterogeneity of trade-offs/synergies between ecosystem services on the spatial pattern.
[本文引用: 1]
DOI:10.11867/j.issn.1001-8166.2015.11.1250URL [本文引用: 2]
Trade-offs and synergies -widely exist among ecosystem services, which is the core of ecology, geography and resources sciences. Deepening the understandings of the spatial characteristics, driving mechanism, and scale effects of trade-offs and synergies will no doubt shed light on human well-being and the “win-win” policy of environment and human. This paper identified the norms related to trade-offs and synergies of eco-services, and then clarified the theoretical foundation of this topic was clarified. Following that, the driving mechanism and scale effects of trade-offs and synergies of eco-services were investigated. Finally, we proposed future direction and questions for research work, including improving classification and assessment method on ecosystem services, expanding quantitative approaches on trade-offs and synergies of eco-system, and policy oriented ideology to sustainable development of environment and human.
DOI:10.1016/j.scitotenv.2018.04.046URL [本文引用: 2]
DOI:10.1038/s41598-016-0028-xURL [本文引用: 1]
DOI:10.11821/dlxb201711011URL
The research on the interactions among multiple ecosystem services (ES) is a hotspot. Most of the previous studies focused on the qualitative description of ES interactions, however, there have been relatively few studies on spatially explicit and quantitative assessment of ES interactions. In this paper, we mapped the ecosystem service of soil conservation (SC), net primary production (NPP) and water yield (WY) in the upper reaches of Hanjiang River Basin (URHR) based on the land use and land cover (LULC), NDVI, soil properties and observed climate data covering 2000-2013. Moreover, we quantitatively assessed the variation characteristics of interactions among different ES with a spatio-temporal statistical framework by applying the partial correlation analysis at a pixel scale. The results are shown as follows: (1) From 2000 to 2013, the mean annual SC was 434.20 t·hm-2·yr-1, and the mean annual WY was 250.34 mm. They also presented a rising tendency at the rate of 16.10 t·hm-2·yr-1 and 3.79 mm·yr-1, respectively. However, the mean annual NPP was 854.11 gC·m-2·yr-1, and presented a decreasing tendency at the rate of 8.54 gC·m-2·yr-1. (2) Spatially, SC was high in the North-South mountain area, while it was low in the Middle valley region. Similarly, the NPP in the Middle valley region was lower than that of other regions. However, the WY increased from north to south. (3) The three pairwise ES presented different interactions. Both the interaction between SC and NPP and that between SC and WY presented as trade-off, accounting for 62.77% and 71.60% of the total area, respectively. On the contrary, the interaction between NPP and WY was prone to synergies, accounting for 62.89% of the total area. (4) Pairwise ES in different land cover types also presented a different interaction. As for woodland, wetland, cropland, artificial land and bare land, SC and NPP, as well as SC and WY both presented trade-off, while WY and NPP presented synergy. Specially, in grassland, all the three pairwise ES presented a trade-off relationship. Therefore, spatially explicit and quantitative assessment of ES interactions are more helpful for revealing the temporal non-linear evolution, and the spatial heterogeneity of ES interactions. This analysis framework also contributes to the regional sustainable land management and the optimization of multiple ES conservation.
DOI:10.1016/j.ecolind.2014.09.037URL [本文引用: 1]
DOI:10.1007/s10661-014-4167-xURL [本文引用: 1]
DOI:10.1016/j.gloplacha.2012.12.014URL [本文引用: 1]
Due to the lengthy historic land use by humans and the climate change characterized by warming and drying, the Loess Plateau has been plagued by ecosystem degradation for a long time. A series of ecological conservation projects launched since the 1970s altered the land use pattern greatly, and exerted a profound influence on the ecosystem services. Based on the Integrated Valuation of Ecosystem Services and Tradeoffs (InVEST) and Carnegie-Ames-Stanford Approach (CASA) models, we assessed the historical fluctuation of sediment control, water yield, and net primary production (NPP) in the Loess Plateau. The results showed that sediment retention was greatly consolidated indicated by the sharp decrease of sediment export. Water yield decreased at first and increased later. Both sediment export and water yield showed an increasing 'spatial homogenization' tendency during the period. NPP was steady between 1990 and 2000, and then increased greatly after 2000. Ecosystem services are interlinked closely and complexly. Correlation analyses indicated a positive relationship between the difference in sediment export and water yield (r(2)=0.776**) from 1975 to 2008, with negative correlations between the difference of NPP and water yield (r(2)=-0.422**)/sediment export (r(2)=-0.240*) from 1990 to 2008. This, to some extent, implies that there are tradeoffs between the services of water yield and sediment control/NPP, and there is synergy between sediment control and NPP. Climatic and land use changes are the major drivers on ecosystem services fluctuation. Correlation analyses showed that the decrease of precipitation significantly hindered water yield (r(2)=0.980**) and sediment export (r(2)=0.791**). The increase of temperature exerted a slight negative influence on water yield (r(2)=-0350**). A spatial concordance existing between the 'cropland to grass/woodland' area and the high sediment control (r(2)=0313**)/NPP (r(2)=0.488**) area indicated that the land use change from cropland to woodland/grassland significantly consolidated sediment control and NPP production. The observed spatio-temporal variation of ecosystem services and their correlations provide an operable criterion for land use management policies. (C) 2013 Elsevier B.V.
[本文引用: 2]
[本文引用: 2]
DOI:10.11821/dlxb201706002URL [本文引用: 3]
As a hot spot in geography, ecology and related disciplines, ecosystem services have been playing a vital role in bridging the human society with the ecosystem. A deep understanding of the relationship among ecosystem services is a critical enabling factor for sustainable management and decision-making in multiple ecosystem services, in turn realizing the dual goals of economic development and ecological protection and thus contributing to the overall wellbeing of human. Through a systematic review of the concept of ecosystem service trade-offs, this article explores their characteristics in terms of spatial scales, temporal scales and reversibility, considering human's wellbeing at different levels as the ultimate goal of ecosystem service trade-offs and ecological compensation as a baseline method of protection in trade-offs. Such ecosystem services trade-offs are expressed by quantitative indexing and integrated modelling. While such trade-offs and synergies among ecosystem services could present significant variations by spatial and temporal scales, scenario simulation and multi-objective analysis are effective ways to support decision-making in ecosystem service trade-offs. Based on these findings, the multi-scale correlation of ecosystem service trade-offs, the flow of ecosystem service based on telecoupling, and the consumption and compensation of ecosystem services are identified to be the main directions for future research on ecosystem service trade-offs.
DOI:10.1038/s41893-018-0175-0URL [本文引用: 2]
DOI:10.3390/f5061409URL [本文引用: 4]
DOI:10.5814/j.issn.1674-764x.2016.06.004URL [本文引用: 1]
As the major component of terrestrial ecosystems, forests play an irreplaceable role in providing ecosystem services and products (e.g. biodiversity, carbon sequestration, water yield and timber). Spatially quantifying ecosystem services and interactions will shed light on sustainable forest management. Main forest ecosystem services including carbon storage, water yield, soil retention and wood volume in the Ganjiang River Basin (GRB) were evaluated and mapped through the integrated use of InVEST3.1.0, CASA modeling and ArcGIS10.2, and relationships between forest ecosystem services and natural or social-economic factors were quantified and discussed based on ArcGIS10.2 and SPSS19.0. Results showed that the spatial pattern of the four ecosystem services is heterogeneous. Forests dominated by broad-leaved forest and bamboo forest in mountainous regions around the GRB provided the largest carbon storage and wood volume services, while forests dominated by Masson pine plantations or Chinese fir plantations in the northeast provided the largest water yield service. The spatial pattern of the soil retention service is more discrete than others, and forests in the southwestern regions showed larger soil erosion modulus than in the northeastern regions. Ecosystem services are closely related to the environmental process and human activities. With altitude or slope increases, the carbon storage and wood volume of forests increased and water yield depth and soil retention decreased. When the regional total population decreased or GDP per capita increased, carbon storage and wood volume increased. Further research into the interactions between environmental factors and ecosystem services is needed in order to understand environmental constraints when dealing with ecological problems.
[本文引用: 3]
DOI:10.11821/dlxb201801013URL [本文引用: 1]
The tradeoffs and optimizations of ecosystem services are the key research fields of ecology and geography. As the most important and complex ecosystem in terrestrial ecosystems, forest ecosystem plays a very important part in the biogeochemical cycle which include terrestrial carbon cycle and water cycle, and also provides numerous ecosystem services that are crucial to human wellbeing. China has the largest plantation area worldwide. Under the background of global warming, there are more and more concerns on timber production and carbon storage of plantations, nevertheless, they have a relationship of restricting each other. Thus, it is necessary to maximize the overall benefit of timber production and carbon storage for forest ecological development in China. We selected the Huitong National Research Station of Forest Ecosystem as our study area, and used permanent sample plot data of plantations and InVEST model to evaluate timber production and carbon storage quantitatively. Then, we constructed a conceptual framework of forest ecosystem service tradeoffs under different management regimes. Lastly, tradeoffs countermeasures for optimizing overall benefits of ecosystem services were put forward. The results showed that: (1) When timber production increased with harvesting intensity over the entire 100 year planning horizon, carbon storage decreased. There were tradeoffs between timber production and carbon storage according to the significant negative relationship. (2) When the overall benefits of timber production and carbon storage increased with harvesting intensity, the value of tradeoffs decreased. T1 and T2 scenarios, with harvesting intensity of 10%-20% every 10 years, were the optimum management regime for timber production and carbon storage to gain more benefits and less tradeoffs. (3) The current harvesting intensity in Huitong County was slightly higher than the optimum harvesting intensity. On practical dimension, these findings suggested that obvious objectives are needed to formulate the corresponding countermeasures of tradeoffs, in order to realize the improvement of ecosystem services and the optimization of ecosystem structures.
[本文引用: 1]
DOI:10.1016/j.jenvman.2018.12.032URL [本文引用: 1]
DOI:10.1016/j.ecolecon.2010.05.013URL [本文引用: 1]
[D].
[本文引用: 5]
[D].
[本文引用: 5]
DOI:10.1016/j.scitotenv.2016.03.061URL [本文引用: 2]
DOI:10.1016/j.landusepol.2016.02.006URL [本文引用: 1]
DOI:10.1007/s10531-016-1135-5URL [本文引用: 1]
DOI:10.1017/S0376892916000448URL [本文引用: 2]
[本文引用: 1]
[本文引用: 1]
[本文引用: 1]
[本文引用: 1]
[本文引用: 1]
[D].
[本文引用: 1]
[D].
[本文引用: 1]
[本文引用: 1]
[本文引用: 1]
[D].
[本文引用: 1]
[D].
[本文引用: 1]
DOI:10.1007/s11442-019-1588-zURL [本文引用: 2]
This paper reports the phenological response of forest vegetation to climate change (changes in temperature and precipitation) based on Moderate Resolution Imaging Spectroradiometer (MODIS) Enhanced Vegetation Index (EVI) time-series images from 2000 to 2015. The phenological parameters of forest vegetation in the Funiu Mountains during this period were determined from the temperature and precipitation data using the Savitzky-Golay filter method, dynamic threshold method, Mann-Kendall trend test, the Theil-Sen estimator, ANUSPLIN interpolation and correlation analyses. The results are summarized as follows: (1) The start of the growing season (SOS) of the forest vegetation mainly concentrated in day of year (DOY) 105-120, the end of the growing season (EOS) concentrated in DOY 285-315, and the growing season length (GSL) ranged between 165 and 195 days. There is an evident correlation between forest phenology and altitude. With increasing altitude, the SOS, EOS and GSL presented a significant delayed, advanced and shortening trend, respectively. (2) Both SOS and EOS of the forest vegetation displayed the delayed trend, the delayed pixels accounted for 76.57% and 83.81% of the total, respectively. The GSL of the forest vegetation was lengthened, and the lengthened pixels accounted for 61.21% of the total. The change in GSL was mainly caused by the decrease in spring temperature in the region. (3) The SOS of the forest vegetation was significantly partially correlated with the monthly average temperature in March, with most correlations being negative; that is, the delay in SOS was mainly attributed to the temperature decrease in March. The EOS was significantly partially correlated with precipitation in September, with most correlations being positive; that is, the EOS was clearly delayed with increasing precipitation in September. The GSL of the forest vegetation was influenced by both temperature and precipitation throughout the growing season. For most regions, GSL was most closely related to the monthly average temperature and precipitation in August.
[本文引用: 1]
[本文引用: 1]
DOI:10.1007/s11442-014-1087-1URL [本文引用: 2]
Based on the GIMMS AVHRR NDVI data (8 km spatial resolution) for 1982-2000,the SPOT VEGETATION NDVI data (1 km spatial resolution) for 1998-2009,and observational plant biomass data,the CASA model was used to model changes in alpine grassland net primary production (NPP) on the Tibetan Plateau (TP). This study will help to evaluate the health conditions of the alpine grassland ecosystem,and is of great importance to the promotion of sustainable development of plateau pasture and to the understanding of the function of the national ecological security shelter on the TP. The spatio-temporal characteristics of NPP change were investigated using spatial statistical analysis,separately on the basis of physico-geographical factors (natural zone,altitude,latitude and longitude),river basin,and county-level administrative area. Data processing was carried out using an ENVI 4.8 platform,while an ArcGIS 9.3 and ANUSPLIN platform was used to conduct the spatial analysis and mapping. The primary results are as follows:(1) The NPP of alpine grassland on the TP gradually decreases from the southeast to the northwest,which corresponds to gradients in precipitation and temperature. From 1982 to 2009,the average annual total NPP in the TP alpine grassland was 177.2×10¹² gC yr-1(yr represents year),while the average annual NPP was 120.8 gC m-2 yr-1. (2) The annual NPP in alpine grassland on the TP fluctuates from year to year but shows an overall positive trend ranging from 114.7 gC m-2 yr-1 in 1982 to 129.9 gC m-2 yr-1 in 2009,with an overall increase of 13.3%;32.56% of the total alpine grassland on the TP showed a significant increase in NPP,while only 5.55% showed a significant decrease over this 28-year period. (3) Spatio-temporal characteristics are an important control on annual NPP in alpine grassland:a) NPP increased in most of the natural zones on the TP,only showing a slight decrease in the Ngari montane desert-steppe and desert zone. The positive trend in NPP in the high-cold shrub-meadow zone,high-cold meadow steppe zone and high-cold steppe zone is more significant than that of the high-cold desert zone;b) with increasing altitude,the percentage area with a positive trend in annual NPP follows a trend of "increasing-stable-decreasing",while the percentage area with a negative trend in annual NPP follows a trend of "decreasing-stable-increasing",with increasing altitude;c) the variation in annual NPP with latitude and longitude co-varies with the vegetation distribution;d) the variation in annual NPP within the major river basins has a generally positive trend,of which the growth in NPP in the Yellow River Basin is most significant. Results show that,based on changes in NPP trends,vegetation coverage and phonological phenomenon with time,NPP has been declining in certain places successively,while the overall health of the alpine grassland on the TP is improving.
[本文引用: 1]
[本文引用: 1]
[本文引用: 1]
[本文引用: 1]
[本文引用: 1]
[本文引用: 4]
URL [本文引用: 1]
Aims The objective of this study was to understand the distribution patterns of carbon stock in forest ecosystems in Shaanxi province following the implementation of the ecological restoration project — the Grain for Green — in the 90’s of 20th century for combating the severe soil erosion and other environment problems.Methods Based on forest resource inventory data and field-sampling measurement, we estimated carbon storage of tree, shrub, herb, litter, and soil layer within each forest ecosystem of Shaanxi province.Important findings Forest ecosystems in Shaanxi province stored a total of 790.75 Tg C, and the proportion occupied by soil, vegetation and litter carbon were 72.14%, 26.52% and 1.34%, respectively. Carbon storage within Quercus spp. was the highest (44.17%) among all forest types. Given the large proportion of the areas occupied, the young and middle-aged forests accounted for almost half of the total carbon stores in forest ecosystems. The average carbon density of forest ecosystem was 123.70 t?hm–2. Similar to the patterns among carbon pools, carbon density was also highest in soil, lowest in litter, and medium in vegetation for each forest type. Carbon density increased with stand age for natural and planted forest ecosystems, and was higher in the natural forest ecosystems than in the planted forests within the same stand ages. Differences in the spatial patterns between carbon stores and density indicate that carbon storage is related not only to forest quality, but also to forest areas. Therefore we could select tree species with high carbon concentration for reforestation and afforestation, and improve forest management practices to increase carbon sequestration potential, which would be beneficial to mitigation of global climate change.
[本文引用: 1]
[本文引用: 1]
DOI:10.1007/BF02873101URL [本文引用: 1]
The available soil water capacity (ASWC) is important for studying crop production, agro-ecological zoning, irrigation planning, and land cover changes. Laboratory determined data of ASWC are often not available for most of soil profiles and the nationwide ASWC largely remains lacking in relevant soil data in China. This work was to estimate ASWC based on physical and chemical properties and analyze the spatial distribution of ASWC in China. The pedo-transfer functions (PTFs), derived from 220 survey data of ASWC, and the empirical data of ASWC based on soil texture were applied to quantify the ASWC. GIS technology was used to develop a spatial file of ASWC in China and the spatial distribution of ASWC was also analyzed. The results showed the value of ASWC ranges from 15 × 10−2 cm3·cm−3 to 22 × 10−2 cm3·cm−3 for most soil types, and few soil types are lower than 15 × 10−2 cm3·cm−3 or higher than 22 × 10−2 cm3·cm−3. The ASWC is different according to the complex soil types and their distribution. It is higher in the east than that in the west, and the values reduce from south to north except the northeastern part of China. The ‘high’ values of ASWC appear in southeast, northeastern mountain regions and Northeast China Plain. The relatively ‘high‘ values of ASWC appear in Sichuan basin, Huang-Huai-Hai plain and the east of Inner Mongolia. The relatively ‘low’ values are distributed in the west and the Loess Plateau of China. The ‘very low’ value regions are the northern Tibetan Plateau and the desertified areas in northern China. In some regions, the ASWC changes according to the complex topography and different types of soils. Though there remains precision limitation, the spatial data of ASWC derived from this study are improved on current data files of soil water retention properties for Chinese soils. This study presents basic data and analysis methods for estimation and evaluation of ASWC in China.
[本文引用: 1]
DOI:10.1016/S0933-3630(96)00114-6URL [本文引用: 1]
[本文引用: 1]
[本文引用: 1]
[本文引用: 1]
[D].
[本文引用: 1]
DOI:10.11821/dlxb201903005URL [本文引用: 1]
It is of great significance to analyze the main environmental issues, coupled with their spatial heterogeneity, and divide the ecological function zones to achieve ecological security and optimization of territory development in a certain region. In recent years, ecological function zoning, widely concerned by scholars, has played a vital role in regional ecosystem management and sustainable development. There arose a problem that the spatial characteristics of ecological functions were hard to be reflected in the previous studies based on spatial average data over basins or geopolitical regions such as counties, cities and provinces. This paper, using the approaches of coupling self-organizing feature map (SOFM) and support vector machine (SVM), attempts to develop an automatic demarcation and zoning approach, and explores the best possible division of ecological functions in the city of Ordos with the index system of ecological function zoning in mind involving the ecosystem services as well as ecological sensitivity. Ordos, which is located in the transitional zone between temperate grasslands and desserts, has become a key research area of global terrestrial ecosystem. The ecological functional zoning indexes indicate that there appears an obvious spatial heterogeneity of ecosystem functions in Ordos. Accordingly, land grids have been clustered into 7 ecological function types by SOFM with clustering quality index (CQI) in view. Hence, Ordos has been divided into 11 ecological function zones owing to the implementation of SVM to identify the optimal division borders, in which the border demarcation is treated as a classification system in spatial domain. The optimal combination of SVM hyperparameters is determined by grid search method. In this study, machine learning algorithm has been adopted to cope with the situation where the bottom-up physical regionalization might weaken the spatial position attribute of the partition features, and to realize the quantitative conversion from classification to partition. It has turned out that such SOFM-SVM-coupled zoning approach could effectively improve the spatial accuracy of the partition, which can be considered as a new way to realize the automatic ecological zoning.
