 ,1,3,4, 韩剑桥1,3, 史尚渝3,5, 丁文斌1
Contribution of climatic change and human activities to vegetation NDVI change over China during 1982-2015
JIN Kai1,2, WANG Fei,1,3,4, HAN Jianqiao1,3, SHI Shangyu3,5, DING Wenbin1通讯作者:
收稿日期:2019-09-18修回日期:2020-03-3网络出版日期:2020-05-25
| 基金资助: |
Received:2019-09-18Revised:2020-03-3Online:2020-05-25
| Fund supported: |
作者简介 About authors
金凯(1988-),男,山东平邑人,博士,讲师,主要从事土地利用/覆被变化及其生态效应研究E-mail:jinkai-2014@outlook.com;jinkai@qau.edu.cn。

摘要
关键词:
Abstract
Keywords:
PDF (5439KB)元数据多维度评价相关文章导出EndNote|Ris|Bibtex收藏本文
本文引用格式
金凯, 王飞, 韩剑桥, 史尚渝, 丁文斌. 1982—2015年中国气候变化和人类活动对植被NDVI变化的影响. 地理学报[J], 2020, 75(5): 961-974 doi:10.11821/dlxb202005006
JIN Kai.
1 引言
近半个世纪以来,随着气候变化和人类活动的不断加剧,全球自然生态系统已遭受严重威胁[1]。作为地球陆地生态系统最重要的组分之一,植被具有连接大气、土壤和水文等生态要素的作用,可为自然生态系统和人类生产生活提供强有力的保障[2,3,4,5]。目前,对大尺度、长时期的植被变化进行监测和归因分析已成为全球变化研究的重要内容,并可为人类制定合理的土地利用及生态环境保护策略等提供科学依据[6,7]。气温和降水是影响植物生长和发育的关键气候因子。以往研究表明,北半球气温上升引发的干旱是一些高纬度地区植被覆盖在20世纪80年代出现下降的重要原因[8]。在中国,近30年来的气候变暖对黄土高原中部及东南部地区的植被恢复具有促进作用,但对西北部地区的植被恢复具有抑制作用[9]。此外,人类活动对植被覆盖变化的影响也具有两面性[10]。如,城市化发展导致大量农田和林地被建设用地侵占,使植被覆盖度明显下降[11];实施退耕还林还草等植被建设工程则有利于植被覆盖增加[12]。因此,人类活动和气候变化均能够对植被变化产生影响,并可能导致全球不同区域植被覆盖变化出现明显差异[6]。
以往研究常借助基于遥感的植被指数数据分析大尺度植被变化,其中对归一化植被指数(Normalized Difference Vegetation Index, NDVI)的应用最多[5,6,7,8,9]。NDVI与绿叶密度、光合有效辐射、植被生产力以及累积生物量等呈线性或近线性关系,是公认的反映大尺度地表植被覆盖和生长状况的有效指标[13,14,15,16]。目前最常用的NDVI数据包括SPOT-VGT NDVI[11]、AVHRR NDVI[17]和MODIS NDVI[18]。3种NDVI产品在传感器、光谱响应函数、校正及数据处理方法、合成时间及时空分辨率等方面均存在一定差异[19,20]。其中,AVHRR NDVI产品已经过数次更新换代,拥有较长的时间序列;SPOT-VGT和MODIS NDVI产品的时间序列较短,但空间分辨率较高。虽然不同NDVI产品的应用可能会使研究结果产生一定差异,但其在大尺度植被覆盖变化及其成因分析、土地覆盖识别以及植被生产力计算等方面仍有明显优势。
中国气候变化存在很大空间异质性,区域平均气温显著升高[21],而降水量无明显变化[22]。由于不同地区水热条件和植被类型不同,植被变化及其对气候变化的响应也存在很大空间差异[3]。此外,自20世纪末中国制定并实施了多项植被建设和生态保护工程,极大地促进了植被恢复。有关中国植被变化的研究多聚焦于青藏高原[23]、黄土高原[24]等生态脆弱区以及东北[25]和华北[26]等人类活动密集区,这些研究对于认识中国各区域植被变化的特征及驱动因素等具有重要价值。但以往研究常采用相关性分析等方法对植被变化的动因进行定性分析[12],很少对不同驱动因素的影响加以区分和量化。针对这一问题,Piao等[27]和邓晨晖等[28]采用预测模型对不同驱动力条件下的植被变化进行了定量模拟研究。目前,针对全国范围的植被长期变化及其归因分析仍然较少,人类活动对中国植被变化的影响及区域差异尚不完全清楚。因此,有必要在全国范围内开展植被变化的归因研究和相应贡献的量化。
鉴于此,本文基于中国603个地面气象站的气温、降水资料以及具有长时间序列的GIMMS NDVI3g数据集,采用变化趋势分析和多元回归残差分析等方法在像元、省域和全国尺度上探讨了1982—2015年中国植被NDVI变化的基本特征及其受气候变化和人类活动的影响,并对两种驱动因素的相对贡献进行了评估。
2 数据与方法
2.1 研究区概况
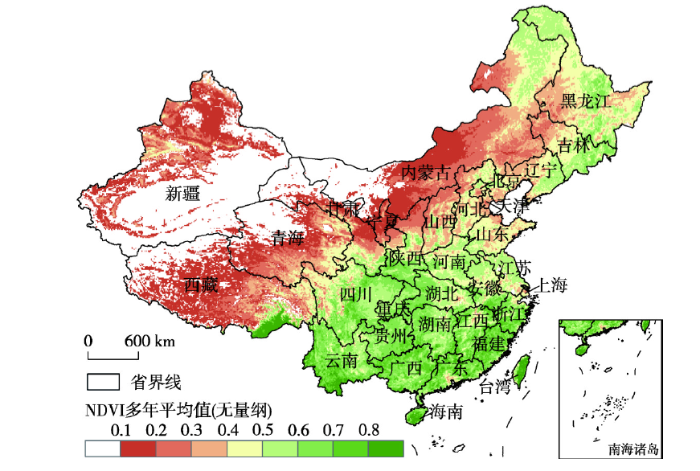
中国地域辽阔,陆地面积约为960万km2,共有34个省级行政区,本研究统计和分析时选用了中国32个行政区(不包括香港和澳门特别行政区)。从干湿地区划分看,中国东南部主要为半湿润和湿润地区,而西北部主要为干旱和半干旱地区[29]。从气候类型看,中国东部和西北地区分别属季风气候和温带大陆性气候,而西南部的青藏高原属高寒气候。中国植被覆盖类型及其分布复杂多样,整体上,中国西北地区的植被覆盖度远低于东南部地区(图1)。图1
 新窗口打开|下载原图ZIP|生成PPT
图1中国植被覆盖状况及行政区划空间分布
Fig. 1Spatial distribution of vegetation cover and administrative regions in China
2.2 数据
1982—2015年的气温和降水数据来自于中国气象数据共享服务网《中国地面气候资料日值数据集(V 3.0)》(NDVI数据来自GIMMS NDVI3g V1.0数据集(
2.3 方法
2.3.1 数据预处理 对气象数据的预处理主要包括气象站筛选、缺失数据插补以及数据空间插值。首先,根据数据时间跨度覆盖(即1982—2015年)筛选气象站,共计603个。然后根据线性内插法和相邻年份的数据来对缺失数据进行插补[34]。缺失数据的数量仅占存在缺失情况的气象站所有数据的0.5%,其对分析结果的影响忽略不计。最后,采用ArcGIS 10.2空间分析模块的克里金插值方法对中国生长季气温和降水量数据进行空间插值,并将其重采样为8 km分辨率。对NDVI数据的预处理包括格式转换、坐标转换、数据裁剪、月最大值提取以及NDVI真值计算等步骤。其中,NDVI月最大值数据是采用最大值合成法对15 d数据进行处理获得的[26];NDVI真值是通过将NDVI数据的像元初始数值(Digital Number, DN)乘以0.0001转化而来[35],其范围在-1~1之间。按照国际惯例[36,37],本文仅提取了多年平均NDVI大于0.1的植被覆盖区域进行分析(图1)。
此外,根据Jin等[11]和赵杰等[37]的研究,本文将中国区域的植被生长季定义为每年的4—10月,并进一步计算和生成了生长季平均气温、累计降水量和平均NDVI等空间数据序列。由于香港和澳门的陆地面积很小,在进行省域尺度的分析时未予考虑。
2.3.2 变化趋势分析 采用一元线性回归计算生长季NDVI的年际变化趋势,并将线性回归方程的斜率定义为NDVI的年际变化趋势率(slope)[34]。slope的计算公式[24]如下:
式中:slope为生长季NDVI与时间变量拟合的一元线性回归方程的斜率;i为时间变量,等于1到n的整数;n为研究时段的年数,等于34;NDVIi为第i年的生长季平均NDVI。slope < 0和slope > 0分别表示生长季NDVI序列随时间递减和递增;slope绝对值越大,表明生长季NDVI变化越快。
2.3.3 多元回归残差分析 采用多元回归残差分析方法研究人类活动和气候变化对植被NDVI变化的影响及相对贡献[38,39]。该方法主要有以下3个步骤:① 基于生长季NDVI以及插值后的气温和降水量时间序列数据,以NDVI为因变量、以气温和降水量为自变量,建立二元线性回归模型,计算模型中的各项参数;② 基于气温和降水量数据以及回归模型的参数,计算得到NDVI的预测值(NDVICC),用来表示气候因素对植被NDVI的影响;③ 计算NDVI观测值与NDVICC之间的差值,即NDVI残差(NDVIHA),用来表示人类活动对植被NDVI的影响。具体计算公式如下:
式中:NDVICC和NDVIobs分别指基于回归模型的NDVI预测值和基于遥感影像的NDVI观测值(无量纲);a、b和c为模型参数;T和P分别指生长季平均气温和累计降水量,单位分别为℃和mm;NDVIHA为残差。
2.3.4 植被NDVI变化驱动因素判定及影响 根据公式(1)计算中国1982—2015年的NDVICC和NDVIHA的线性趋势率,分别代表在气候变化和人类活动影响下的生长季NDVI变化趋势。趋势率为正表示气候变化或人类活动可促进植被NDVI的增加,对植被恢复具有促进作用;反之,表示会导致植被NDVI下降,对植被恢复具有抑制作用。为了更好地评价气候变化和人类活动对植被生长状况的影响,根据NDVICC和NDVIHA的变化趋势将两种因素的影响分为7个等级,即明显抑制、中度抑制、轻微抑制、基本无影响、轻微促进、中度促进和明显促进(表1)。此外,根据表2对中国生长季NDVI变化的主要驱动因素进行区分,计算气候变化和人类活动对生长季NDVI变化的相对贡献率[9]。
Tab. 1
表1
表1气候变化和人类活动对植被恢复的影响分级(10-3 a-1)
Tab. 1
| slope(NDVI)a | 影响程度 |
|---|---|
| < -2.0 | 明显抑制 |
| -2.0~-1.0 | 中度抑制 |
| -1.0~-0.2 | 轻微抑制 |
| -0.2~0.2 | 基本无影响 |
| 0.2~1.0 | 轻微促进 |
| 1.0~2.0 | 中度促进 |
| ≥ 2.0 | 明显促进 |
新窗口打开|下载CSV
Tab. 2
表2
表2植被NDVI变化的驱动因素判定标准及贡献率计算方法
Tab. 2
| slope(NDVIobs)a | 驱动因素 | 驱动因素的划分标准 | 驱动因素的贡献率(%) | ||
|---|---|---|---|---|---|
| slope(NDVICC)b | slope(NDVIHA)c | 气候变化 | 人类活动 | ||
| > 0 | CC & HA | > 0 | > 0 | ||
| CC | > 0 | < 0 | 100 | 0 | |
| HA | < 0 | > 0 | 0 | 100 | |
| < 0 | CC & HA | < 0 | < 0 | ||
| CC | < 0 | > 0 | 100 | 0 | |
| HA | > 0 | < 0 | 0 | 100 | |
新窗口打开|下载CSV
3 结果
3.1 植被NDVI时空变化特征
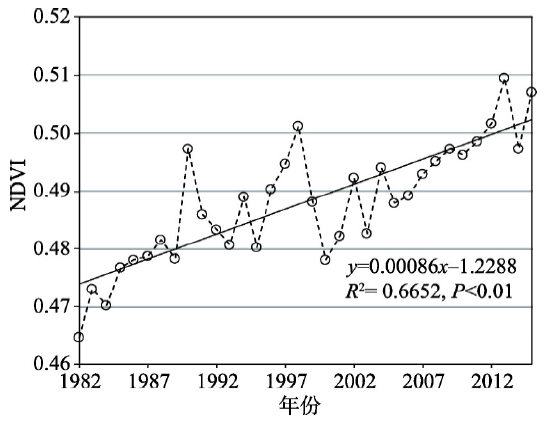
1982—2015年中国区域平均生长季NDVI呈波动增加趋势,其中在1982—1990年以及2000—2015年NDVI整体增加较快,而在1991—1999年增加较慢(图2)。在研究时段内,中国区域平均生长季NDVI的变化范围在0.465~0.510之间,最小和最大值分别出现在1982和2013年。总体上,1982—2015年中国生长季NDVI平均趋势率为0.86×10⁻³ a-1(p < 0.01),表明中国植被恢复较为明显。图2
 新窗口打开|下载原图ZIP|生成PPT
图21982—2015年中国生长季NDVI年际变化
Fig. 2Interannual variation of growing season NDVI in China during 1982-2015
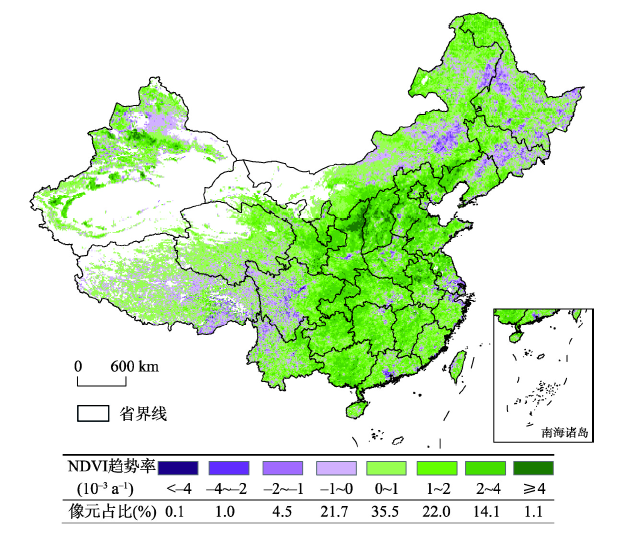
图3表明,1982—2015年中国生长季NDVI变化趋势具有很大的空间异质性;生长季NDVI呈增加和减小趋势的区域面积分别约占总面积的72.7%和27.3%。其中,生长季NDVI增加较快(slope ≥ 2×10⁻³ a-1)的区域面积约占15.2%,主要分布于中国华北平原、黄土高原、天山山脉、广西、重庆及其周边地区;生长季NDVI呈减小趋势的区域主要分布于四川盆地以西的横断山脉、准格尔盆地、东北平原周边以及经济发达的大城市群,且以缓慢减小为主,趋势率多在-1×10⁻³~0 a-1范围内。
图3
 新窗口打开|下载原图ZIP|生成PPT
图31982—2015年中国生长季NDVI变化趋势空间分布
Fig. 3Spatial distribution of growing season NDVI trend in China during 1982-2015
在选择的中国32个省级行政区中,共有31个地区的生长季NDVI在研究时段内呈增加趋势,仅上海市生长季NDVI呈减小趋势,趋势率为-0.33×10⁻³ a-1(表3)。生长季NDVI增加最快的为山西(slope = 2.71×10⁻³ a-1),其次为陕西(slope = 2.24×10⁻³ a-1),再次为重庆(slope = 2.16×10⁻³ a-1);生长季NDVI增加最慢的3个地区分别为西藏、吉林和黑龙江。
Tab. 3
表3
表31982—2015年中国32个省级行政区生长季NDVI平均变化趋势及其驱动因素的影响(10-3 a-1)
Tab. 3
| 地区 | slope (NDVIobs)a | 对植被恢复的作用 | 驱动力 | 地区 | slope(NDVIobs)a | 对植被恢复的作用 | 驱动力 | |||
|---|---|---|---|---|---|---|---|---|---|---|
| CCb | HAc | CCb | HAc | |||||||
| 上海 | -0.33 | 基本无影响 | 轻微抑制 | CC & HA | 海南 | 1.18 | 轻微促进 | 轻微促进 | CC & HA | |
| 西藏 | 0.04 | 基本无影响 | 基本无影响 | CC | 甘肃 | 1.39 | 轻微促进 | 轻微促进 | CC & HA | |
| 吉林 | 0.26 | 基本无影响 | 基本无影响 | CC & HA | 河南 | 1.41 | 轻微促进 | 轻微促进 | CC & HA | |
| 黑龙江 | 0.44 | 基本无影响 | 轻微促进 | CC & HA | 湖北 | 1.42 | 轻微促进 | 轻微促进 | CC & HA | |
| 青海 | 0.47 | 轻微促进 | 基本无影响 | CC & HA | 湖南 | 1.43 | 轻微促进 | 轻微促进 | CC & HA | |
| 四川 | 0.51 | 轻微促进 | 基本无影响 | CC & HA | 江西 | 1.46 | 轻微促进 | 轻微促进 | CC & HA | |
| 内蒙古 | 0.55 | 基本无影响 | 轻微促进 | CC & HA | 贵州 | 1.54 | 轻微促进 | 中度促进 | CC & HA | |
| 云南 | 0.64 | 基本无影响 | 轻微促进 | CC & HA | 宁夏 | 1.55 | 轻微促进 | 轻微促进 | CC & HA | |
| 浙江 | 0.68 | 轻微促进 | 基本无影响 | CC & HA | 安徽 | 1.58 | 轻微促进 | 轻微促进 | CC & HA | |
| 新疆 | 0.7 | 轻微促进 | 轻微促进 | CC & HA | 广西 | 1.62 | 轻微促进 | 中度促进 | CC & HA | |
| 台湾 | 0.83 | 轻微促进 | 轻微促进 | CC & HA | 北京 | 1.7 | 轻微促进 | 中度促进 | CC & HA | |
| 天津 | 0.85 | 轻微促进 | 轻微促进 | CC & HA | 山东 | 1.74 | 轻微促进 | 中度促进 | CC & HA | |
| 广东 | 0.9 | 基本无影响 | 轻微促进 | CC & HA | 河北 | 1.78 | 轻微促进 | 中度促进 | CC & HA | |
| 福建 | 0.91 | 轻微促进 | 轻微促进 | CC & HA | 重庆 | 2.16 | 中度促进 | 中度促进 | CC & HA | |
| 江苏 | 1 | 轻微促进 | 轻微促进 | CC & HA | 陕西 | 2.24 | 轻微促进 | 中度促进 | CC & HA | |
| 辽宁 | 1.1 | 基本无影响 | 轻微促进 | CC & HA | 山西 | 2.71 | 轻微促进 | 中度促进 | CC & HA | |
新窗口打开|下载CSV
3.2 植被NDVI变化驱动力分析
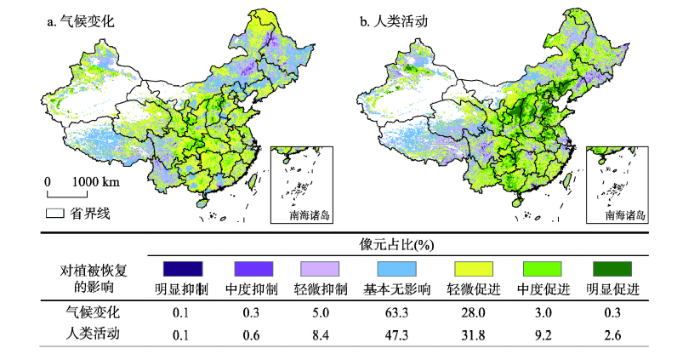
图4表明,气候变化和人类活动对中国NDVI变化的影响均存在很大的空间异质性;对于同一地区(比如黄土高原),两种因素对NDVI变化的作用也具有很大差异。总体上,全国约63.3%的区域显示气候变化对生长季NDVI的变化无明显影响;气候变化对生长季NDVI的增加起促进作用的区域面积约占31.3%,其中起中度和明显促进作用的区域面积约占3.3%,主要分布于黄土高原的西南和东北部以及四川盆地以东地区。气候变化对生长季NDVI的增加起抑制作用的区域面积约占5.4%,其中起中度和明显抑制作用的区域面积占比不足1%,主要分布于大兴安岭南端及东北平原北部地区(图4a)。图4
 新窗口打开|下载原图ZIP|生成PPT
图41982—2015年气候变化和人类活动对中国植被恢复的影响空间分布
Fig. 4Spatial distribution of the impacts of climatic change and human activities on vegetation restoration in China during 1982-2015
人类活动对生长季NDVI增加起促进作用的区域面积约占43.6%(图4b)。相比于气候变化的影响,人类活动对生长季NDVI增加起中度和明显促进作用的区域面积占比更大(约为11.8%)。在黄土高原中东部及华北平原地区,尤其在陕西北部地区(即榆林和延安),人类活动对生长季NDVI的增加具有明显促进作用。人类活动对生长季NDVI增加起抑制作用的区域面积约占9.1%,主要分布于长白山及东北平原南部、四川盆地以西以及大城市分布集中的地区(如长三角和珠三角)。进一步计算表明,研究时段内气候变化和人类活动对全国平均生长季NDVI变化的影响分别为0.34×10⁻³ a-1和0.52×10⁻³ a-1。
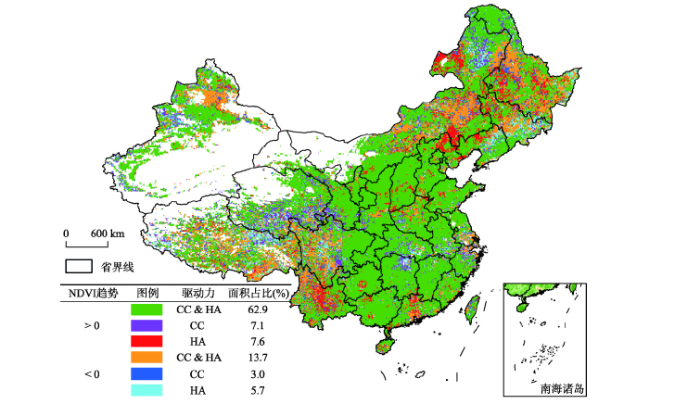
图5表明,全国约有63%的区域显示气候变化和人类活动的共同作用是生长季NDVI增加的驱动因素;单独由气候变化导致的生长季NDVI增加的区域面积约占7%,主要分布于青藏高原东部地区;单独由人类活动导致的生长季NDVI增加的区域面积约占8%,主要分布于中国东北及西南地区。此外,全国约有14%的区域显示气候变化和人类活动的共同作用是生长季NDVI减小的驱动因素,主要集中在中国西北、西南和东北地区;单独由气候变化和单独由人类活动导致的生长季NDVI减小的区域面积分别约占3%和6%,分布均较分散(图5)。总体上,气候变化和人类活动的共同作用是近34年来中国植被NDVI变化的主要原因。
图5
 新窗口打开|下载原图ZIP|生成PPT
图51982—2015年中国植被覆盖变化的驱动因素空间分布(CC和HA分别指气候变化和人类活动)
Fig. 5Drivers of vegetation cover change in China during 1982-2015(CC and HA represent climatic change andhuman activities, respectively)
在选择的32个省级行政区中,除西藏外,气候变化和人类活动均是近34年来各地区植被NDVI变化的驱动因素(表3)。然而,气候变化和人类活动对各地区植被NDVI变化的影响同样存在很大差异。通过计算各地区NDVICC和NDVIHA的变化趋势率,发现气候变化对生长季NDVI变化的影响在-0.01×10⁻³(上海)~1.05×10⁻³ a-1(重庆)之间,而人类活动的影响在-0.32×10⁻³(上海)~1.77×10⁻³ a-1(山西)之间。总体上,有5个地区显示气候变化对植被NDVI变化无明显影响;26个地区显示人类活动对植被NDVI的增加具有促进作用,其中起轻微和中度促进作用的地区分别有18和8个;人类活动仅对上海植被NDVI增加具有轻微抑制作用(表3)。此外,8个地区显示气候变化对植被NDVI变化无明显影响;23个地区显示气候变化对植被NDVI的增加具有轻微促进作用;仅重庆气候变化对植被NDVI的增加起中度促进作用(表3)。
3.3 不同驱动因素对植被NDVI变化的相对贡献
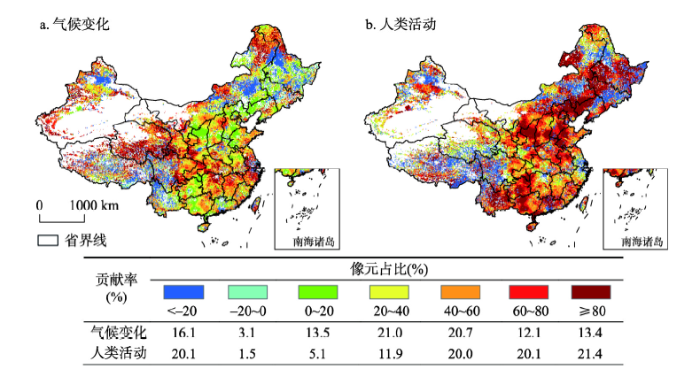
图6a表明,气候变化对中国植被NDVI变化的贡献率为正的区域面积约占81%。其中,气候变化的贡献率在20%~40%和40%~60%范围的区域面积较大,均占总面积的约21%;贡献率大于80%的区域面积约占13%,主要集中在青藏高原东北部地区。气候变化对中国植被NDVI变化的贡献率为负的区域面积约占19%,主要集中在东北平原周边、准格尔盆地以及青藏高原东南部地区。图6
 新窗口打开|下载原图ZIP|生成PPT
图61982—2015年气候变化和人类活动对中国植被覆盖变化的贡献率空间分布
Fig. 6Spatial distribution of the contributions of climatic change and human activities to vegetation cover change in China during 1982-2015
人类活动对中国植被NDVI变化的贡献率为正的区域面积约占79%(图6b)。其中,人类活动的贡献率在40%~60%、60%~80%以及80%~100%范围的区域面积较大,面积占比均超过20%;贡献率超过80%的区域主要集中在黄土高原中部、华北平原以及中国东北和西南等地。人类活动对中国植被NDVI变化的贡献率为负的区域面积约占21%,其空间分布与气候变化相似。在多数区域,人类活动对植被NDVI增加的贡献总体上比气候变化的贡献更大。根据中国实际生长季NDVI平均变化趋势以及分别受气候变化和人类活动影响的生长季NDVI平均变化趋势,计算可得气候变化和人类活动对全国平均生长季NDVI变化的贡献分别约为40%和60%。
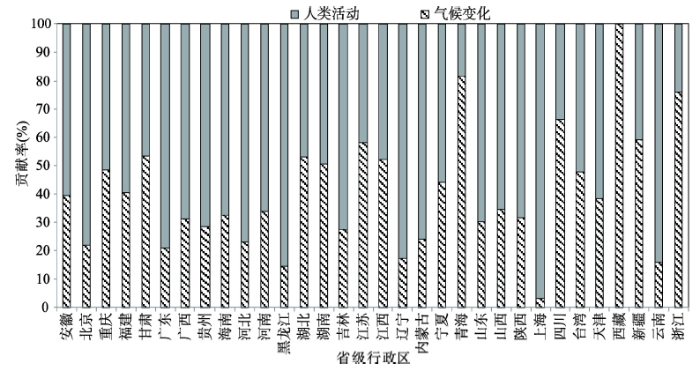
在省域尺度上,气候变化对植被NDVI变化的贡献率在4%~100%之间(图7)。其中,10个地区的气候变化贡献率超过50%;气候变化对西藏植被NDVI变化的贡献率最大(100%),其次为青海(约为82%),再次为浙江(约为76%)。人类活动对植被NDVI变化的贡献率在0~97%范围内(图7)。其中,22个地区的人类活动贡献率超过50%,说明在这些地区人类活动对植被NDVI变化的影响大于气候变化的影响;人类活动对上海植被NDVI变化的贡献率最大(约为97%),其次为黑龙江(约为85%),再次为云南(约为84%)。
图7
 新窗口打开|下载原图ZIP|生成PPT
图71982—2015年气候变化及人类活动对中国32个省级行政区植被覆盖变化的贡献
Fig. 7Contributions of climatic change and human activities to vegetation cover change during 1982-2015 in the 32 provincial-level administrative regions of China
4 讨论
本文研究表明,1982—2015年中国植被恢复整体较快,但空间异质性大;气候变化和人类活动的共同作用是中国多数地区植被恢复的原因。一方面,中国尤其是北方地区地表气温在20世纪80年代以来快速上升[21],气候变暖不仅延长了植被生长周期,而且加速了土壤有机质的分解和营养元素的释放,从而有利于植被加速生长[40]。另一方面,提高农业管理水平(比如施肥和灌溉)和实施植被建设工程(比如退耕还林)等人类活动可在局地甚至区域尺度有效增加植被覆盖[41]。例如,Zhao等[12]研究表明1998—2013年陕西省榆林市和延安市累计造林面积与NDVI呈极显著正相关,揭示了退耕还林工程对植被恢复的积极作用。但这一结果仅为定性分析,而本文采用二元回归残差分析进一步对人类活动的影响进行了区分和量化,人类活动对上述区域生长季NDVI变化的影响超过了2.0×10⁻³ a-1,贡献率多在80%以上。气候变化和人类活动同样能够抑制植被覆盖的增加,甚至导致中国一些区域的植被呈现较明显的退化趋势(图4)。值得注意的是气候变化对中国西北和东北部分地区的植被变化具有一定的负面影响(图4a)。其中,东北部分地区的植被退化可能与1980s以来的降水量下降及气温的快速上升有关;而西北地区气候较为干旱,快速的气候变暖可能会加剧某些区域的水资源短缺问题,从而使植被生长受到限制[42]。此外,人类活动对植被变化的负面影响在大城市群地区更为明显(图4b),这常常是由于城市化发展对农田和林地等的侵占造成的[11]。由此可见,气候变化和人类活动错综复杂的影响对中国植被NDVI变化的空间分布具有决定意义。
本文研究表明,在省域尺度上,山西省和陕西省的植被恢复受人类活动的影响最大,其对两地区1982—2015年生长季NDVI增加的贡献率均超过了65%。这一结果比谢宝妮[43]计算的陕西北部人类活动的贡献(不足30%)更大,但比张倩[44]针对黄土高原地区的研究结果要小(人类活动贡献率为86%)。本研究还发现人类活动对青藏高原南部的植被恢复具有负面影响,这与Luo等[45]的研究一致,他们认为近年来青藏铁路的建设以及当地居民和游客的涌入导致了植被的恶化。Piao等[27]认为气候变化对中国北方地区的植被恢复具有负面影响,而绿化工程对植被的恢复具有重要作用,这与本文研究结果一致。此外,邓晨晖等[28]对秦岭地区的研究表明,人类活动可促进东部植被的恢复,而对中西部植被起破坏作用。本研究则表明,人类活动对秦岭东部植被变化的贡献率多在60%以上,而对中西部植被变化的贡献率多在40%以下(图6b)。虽然存在差异,但以上研究结果均反映了人为活动对区域植被变化的重要作用。
研究结果的差异可能与研究范围、研究时段、采用的NDVI数据等的不同有关。其中,选择合适的NDVI数据是进行长时间序列植被动态变化研究及归因分析的重要前提。以往研究常常将具有不同时间序列长度的NDVI产品连接起来以获得具有更长时间序列的NDVI数据。但用于获取各种NDVI产品的传感器、光谱响应函数以及校正方法等存在差异,这可能会对研究结果产生一定影响[17, 19]。而本文采用具有长时间序列的GIMMS NDVI3g数据则可以避免上述问题所带来的不确定性。此外,金凯[33]通过数值对比分析、相关性分析和变化趋势一致性分析等方法评估了GIMMS NDVI3g数据与具有更高分辨率的SPOT-VGT NDVI数据的一致性,认为应用前者进行中国区域植被覆盖长期变化监测和分析是合理的。
然而,目前基于遥感影像等空间数据的大尺度研究仍然受到数据时空分辨率较低、气象站数量较少等的限制[46]。此外,虽然多元回归残差分析方法已被较广泛地应用于分离人类活动对植被NDVI变化的影响研究,但其本身仍存在一些不足。比如,在建立气候要素与NDVI之间的多元回归方程时,如何合理地选择气候要素(如气温、降水和太阳辐射)尚无定论[47];在提及人类活动时,也并没有考虑植被建设、农业技术进步和城市扩张等人类活动的具体方面[48]。由于不同区域植被生长对各影响因素的响应存在差异,上述问题与不足在大尺度研究中难以解决,使研究结果产生一定的不确定性。细化植被变化的驱动因素,确定各因素与植被变化的关系,并通过实地调查评价结果的精度将有助于减少上述不确定性。总体上,针对全国范围的人类活动和气候变化对植被覆盖变化的影响及其驱动机制仍需进一步研究。
5 结论
基于气温、降水及NDVI数据,采用变化趋势分析和多元回归残差分析等方法,本文对1982—2015年中国植被NDVI变化的驱动因素及相应贡献进行了多尺度分析。主要结论如下:(1)1982—2015年中国生长季植被NDVI增加显著,平均趋势率为0.86×10⁻³ a-1(P < 0.01),但存在很大的空间差异。其中,生长季NDVI增加较快的区域主要分布于中国华北平原、黄土高原、天山山脉、广西、重庆及其周边地区;减小较快的区域主要分布于中国东北、西南及经济发达地区。研究区中,山西、陕西和重庆的生长季植被NDVI增加最快,趋势率均超过2×10⁻³ a-1;仅上海生长季植被NDVI呈减小趋势。
(2)气候变化和人类活动对中国植被NDVI变化的影响存在很大的空间差异,但均以正面影响为主。相比于气候变化的影响,在黄土高原中部及华北平原地区,人类活动对植被NDVI变化的正面影响更大。整体上,1982—2015年气候变化和人类活动对全国平均生长季NDVI变化的影响分别为0.34×10⁻³和0.52×10⁻³ a-1。在省域尺度上,人类活动对生长季NDVI变化的影响在-0.32×10⁻³(上海)~1.77×10⁻³ a-1(山西)之间,而气候变化对生长季NDVI变化的影响在-0.01×10⁻³(上海)~1.05×10⁻³ a-1(重庆)之间。气候变化和人类活动的共同作用是近34年来中国植被NDVI变化的主要驱动因素。
(3)气候变化和人类活动对中国植被NDVI变化的相应贡献均存在很大的空间异质性,其中气候变化贡献率大于80%的区域主要集中在青藏高原东北部,而人类活动贡献率超过80%的区域主要集中在黄土高原中部、华北平原以及中国东北和西南等地。整体上,气候变化和人类活动对中国近34年来生长季植被NDVI变化的相对贡献率分别为40%和60%。在省域尺度上,人类活动贡献率大于50%的省份有22个,其中上海、黑龙江和云南的人类活动贡献率最大。可见,人类活动对中国植被变化的作用不可忽视。
参考文献 原文顺序
文献年度倒序
文中引用次数倒序
被引期刊影响因子
[本文引用: 1]
DOI:10.11834/jrs.19980309URL [本文引用: 1]

By using NOAA temporal series data during the period 1985一1990 (69 months),this study examines the Vegetation-Cover change with time and space in China. Furthermore, the ana1ysis about correlation . between Vegetation-Cover change and environmental factors is also accomplished by combining simu1taneous average temperature and precipitation .data in each month. The methods employedinclude Sample Transect Ana1ysis, Partia1 Correlation Ana1ysis, and GIS Spatia1 Calcu1ation.From the above ana1ysis, we can draw the following conclusions:1. The vegetation index generally represents the situation of the superficial vegetation cover. Heat and water condition determine the whole spatia1 distribution pattem of vegetation index and build the regional attribute in longitude and latitude. The partia1 fluctuation of the vegetation index is essentia11y affected by landscape and soil conditions. This defines its regiona1 distribution pattem.2. Lying on the same longitude, the vegetation index obviously. corresponds to the seasonal movement law, and span of the movement in time and space is much greater than that along the same latitude. The type and ways of the green wave movement synchronize with the seasonal movement of the continenta1 main controlling air mass and are influenced by it.3.The vegetation index increases and decreases with the warming and cooling of the climate.So it has typically seasona1 change characteristics. Along the same longitude, the higher the latitude is,the greater the scope of seasonal change will be. In summer there is no evident difference of vegetationindex between southem and northem region. But in winter,this difference is quite obvious.4. In a large range, the vegetation index change is driven by water and heat conditions. In eastem moist monsoon zone of China,along. the same longitude,the temperature is the most important influential parameter.The correlation between the vegetation index change and monthly average temperature is obvious.So the heat is key natural limited factor for the growth of the vegetation. Yet,in northem China, along the same latitude, from east to west,it sequentially covers the humid monsoon zone, semi-arid and arid desert zone. The relationship between the vegetation index change and monthly average precipitation is well correlated positively. It proves that in a dry area, water source is the essential limited condition for the growth of the vegetation.
DOI:10.11834/jrs.19980309URL [本文引用: 1]
By using NOAA temporal series data during the period 1985一1990 (69 months),this study examines the Vegetation-Cover change with time and space in China. Furthermore, the ana1ysis about correlation . between Vegetation-Cover change and environmental factors is also accomplished by combining simu1taneous average temperature and precipitation .data in each month. The methods employedinclude Sample Transect Ana1ysis, Partia1 Correlation Ana1ysis, and GIS Spatia1 Calcu1ation.From the above ana1ysis, we can draw the following conclusions:1. The vegetation index generally represents the situation of the superficial vegetation cover. Heat and water condition determine the whole spatia1 distribution pattem of vegetation index and build the regional attribute in longitude and latitude. The partia1 fluctuation of the vegetation index is essentia11y affected by landscape and soil conditions. This defines its regiona1 distribution pattem.2. Lying on the same longitude, the vegetation index obviously. corresponds to the seasonal movement law, and span of the movement in time and space is much greater than that along the same latitude. The type and ways of the green wave movement synchronize with the seasonal movement of the continenta1 main controlling air mass and are influenced by it.3.The vegetation index increases and decreases with the warming and cooling of the climate.So it has typically seasona1 change characteristics. Along the same longitude, the higher the latitude is,the greater the scope of seasonal change will be. In summer there is no evident difference of vegetationindex between southem and northem region. But in winter,this difference is quite obvious.4. In a large range, the vegetation index change is driven by water and heat conditions. In eastem moist monsoon zone of China,along. the same longitude,the temperature is the most important influential parameter.The correlation between the vegetation index change and monthly average temperature is obvious.So the heat is key natural limited factor for the growth of the vegetation. Yet,in northem China, along the same latitude, from east to west,it sequentially covers the humid monsoon zone, semi-arid and arid desert zone. The relationship between the vegetation index change and monthly average precipitation is well correlated positively. It proves that in a dry area, water source is the essential limited condition for the growth of the vegetation.
[本文引用: 2]
URL [本文引用: 1]
DOI:10.1016/j.gloplacha.2016.10.020URL [本文引用: 2]
DOI:10.3390/rs71013233URL [本文引用: 3]
[本文引用: 2]
[本文引用: 2]
DOI:10.1029/2000JD000115URL [本文引用: 2]
DOI:10.1016/j.agrformet.2015.05.002URL [本文引用: 3]
DOI:10.1016/S0169-2046(02)00039-7URL [本文引用: 1]
URL [本文引用: 4]
DOI:10.1007/s00704-017-2107-8URL [本文引用: 3]
DOI:10.1109/TGRS.36URL [本文引用: 1]
DOI:10.1126/science.1071828URL [本文引用: 1]
DOI:10.1007/s00254-007-0901-9URL [本文引用: 1]
The relationship between climate change and vegetation dynamics in the southwestern karst region of China has been identified by recent studies. Based on previous researches and AVHRR (Advanced Very High Resolution Radiometer) GIMMS (Global Inventory Monitoring and Modeling Studies) NDVI (Normalized Difference Vegetation Index) (1982–2003) and AVHRR GloPEM (Global Production Efficiency Model) NPP (Net Primary Production) (1981–2000) datasets, vegetation dynamics impacted by climate change in the southwestern karst region of China were assessed. The results show that: (1) since the early 1980s, both vegetation cover density and net primary production have insignificant ascending tendencies. However, the inter-annual variation rates of vegetation indexes have apparent spatial differentiations; (2) the correlation coefficients between the inter-annual variations of vegetation indexes and the inter-annual variations of climate factors vary geographically; (3) as indicated by NDVI and NPP, various vegetation types have different responses to climate change, and the annual mean temperature variation has more significant impact on vegetation dynamics than the annual precipitation variation in the study area; (4) distribution laws of correlation coefficients between the inter-annual variations of vegetation indexes and the inter-annual variations of climate factors in different climate conditions are apparent. All these findings will enrich our knowledge of the natural forces which impact the stability of the karst ecosystems and provide scientific basis for the management of the karst ecosystems.
DOI:10.1016/j.agrformet.2016.04.009URL [本文引用: 1]
DOI:10.1080/01431160500168686URL [本文引用: 2]
[本文引用: 1]
[本文引用: 1]
DOI:10.1016/j.rse.2011.12.015URL [本文引用: 2]
DOI:10.1080/01431161.2012.743692URL [本文引用: 1]
DOI:10.3354/cr01531URL [本文引用: 2]
DOI:10.1038/nature09364URL [本文引用: 1]
DOI:10.1016/j.quaint.2016.08.038URL [本文引用: 1]
DOI:10.3969/j.issn.0255-8297.2016.06.006URL [本文引用: 2]
Since implementation of the project of returning farmland to forest and grassland in the Loess Plateau, vegetation cover of the region has been greatly changed. To effectively monitor variation of the vegetation cover, this paper constructs a yearly maximum normalized difference vegetation index (NDVI) sequence covering Loess Plateau from 1982 to 2014 using the per-pixel unary linear regression model (LRM). The work is based on AVHRR GIMMS NDVI datasets from 1982 to 2006 and MODIS NDVI datasets from 2001 to 2014. The constructed NDVI has passed consistency check, and is used to analyze spatial-temporal characteristics of vegetation NDVI in the past 33 years. The following results are obtained. The overall vegetation NDVI of the Loess Plateau in the past 33 years has been increasing. Spatial distribution of the vegetation cover in the regions is significantly different. Vegetation cover has slightly degraded in most southern and western parts of the area under study, and that in the central region is almost unchanged. The vegetation cover shows an improving trend in some areas including the border of Inner Mongolia, Lanzhou, Gansu and Yulin region of Shaanxi. Vegetation covers of different slopes are good. Degrees of changes in areas with different slopes are ranked in a descending order as above 28°, 20°~28°, 14°~20°, 9°~14°, 4°~9°. The vegetation cover in sloping fields of middle part of the Loess Plateau is most improved. Slight improvement of the vegetation cover has been found in areas including eastern Gansu, junction of Gansu and Qinghai provinces, southern Shaanxi, and the cities Linfen, Yuncheng and Sanmenxia of Shanxi, showing positive results in controlling loss of water and soil.
DOI:10.1016/j.jag.2011.10.007URL [本文引用: 1]
[本文引用: 2]
[本文引用: 2]
DOI:10.1111/gcb.12795URL [本文引用: 2]
[本文引用: 2]
[本文引用: 2]
DOI:10.1007/s11434-013-5948-2URL [本文引用: 1]
DOI:10.1007/s11434-013-5948-2URL [本文引用: 1]
DOI:10.3390/rs5020927URL [本文引用: 1]
DOI:10.3390/rs6043101URL [本文引用: 1]
[本文引用: 1]
[本文引用: 1]
[D].
[本文引用: 2]
[D].
[本文引用: 2]
DOI:10.1175/JCLI-D-14-00427.1URL [本文引用: 2]
[本文引用: 1]
[本文引用: 1]
[本文引用: 1]
[本文引用: 1]
DOI:10.11821/dlxb201803001URL [本文引用: 2]
Based on normalized difference vegetation index (NDVI), vegetation type, and meteorological data, this study revealed the seasonal variations of the day- and nighttime warming in growing seasons using unitary linear regression analysis. It examined different effects of asymmetric seasonal warming on vegetation activities in China's temperate zone using the two-order partial correlation analysis method. The results are as follows. (1) The day- and nighttime warming trends from 1982 to 2015 in growing seasons were extremely significant. The day- and nighttime warming rates were featured by asymmetry; daytime warming was slightly faster than nighttime warming in spring and summer. Contrarily, in autumn, nighttime warming was faster than daytime warming. (2) The effects of the day- and nighttime warming on vegetation activity were obviously different; daytime warming had significantly greater and more extensive effects on vegetation than nighttime warming did, and the areas impacted by diurnal warming were broader in spring than in summer and autumn. (3) Different vegetation types responded differently to the seasonal asymmetry in day- and nighttime warming, and the degree of responses showed distinct variations by season.
DOI:10.1016/S0140-1963(03)00121-6URL [本文引用: 1]
DOI:10.1016/j.jaridenv.2006.05.015URL [本文引用: 1]
DOI:10.13249/j.cnki.sgs.2017.04.016URL [本文引用: 1]
Based on GIMMS 3g NDVI, landuse, temperature, precipitation and vegetation type data, the paper fitted the current year vegetation growing season curve and extracted the yearly green-up day of vegetation growing season in northern China in recent 30 years (from 1983 to 2012), analyzed its spatio-temporal changes and also the relationship between temperature and precipitation. In order to meet the actual vegetation growth, we used harmonic analysis of time-series method to reconstruct vegetation NDVI, dynamic threshold and a sixpolynomial fitting method. Some conclusions were as follows. 1) With longer time-series features and better data quality, GIMMS 3g NDVI data with time-series harmonic data analysis was very good to fit and show the actual characteristics of vegetation growing season curve in northern China and can be well used to further study of vegetation growing season in the future. 2) During the study period, green-up day of vegetation growing season mainly distributed from 80 days to 150 days, and the regional averaged value reached 111.6 days.Green-up day of vegetation growing season in regions such as northeast Plain, north China Plain, Hetao Plain, Tianshan, the Altai were earlier. 3) Green-up day of vegetation growing season in northern China showed an advanced tend in general and gradually transitioned from the northwest to the northeast. The significantly advanced regions mainly distributed in the eastern of Inner Mongolia, northeast China Plain, southern Shanxi and the Tianshan Mountains of Xinjiang section area, while the significantly delayed regions were in Qinghai-Tibet Plateau alpine regions. 4) Due to various vegetation types and regional differences and so on,green-up day of vegetation growing season responded to temperature and precipitation distinctly and temperature was the main factor that affecting green-up day of vegetation growing season changes.
[本文引用: 1]
[D].
[本文引用: 1]
[D].
[本文引用: 1]
[D].
[本文引用: 1]
[D].
[本文引用: 1]
[D].
[本文引用: 1]
[D].
[本文引用: 1]
DOI:10.1016/j.ecolind.2018.04.067URL [本文引用: 1]
[本文引用: 1]
[本文引用: 1]
[D].
[本文引用: 1]
[D].
[本文引用: 1]
DOI:10.1007/s11442-016-1253-8URL [本文引用: 1]
Using the Moderate Resolution Imaging Spectroradiometer-normalized difference vegetation index (NDVI) dataset, we investigated the patterns of spatiotemporal variation in vegetation coverage and its associated driving forces in the Qinling-Daba (Qinba) Mountains in 2000-2014. The Sen and Mann-Kendall models and partial correlation analysis were used to analyze the data, followed by calculation of the Hurst index to analyze future trends in vegetation coverage. The results of the study showed that (1) NDVI of the study area exhibited a significant increase in 2000-2014 (linear tendency, 2.8%/10a). During this period, a stable increase was detected before 2010 (linear tendency, 4.32%/10a), followed by a sharp decline after 2010 (linear tendency, -6.59%/10a). (2) Spatially, vegetation cover showed a “high in the middle and a low in the surroundings” pattern. High values of vegetation coverage were mainly found in the Qinba Mountains of Shaanxi Province. (3) The area with improved vegetation coverage was larger than the degraded area, being 81.32% and 18.68%, respectively, during the study period. Piecewise analysis revealed that 71.61% of the total study area showed a decreasing trend in vegetation coverage in 2010-2014. (4) Reverse characteristics of vegetation coverage change were stronger than the same characteristics on the Qinba Mountains. About 46.89% of the entire study area is predicted to decrease in the future, while 34.44% of the total area will follow a continuously increasing trend. (5) The change of vegetation coverage was mainly attributed to the deficit in precipitation. Moreover, vegetation coverage during La Nina years was higher than that during El Nino years. (6) Human activities can induce ambiguous effects on vegetation coverage: both positive effects (through implementation of ecological restoration projects) and negative effects (through urbanization) were observed.
