Analysis of driving mechanism based on a GWR model of green efficiency of water resources in China
SUN Caizhi1, MA Qifei2,3, ZHAO Liangshi1收稿日期:2018-03-29修回日期:2020-04-3网络出版日期:2020-05-25
| 基金资助: |
Received:2018-03-29Revised:2020-04-3Online:2020-05-25
| Fund supported: |
作者简介 About authors
孙才志(1970-),男,山东烟台人,教授,博士生导师,主要从事水资源经济与海洋经济研究E-mail:suncaizhi@lnnu.edu.cn。

摘要
关键词:
Abstract
Keywords:
PDF (5593KB)元数据多维度评价相关文章导出EndNote|Ris|Bibtex收藏本文
本文引用格式
孙才志, 马奇飞, 赵良仕. 基于GWR模型的中国水资源绿色效率驱动机理. 地理学报[J], 2020, 75(5): 1022-1035 doi:10.11821/dlxb202005010
SUN Caizhi.
1 引言
水是生命之源、生产之要、生态之基[1],作为人民生产生活不可或缺的重要战略资源,水资源的可持续利用关乎国家民族未来发展的长远大计。当前,水资源短缺和用水效率低下是制约中国社会发展的限制性因素之一[2],提高用水效率,实现水资源可持续利用是中国建设生态文明社会的重要任务。2012年以来,中国政府相继出台了《关于实行最严格水资源管理制度的意见》《节水型社会建设“十三五”规划》等政策文件,并提出要把节约用水、提高水资源利用效率放在突出位置,以水资源的可持续利用促进社会经济的可持续发展[3,4,5]。因此,对水资源利用效率的驱动机理进行研究是时代发展的要求,有助于解决中国水资源短缺问题。当前,对水资源利用效率的驱动机理研究主要集中在工业用水效率驱动因素和综合用水效率驱动因素等方面。在工业用水效率驱动因素方面,陈关聚等运用随机前沿模型考察了经济发达程度、产业结构、科技水平和人均用水量等因素对工业用水效率的影响[6];姜蓓蕾等认为工业发展规模、资源环境、工业结构、技术投入以及环境和经济杠杆等是影响中国工业用水效率的重要因素[7];李静等将工业用水效率一系列影响因素作为控制变量,着重研究工业水资源价格对工业用水效率的影响[8]。在综合用水效率驱动因素方面,杨丽英等认为影响水资源利用效率的因素主要是自然因素、技术因素、配置因素和制度因素,并阐述了几大因素之间的作用关系[9];马海良等基于Tobit模型考察了经济水平、产业结构、水资源禀赋、水资源价格和政府影响力等因素对中国水效率的影响[10];魏楚等基于文献评述,认为地区和行业差异、价格因素、结构因素和技术水平是中国用水效率的主要驱动因素[11];孙才志等在前人研究的基础上提出水资源绿色效率的概念,并着重研究了“城镇化、工业化、信息化、农业现代化”对中国水资源绿色效率的驱动效应[12]。对上述文献进行梳理可以发现,对水资源利用效率驱动因素的研究,广大****多根据自身的研究目的和研究背景制定相应的驱动因素指标,指标选取带有很大主观性,从而不够全面;另外,当前水资源利用效率研究较少考虑社会效益,这不符合“以人为本”的绿色发展理念,因此需要将社会发展指数纳入到水资源利用效率评价体系,以此实现经济、社会和环境的协同发展。
鉴于此,本文在前人研究的基础上,将社会发展指数作为期望产出纳入到水资源利用效率评价体系中以体现社会效益,并结合已有研究成果,对水资源利用效率的驱动因素进行筛选和整合,综合选取自然、社会经济、环境、科技四大因素共19个指标,对水资源绿色效率的驱动机理进行探究,为切实提高地区水资源绿色效率提供理论依据。
2 研究方法与数据来源
2.1 超效率SBM模型
相比于传统的数据包络分析法(Data Envelopment Analysis, DEA)[13],Tone[14]提出的SBM(Slacks-Based Measure)模型不仅考虑了非期望产出对生产过程的影响,而且通过将各投入产出的松弛变量直接纳入目标函数,消除了松弛变量对测度值的影响,使水资源利用过程更加符合实际,测度值也更加准确[15,16]。超效率DEA模型是一种对评价为DEA有效或弱有效的决策单元(DMU)进行进一步评价的方法,其原理是将被评价DMU从参考集中排除从而使求解得出的效率值可能大于1[17]。超效率SBM模型结合超效率DEA模型和SBM模型的优势,不仅可以更恰当地处理非期望产出,而且可以在有效决策单元中进一步作出比较[18],具体公式请参阅文献[19]。
2.2 空间相关性分析方法
首先利用全局自相关的Moran's I指数,检验中国水资源绿色效率是否具有空间依赖性,如果存在,再利用局部空间自相关的Moran's I指数分析中国水资源绿色效率的空间异质性。本文采用临边rook空间权重矩阵[20]。2.3 地理加权回归
地理加权回归模型(GWR)是一种空间变系数的回归分析工具,不同于普通线性回归模型(OLS),GWR模型通过将空间位置信息纳入到回归方程,可以根据参数估计值随地理位置的变化情况来探索空间关系的非平稳性,在地理学各方面得到了广泛应用[21,22,23,24]。基于此,本文采用地理加权回归模型来探索各地区水资源绿色效率的驱动因素,并对各影响因素的重要性及空间分布格局进行分析。2.4 指标选取与数据来源及处理
2.4.1 测度水资源绿色效率的指标选取水资源绿色效率测度投入指标选取水足迹、劳动力和资本存量,期望产出指标选取GDP和社会发展指数[25]。其中,社会维度选取人口、城市化、科教、人才、医疗5个方面建立指标体系[26],非期望产出为灰水足迹,计算方法见文献[27,28]。
2.4.2 水资源绿色效率的驱动因素指标 影响水资源利用效率的因素繁多而复杂,本文将水资源利用效率的影响因素归为5类,分别是自然因素、社会经济因素、环境因素、科技因素和政府影响力。鉴于目前对政府决策和管理能力尚没有量化标准,政府影响力主要通过在环境和科技方面的财政支出能力来体现,因此本文将其纳入到环境和科技因素。共选取4种类型的19个解释变量对水资源绿色效率驱动机理进行分析(表1)。
Tab. 1
表1
表1影响水资源绿色效率的变量指标及描述
Tab. 1
| 因素分类 | 变量描述 | 解释变量 |
|---|---|---|
| 自然因素 | 水资源禀赋 | 人均水资源量(m3) |
| 降水量(mm) | ||
| 社会经济因素 | 经济水平 | 人均GDP(元) |
| 产业结构 | 第三产业比重(%) | |
| 三产劳均增加值(万元) | ||
| 工业发展水平 | 规模以上工业企业主要产品利润率(%) | |
| 农业发展水平 | 谷物单位面积产量(kg/hm2) | |
| 人口规模 | 总人口(亿人) | |
| 人口素质 | 平均受教育年限(a) | |
| 用水结构 | 工业用水比重(%) | |
| 农业用水比重(%) | ||
| 对外开放程度 | 外商直接投资(亿元) | |
| 交通基础设施 | 单位面积交通里程(km/km2) | |
| 环境因素 | 污染程度 | COD排放总量(万t) |
| 污水处理 | 城市污水处理率(%) | |
| 环保投入 | 污染治理投资占地方预算百分比(%) | |
| 科技因素 | 科技成果 | 万人专利授权数(件) |
| 科技转化率 | 科技市场成交额(亿元) | |
| 科技投入 | R&D经费投资总额(亿元) |
新窗口打开|下载CSV
2.4.3 数据来源及处理 本文数据来源于《中国统计年鉴(2001—2017年)》[29]《中国环境年鉴(2001—2017年)》[30]《中国水资源公报(2000—2016年)》[31]和《新中国六十年统计资料汇编》[32],研究数据不包括港、澳、台地区。水足迹、资本存量和社会发展指数等指标处理方法参阅文献[33]。
3 结果分析
3.1 空间相关性分析
中国水资源绿色效率整体水平较低,各地区差异显著,且呈递减趋势(表2)。为了分析中国各地区水资源绿色效率的空间相关性和空间异质性,本文基于Geoda软件平台,利用全局自相关方法,在水资源绿色效率Moran's I指数的正态统计量Z值均超过1%显著性水平的临界值1.65条件下,计算2000年、2005年、2010年和2016年中国水资源绿色效率全局Moran's I指数。结果显示,4个时段水资源绿色效率全局Moran's I指数分别是0.2193、0.1575、0.1265和0.2180,表明中国各地区水资源绿色效率存在明显的空间自相关,即某地区的水资源绿色效率会受到相邻区域水资源绿色效率水平的正向影响。Tab. 2
表2
表2中国水资源绿色效率测度结果
Tab. 2
| 地区 | 2000 | 2002 | 2004 | 2006 | 2008 | 2010 | 2012 | 2014 | 2016 |
|---|---|---|---|---|---|---|---|---|---|
| 北京 | 1.007 | 0.916 | 0.883 | 1.006 | 0.884 | 1.031 | 1.023 | 0.964 | 1.043 |
| 天津 | 1.035 | 1.003 | 1.003 | 1.004 | 0.986 | 0.940 | 0.955 | 0.895 | 1.016 |
| 河北 | 0.194 | 0.192 | 0.185 | 0.186 | 0.187 | 0.182 | 0.175 | 0.177 | 0.182 |
| 山西 | 0.497 | 0.513 | 0.506 | 0.511 | 0.421 | 0.387 | 0.345 | 0.311 | 0.298 |
| 内蒙古 | 1.015 | 0.848 | 0.464 | 0.421 | 0.372 | 0.363 | 0.336 | 0.307 | 0.309 |
| 辽宁 | 0.669 | 0.644 | 0.532 | 0.512 | 0.446 | 0.366 | 0.378 | 0.346 | 0.337 |
| 吉林 | 0.732 | 0.541 | 0.475 | 0.466 | 0.382 | 0.343 | 0.331 | 0.312 | 0.312 |
| 黑龙江 | 0.375 | 0.391 | 0.392 | 0.397 | 0.393 | 0.348 | 0.347 | 0.333 | 0.317 |
| 上海 | 0.718 | 0.701 | 0.794 | 0.860 | 0.953 | 0.969 | 1.010 | 0.883 | 1.125 |
| 江苏 | 0.254 | 0.266 | 0.266 | 0.288 | 0.278 | 0.251 | 0.251 | 0.261 | 0.288 |
| 浙江 | 0.460 | 0.494 | 0.460 | 0.435 | 0.402 | 0.414 | 0.388 | 0.379 | 0.417 |
| 安徽 | 0.241 | 0.263 | 0.257 | 0.249 | 0.260 | 0.271 | 0.234 | 0.208 | 0.210 |
| 福建 | 0.383 | 0.429 | 0.422 | 0.479 | 0.470 | 0.400 | 0.374 | 0.370 | 0.350 |
| 江西 | 0.362 | 0.325 | 0.291 | 0.277 | 0.262 | 0.260 | 0.257 | 0.248 | 0.254 |
| 山东 | 0.371 | 0.248 | 0.182 | 0.197 | 0.201 | 0.179 | 0.167 | 0.170 | 0.178 |
| 河南 | 0.145 | 0.150 | 0.144 | 0.142 | 0.132 | 0.127 | 0.120 | 0.121 | 0.115 |
| 湖北 | 0.274 | 0.275 | 0.272 | 0.278 | 0.275 | 0.261 | 0.239 | 0.234 | 0.244 |
| 湖南 | 0.332 | 0.267 | 0.227 | 0.226 | 0.236 | 0.207 | 0.184 | 0.184 | 0.194 |
| 广东 | 0.338 | 0.376 | 0.553 | 0.817 | 0.947 | 1.010 | 0.573 | 0.297 | 0.242 |
| 广西 | 0.298 | 0.324 | 0.304 | 0.285 | 0.267 | 0.251 | 0.221 | 0.226 | 0.230 |
| 海南 | 0.991 | 0.970 | 0.903 | 0.893 | 0.920 | 0.883 | 0.666 | 0.595 | 0.586 |
| 重庆 | 1.009 | 0.548 | 0.434 | 0.464 | 0.447 | 0.456 | 0.447 | 0.449 | 0.452 |
| 四川 | 0.665 | 0.689 | 0.454 | 0.572 | 0.282 | 0.264 | 0.290 | 0.230 | 0.210 |
| 贵州 | 0.319 | 0.293 | 0.272 | 0.275 | 0.282 | 0.293 | 0.289 | 0.280 | 0.267 |
| 云南 | 0.253 | 0.254 | 0.254 | 0.244 | 0.222 | 0.226 | 0.210 | 0.196 | 0.194 |
| 西藏 | 1.057 | 1.003 | 0.852 | 0.731 | 0.680 | 0.801 | 0.814 | 0.862 | 0.802 |
| 陕西 | 0.377 | 0.368 | 0.333 | 0.324 | 0.321 | 0.318 | 0.305 | 0.290 | 0.286 |
| 甘肃 | 1.005 | 0.579 | 0.452 | 0.432 | 0.404 | 0.355 | 0.347 | 0.331 | 0.315 |
| 青海 | 1.024 | 0.834 | 0.745 | 0.703 | 0.679 | 0.764 | 0.926 | 1.010 | 1.006 |
| 宁夏 | 1.049 | 1.011 | 1.003 | 0.670 | 0.639 | 0.652 | 0.601 | 0.807 | 1.008 |
| 新疆 | 0.403 | 0.375 | 0.350 | 0.323 | 0.320 | 0.323 | 0.310 | 0.280 | 0.255 |
| 均值 | 0.576 | 0.519 | 0.473 | 0.473 | 0.450 | 0.448 | 0.423 | 0.405 | 0.421 |
新窗口打开|下载CSV
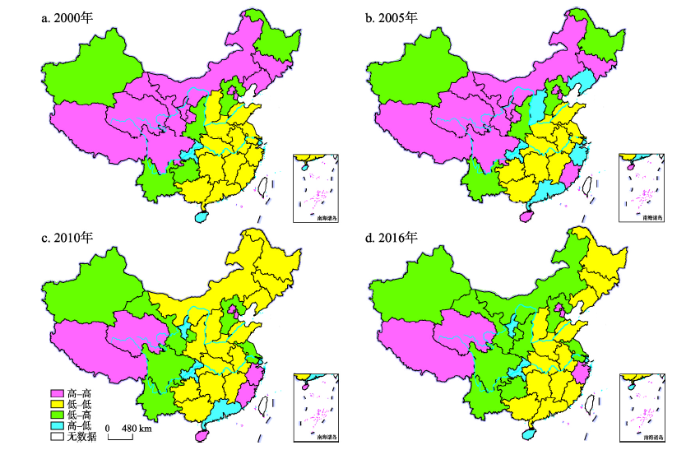
由于全局自相关Moran's I指数不能表明某一具体地区的空间集聚特征,本文结合Moran散点图和局部Moran's I指数,绘制2000年、2005年、2010年和2016年中国各地区水资源绿色效率LISA集聚图(图1),探究水资源绿色效率是否存在局部集聚。
图1
 新窗口打开|下载原图ZIP|生成PPT
图1中国各地区水资源绿色效率LISA集聚图
注:基于国家测绘地理信息局标准地图服务网站下载的审图号为GS(2016)1599号标准地图制作,底图无修改。
Fig. 1The LISA of green efficiency of water resources in different regions of China
处于空间正相关(高—高集聚和低—低集聚)的地区个数在2000年、2005年、2010年和2016年分别有22个、20个、21个和18个(图1),数量的减少表明水资源绿色效率高—高集聚和低—低集聚呈减弱的趋势,低—高集聚地区数量有所增加,表现为上升趋势,高—低集聚表现为减弱态势。通过对比分析4种集聚类型可以发现,高—高集聚在前两个时期主要分布在中国的东北和西部地区,且两个时期变动不大,后两个时期则主要分布在东部沿海和西部地区,且数量有所下降;低—低集聚地区在2000年和2005年主要分布在东部和中部地区,在2010年和2016年地区数量有所增加,且在空间格局上有向东北扩散的趋势;低—高集聚地区在研究期内数量有略微上升,但其空间分布格局变化不大,呈发散状态散布在中国东部和西部地区;高—低集聚地区在2000年仅有上海、重庆和海南3个地区,2005年数量上升至6个,之后数量有所下降并趋于稳定状态。总体来看,高—高集聚和低—低集聚地区呈集中式分布,数量较多,低—高集聚和高—低集聚地区呈发散式分布,数量较少。
3.2 中国水资源绿色效率空间差异的影响因素分析
3.2.1 传统回归模型计算结果 为掌握各影响因素对中国水资源绿色效率的全局(平均)影响,首先基于最小二乘法(OLS)对中国水资源绿色效率进行一般线性回归分析,通过共线性诊断去掉两个方差膨胀因子(VIF)最高的两个变量(三产劳均增加值和外商直接投资),剩余VIF平均值为5.96,低于10,达到回归分析基本要求,结果见表3。Tab. 3
表3
表3最小二乘法模型估计结果
Tab. 3
| 因变量 | 回归系数 | 标准差 | t值 | 显著性 |
|---|---|---|---|---|
| 常数 | 2.3349*** | 0.4301 | 5.43 | 0.000 |
| 人均水资源量 | -0.0169** | 0.0110 | -1.54 | 0.025 |
| 降水量 | -0.0135 | 0.0165 | -0.82 | 0.415 |
| 人均GDP | 0.1536*** | 0.0266 | 5.78 | 0.000 |
| 第三产业比重 | 0.4806*** | 0.1499 | 3.21 | 0.001 |
| 规模以上工业企业主要产品利润率 | -0.4073*** | 0.1125 | -3.62 | 0.000 |
| 谷物单位面积产量 | -0.2489*** | 0.0547 | -4.55 | 0.000 |
| 总人口 | -0.4681*** | 0.0592 | -7.90 | 0.000 |
| 平均受教育年限 | -0.0159 | 0.0137 | -1.16 | 0.245 |
| 工业用水比重 | -0.5865*** | 0.1248 | -4.70 | 0.000 |
| 农业用水比重 | -0.5372*** | 0.1054 | -5.10 | 0.000 |
| 单位面积交通里程 | 0.0671* | 0.0372 | 1.80 | 0.072 |
| COD排放总量 | -0.0007* | 0.0004 | -1.90 | 0.058 |
| 城市污水处理率 | -0.5114 | 0.0490 | -10.43 | 0.109 |
| 污染治理投资占地方预算百分比 | -0.4572* | 0.2428 | -1.88 | 0.060 |
| 万人专利授权数 | -0.0115 | 0.0023 | -0.05 | 0.960 |
| 科技市场成交额 | 0.0047** | 0.0037 | 1.25 | 0.011 |
| R&D经费投资总额 | 0.0069 | 0.0056 | 1.22 | 0.222 |
| 调整R2 | 0.650 | |||
新窗口打开|下载CSV
由表3可知,在10%及以下显著性水平条件下,共有12个因素对中国水资源绿色效率有重要影响。由系数绝对值大小可知,其重要性由大到小依次是工业用水比重、农业用水比重、第三产业比重、总人口、环境污染治理投资占地方预算百分比、规模以上工业企业主要产品利润率、谷物单位面积产量、人均GDP、单位面积交通里程、人均水资源量、科技市场成交额和COD排放总量,其中人均GDP、第三产业比重、单位面积交通里程和科技市场成交额显著为正,其余8个显著性指标表现为负向作用。
3.2.2 GWR模型计算结果 中国水资源绿色效率的空间分布具有显著的空间正相关和空间异质性,传统的OLS模型忽略了空间地理位置对水资源绿色效率的影响,而使用GWR模型可以有效解决由空间位置引起的因变量和自变量之间的局部变异问题[34],因此,本文选取各省会城市的投影坐标作为地理坐标,以固定高斯函数为权属函数,以AIC法确定带宽,运用GWR4.9软件进行回归计算,结果如表4、表5、图2所示。
Tab. 4
表4
表4中国水资源绿色效率GWR模型结果
Tab. 4
| 模型参数 | 2000年 | 2005年 | 2010年 | 2016年 |
|---|---|---|---|---|
| Bandwidth | 396939.049 | 410258.124 | 396070.654 | 125358.383 |
| Residual Squares | 0.878045 | 0.412876 | 0.548912 | 0.457864 |
| Effective Number | 27.723 | 27.708 | 27.904 | 31 |
| Sigma值 | 0.168297 | 0.115406 | 0.133067 | 0.121531 |
| AIC值 | 31.738798 | 8.347751 | 17.176235 | 11.553877 |
| R2 | 0.817 | 0.860 | 0.861303 | 0.935754 |
| 调整R2 | 0.701 | 0.777 | 0.779 | 0.810 |
新窗口打开|下载CSV
Tab. 5
表5
表5GWR模型计算变量回归系数结果统计
Tab. 5
| 变量 | 最小值 | 下四分位数 | 中位数 | 上四分位数 | 最大值 | 平均值 |
|---|---|---|---|---|---|---|
| 人均水资源量 | -0.468/-15.232 | -0.027/-0.134 | 0.060/-0.061 | 0.261/0.230 | 1.425/0.812 | 0.129/-0.450 |
| 人均GDP | -3.449/-2.091 | -0.356/-0.283 | -0.159/0.060 | 0.094/0.206 | 1.480/5.017 | -0.137/1.554 |
| 第三产业比重 | -22.896/-10.798 | -4.874/-0.941 | -1.748/0.000 | 1.171/1.528 | 8.942/5.098 | -2.554/4.725 |
| 工业企业主要产品利润率 | -8.227/-36.330 | -2.570/-2.054 | -0.443/0.000 | -0.006/1.280 | 5.596/28.083 | -0.874/3.175 |
| 谷物单位面积产量 | -5.125/-6.914 | -0.741/-0.374 | -0.186/0.375 | 0.061/1.567 | 2.174/20.411 | -0.348/-0.757 |
| 总人口 | -7.417/-6.151 | -2.917/-0.868 | -1.109/-0.589 | -0.330/0.000 | 1.553/32.017 | -1.701/3.831 |
| 工业用水比重 | -19.377/-36.937 | -1.971/-2.680 | -0.527/-0.322 | 0.903/0.000 | 2.678/4.978 | -1.633/12.798 |
| 农业用水比重 | -10.932/-29.492 | -2.223/-2.203 | -0.738/0.000 | 2.531/0.764 | 5.940/19.401 | -0.658/5.029 |
| 单位面积交通里程 | -3.171/-6.629 | -1.096/-0.230 | 0.260/0.164 | 2.438/0.347 | 5.237/1.705 | 0.571/-1.329 |
| COD排放总量 | -0.015/-0.503 | -0.001/-0.009 | 0.005/-0.001 | 0.016/0.005 | 0.049/0.030 | 0.008/-0.030 |
| 污染治理投资百分比 | -7.938/-8.398 | 0.592/-0.630 | 1.814/0.279 | 2.981/3.498 | 44.268/50.999 | 3.440/1.147 |
| 科技市场成交额 | -0.029/-1.852 | -0.004/-0.073 | 0.006/0.027 | 0.011/0.075 | 0.044/0.001 | 0.005/0.089 |
新窗口打开|下载CSV
图2
 新窗口打开|下载原图ZIP|生成PPT
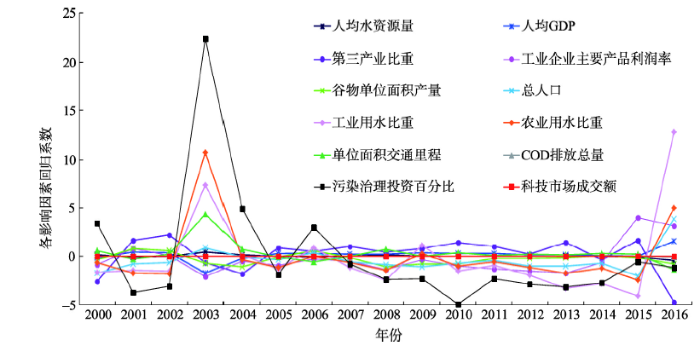
图2中国水资源绿色效率影响因素回归系数变化趋势
Fig. 2The change trend of regression coefficients of influencing factors of green efficiency of water resources in China
由表4可知,2000年、2005年、2010年和2016年的校正模型拟合优度(调整R2)分别为0.701、0.777、0.779和0.810,均高于最小二乘法的拟合优度0.650,GWR模型分别能解释2000年、2005年、2010年和2016年因变量的70.1%、77.7%、77.9%和81%,表明GWR模型的拟合结果要优于OLS模型,且解释效果较好。由表5和图2可知,影响因素的回归系数范围变化幅度较大,且解释变量系数有正有负,可以看出采用传统回归方法得出的回归系数仅能代表总体的平均水平,从而掩盖了部分局部系数特征,说明水资源绿色效率与影响因素之间并非是稳定的系数关系,而由于各地区的实际发展情况不同,导致影响因素表现出较强的空间不稳定性,并随时间而发生变化。
3.2.3 水资源绿色效率驱动因素分析 传统回归模型结果显示,在自然因素中,人均水资源量的回归系数显著为负,表明人均水资源量的增加不利于水资源绿色效率的提升,这与胡鞍钢等[35]、钱文婧等[36]的研究结果相符;社会经济因素中,人均GDP、第三产业比重和单位面积交通里程对水资源绿色效率的提升有显著正向影响,具体表现为三者每增加1%,水资源绿色效率相应提高0.15%、0.48%和0.07%,产业结构和经济发展起主导作用;在几个负向指标中,工农业用水比重、人口规模及工农业发展水平对中国水资源绿色效率的阻滞作用均很显著。数据显示,中国工农业用水比重分别高达22.89%和63.08%,是中国社会发展耗水最多的两个部门,且有研究表明[36],当前中国工业用水效率和农业用水效率均较低,距离最优配置差距较大,特别是工业生产中高耗水产业所占比重大,传统的农业灌溉模式消耗了大量水资源,从而导致中国工农业发展水平远低于西方发达国家,这是中国水资源绿色效率低下的主要原因;人口规模的扩大一直是阻碍中国社会发展的重要因素,由人口扩张所引起的水资源压力愈发严重,从而抑制了水资源绿色效率的提高;环境因素中,COD排放总量和污染治理投资显著为负,表明中国的环境问题依然严峻;科技因素中只有科技市场成交额显著为正,其他两项指标均不显著,这表明科技对水资源绿色效率的影响不在于科技成果和科技投入的多少(或者说二者没有直接影响),而在于科技成果的转化,只有将科技成果有效应用于社会生产,将其转化为生产力,科技因素才能成为水资源绿色效率提升的真正驱动力。
传统模型回归结果仅能代表整体的平均水平,为进一步探究各因素对水资源绿色效率影响的空间变异特征,本文将GWR模型的计算结果借助GIS平台进行可视化表达,从而更直观地对水资源绿色效率的影响因素进行空间变异分析,结果如图3、图4所示。
图3
 新窗口打开|下载原图ZIP|生成PPT
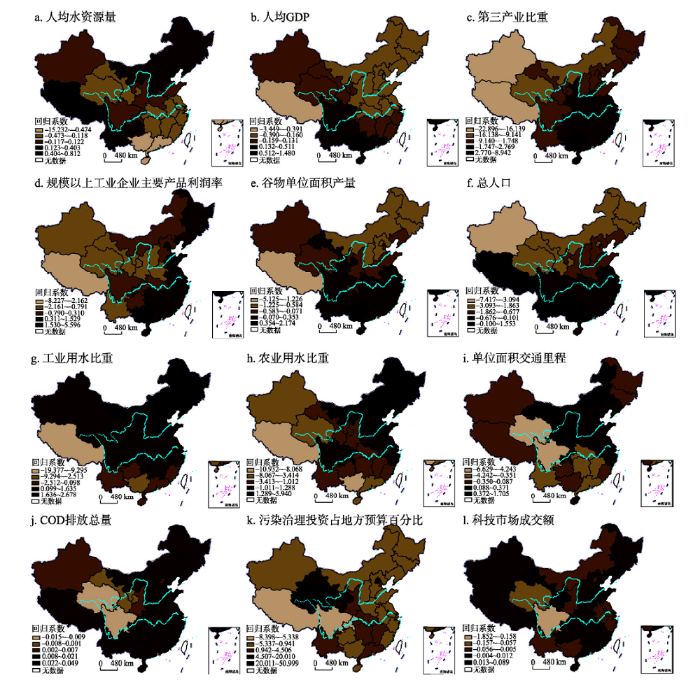
图32000年中国水资源绿色效率各影响因素回归系数估计的空间分布
注:基于国家测绘地理信息局标准地图服务网站下载审图号为GS(2016)1599号的标准地图制作,底图无修改。
Fig. 3Spatial distribution of regression coefficients of water resources green efficiency in 2000
图4
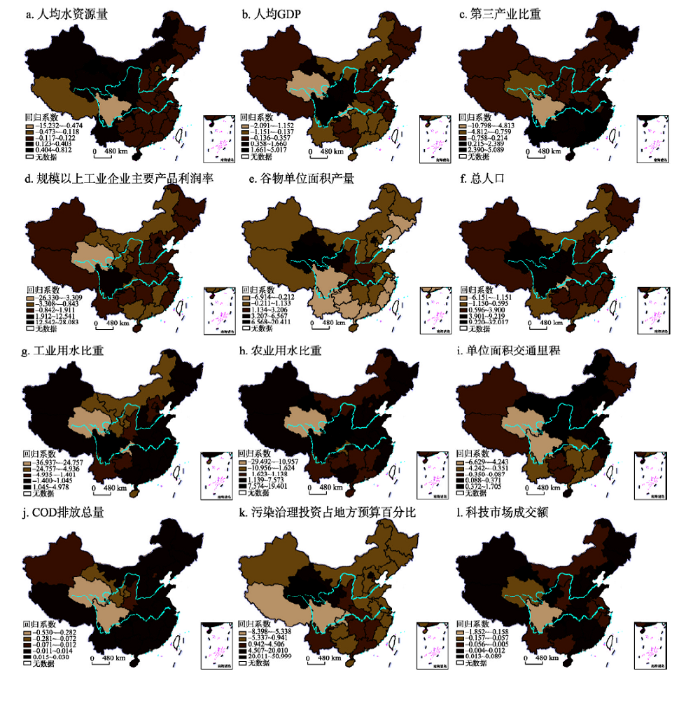 新窗口打开|下载原图ZIP|生成PPT
图42016年中国水资源绿色效率各影响因素回归系数估计的空间分布
注:基于国家测绘地理信息局标准地图服务网站下载审图号为GS(2016)1599号的标准地图制作,底图无修改。
Fig. 4Spatial distribution of regression coefficients of water resources green efficiency in 2016
(1)自然因素对水资源绿色效率的影响。自然因素中水资源禀赋对水资源绿色效率影响显著,由图3a可知,研究初期(2000年)人均水资源量回归系数正值区主要分布在东北、华北和西南地区,总体表现为自西北向东南递减的趋势,东南水资源丰富地区,其回归系数显著为负,表明人均水资源量越多,越不利于水资源绿色效率的提高;研究末期(图4a),人均水资源量对水资源绿色效率的影响程度有所增强,其空间分布格局变化不大,高值区多分布在400 mm等降雨量线(胡焕庸线)以西地区。水资源量东多西少的基本国情,促使西部缺水地区更加注重水资源的高效利用,而东部水资源丰富、取水容易地区,节水意识普遍较差,从而导致水资源丰度对西部地区水资源绿色效率有促进作用,对东部地区起阻滞作用。
(2)社会经济因素对水资源绿色效率的影响。就经济水平而言,研究初期人均GDP对水资源绿色效率的影响程度表现为自西北向东南递增的趋势(图3b),研究末期其空间分布格局呈散乱分布状态(图4b);从其正值区数量来看,研究期内人均GDP回归系数正值区数量虽有所上升,但经济发展水平高的地区并不都是效率高效区。相反,经济发展水平低的西藏、青海等地区,水资源绿色效率却远高于一些东部发达地区(如河北、山东),表明经济发展水平不是水资源绿色效率高低的决定因素,这与孙才志等的研究结果相符[37]。而马海良等有关****认为经济水平同水资源利用效率呈显著正相关[10],即人均GDP高的地区水资源利用效率也相对较高(空间上东高西低)。这与本文的研究结果有所不同,原因在于,本文所选取用来测度水资源绿色效率的指标与马海良等有着较大区别,本文不仅考虑了水资源利用所产生的经济效益和环境效益,还考虑了体现以人为本的社会效益,从而造成测度值的不同。
就产业结构而言,第三产业比重回归系数(图3c、图4c)由西北向东南逐渐增长,说明第三产业比重对中国水资源绿色效率的影响程度由西北向东南逐步增大。从回归系数正值区数量来看,研究初期(2000年)正值区数量仅有11个,在空间上集中分布在东南沿海地区,到研究末期(2016年)正值区数量有所增加,其空间分布格局有向中西部扩散的趋势,表明第三产业比重增加有利于水资源绿色效率的提高,主要原因在于,相对于第一、二产业而言,第三产业用水比重少,且利用率较高。总体而言,东南地区的经济结构优于西北地区,在调整产业结构方面,西北地区的调整潜力大于东南地区,因此,在相同条件下,如果西北地区有意识的增加第三产业比重,则可以获得比东南地区更多的利益。
从工农业发展水平来看,研究初期(图3d、图3e),规模以上工业企业主要产品利润率的回归系数自西向东梯次增大,谷物单位面积产量自北向南依次增大,表明工业发展水平对中国水资源绿色效率的影响程度由西向东逐渐增大,农业发展水平对中国水资源绿色效率的影响程度自南向北逐渐增强;研究末期(图4d、图4e),两者的空间格局没有明显规律,呈空间散布状态,但从其正值区数量来看,二者正值区数量均有所增加,且回归系数也有所增大,工业发展水平正值区有向中西部扩散的趋势,农业发展水平正值区也逐渐扩展到广大北方地区,这与中国近年来新型工业化和农业现代化建设不可分割。研究初期,西北地区受制于脆弱的生态环境和复杂多变的地形,工农业发展水平不高,随着经济和技术的发展,东南地区先进的工农业产业得以向西北地区扩散转移,因此,西北地区应该抓住机遇,积极引进东南地区的先进技术和资金,大力推进新型工业化和农业现代化进程,使工农业发展对水资源绿色效率的提升产生更多积极影响。
从人口规模来看,研究初期(图3f),总人口的回归系数由北向南梯次增大,说明人口规模对中国水资源绿色效率的影响程度南方大于北方,研究末期(图4f),其空间格局有所变化,回归系数大致呈现自西向东逐渐减小的趋势,表明此时人口规模的影响程度西部大于东部。从其回归系数正值区数量来看,研究期内,正值区数量较少且变化不大,集中分布于西部人口稀疏地区,表明人口规模的扩大仅对西部个别人口稀少的地区有促进作用,而对大多数地区而言,不利于水资源绿色效率的提高。因此,各地区应在统一性政策框架下,因地制宜地制定并实施适合本地发展的人口政策,从而降低人口规模对水资源绿色效率的阻滞作用。
就用水结构而言,工业用水比重与农业用水比重表现为相似的空间分布状态。2000年(图3g、图4g),工农业用水比重回归系数自东北向西南依次递减,表明此时工农业用水比重对中国水资源绿色效率的影响程度自东北向西南逐渐减小,这与研究初期中国产业结构的分布有关,东北和华北地区是中国工业最发达的地区之一,且是全国粮食主产区,工农业用水比重的增加能够带来巨大的经济利益,推动地区发展,因此其作用效果东北大于西南;2016年(图3h、图4h),工农业用水比重的空间分布状态发生改变,且回归系数有所增大,表明工农业用水比重对水资源绿色效率的影响力加强。回归系数正值区多分布在“胡焕庸线”以东地区,这是因为随着经济的发展,中东部地区对其产业结构进行优化改善,使工农业耗水量不断降低,从而促进水资源绿色效率的提升,而西部地区由于经济的限制,继续保持着传统的生产方式,工农业用水效率低下,浪费严重,从而阻滞了水资源绿色效率的提高。
交通基础设施对水资源绿色效率也有显著影响,从图3i可以看出,研究初期,单位面积交通里程回归系数高值区分布在西藏、东北和华北等地,总体表现为东北、西南地区大于西北、东南地区。研究末期(图4i),这种趋势有所变化,总体表现为由东北向西南递减的趋势。从正值区数量来看,研究期内回归系数正值区数量有所增加,在空间上主要分布于东中部地区,表明交通基础设施建设有利于水资源绿色效率的提高,且东中部地区的基础设施建设水平明显优于西部。因此,西部地区应加强交通基础设施的建设,以此推动社会经济发展,促进水资源绿色效率的提升。
综合来看,社会经济因素对水资源绿色效率的提高具有显著促进作用,经济发展是基础,经济水平的提高能有效促进地区生产方式转型和产业结构升级,能够加大基础设施建设、环境保护、科技等方面的投入力度,有助于提高水资源的节约和保护水平,从而促进社会发展,增强经济社会的可持续发展能力。社会发展能够为经济发展创造良好的发展环境,扩大产业经济效益,促进经济发展方式和用水方式的转变,形成社会经济发展的良性循环,以经济增长和社会转型全面推动水资源绿色效率和效益的提升。
(3)环境因素对水资源绿色效率的影响。环境因素中污染程度和环保投入对水资源绿色效率有显著影响,从COD排放总量回归系数的空间分布来看(图3j、图4j),研究初期,回归系数由南向北依次递减,且在大部分地区表现为正;研究末期,空间分布格局表现为自西北向东南逐渐增大的趋势,但正值区数量明显减少,表明以牺牲环境为代价的经济发展越来越不利于水资源绿色效率的提高。由图3k、图4k可知,研究期内,环境治理投资的回归系数在大多数地区表现为正,表明环境污染治理投资的增加有利于水资源绿色效率的改善。
(4)科技因素对水资源绿色效率的影响。科技因素中仅科技转化率这一指标对水资源绿色效率有显著影响。从科技市场成交额回归系数的空间分布(图3l、图4l)来看,2000年回归系数自西北向东南逐渐减小,表明研究初期科技对水资源绿色效率的影响力为西北地区大于东南地区,2016年回归系数高值区均匀分布于东中西各部;从回归系数的大小和正值区数量来看,科技市场成交额回归系数虽远小于其他因素,但在绝大多数地区显著为正,表明科技转化率的提高有利于水资源绿色效率的提升,因此,各地区应加大科学研究的投资力度,并注重科研成果的转化,从而使技术成为水资源绿色效率新的增长极。
4 结论
本文将社会发展指数纳入到水资源利用效率评价体系,对中国水资源绿色效率进行测度及空间相关性分析,并选取自然、社会经济、环境、科技四大因素共19个指标,运用GWR模型对水资源绿色效率的驱动机理进行了探究。结果表明:中国水资源绿色效率存在着显著的全局空间自相关和局部空间自相关特征,为GWR模型的运用提供了条件;OLS模型得出的回归系数结果仅能代表水资源绿色效率总体的平均特征,GWR模型解决了OLS模型掩盖局部系数特征的缺陷,证明了水资源绿色效率与影响因素之间存在着较强的空间不稳定性,且会随着时间而发生变化;人均水资源量的增加对西部缺水地区水资源绿色效率的提高有促进作用,而对东南丰水地区具有抑制作用;经济发展水平不是水资源绿色效率增长的决定性因素,社会发展指数对水资源绿色效率有重要影响;第三产业比重增加有利于水资源绿色效率的提高,尤其是西部地区,产业结构调整潜力优于东部;工农业发展水平对水资源绿色效率提高有促进作用,且具有显著的空间溢出效应;人口规模扩大仅对西部个别人口稀少的地区具有促进作用,对大多数地区则抑制了水资源绿色效率的提高;研究期内,工农业用水比重对水资源绿色效率的影响力加强,且影响效力东部大于西部;交通基础设施建设有利于经济发展,从而促进水资源绿色效率提高;污染物排放量增加虽有利于经济的发展,但这种以牺牲环境为代价的经济发展正逐渐成为水资源绿色效率提高的限制性因素;从全局来看,环境治理投资的增加有利于水资源绿色效率的改善;技术市场成交额有利于水资源绿色效率的提高,各地区应加大科学研究的投资力度,注重科研成果的转化,使技术成为水资源绿色效率新的驱动力。参考文献 原文顺序
文献年度倒序
文中引用次数倒序
被引期刊影响因子
[本文引用: 1]
[本文引用: 1]
[本文引用: 1]
[本文引用: 1]
[本文引用: 1]
[本文引用: 1]
[本文引用: 1]
[本文引用: 1]
[本文引用: 1]
[本文引用: 1]
[本文引用: 1]
[本文引用: 1]
[本文引用: 1]
[本文引用: 1]
[本文引用: 1]
[本文引用: 1]
[本文引用: 1]
[本文引用: 1]
[本文引用: 2]
[本文引用: 2]
[本文引用: 1]
[本文引用: 1]
[本文引用: 1]
[本文引用: 1]
[本文引用: 1]
[本文引用: 1]
DOI:10.1007/s11442-014-1119-xURL [本文引用: 1]

Based on provincial panel data of water footprint and grey water footprint, and with the help of data envelopment analysis model considering and without considering the undesirable output, this paper estimates the water resources utilization efficiency in China from 1997 to 2011. The spatial weighting matrix based on economy-spatial distance function is established to discuss spatial autocorrelation of water resources utilization efficiency. With the help of absolute β-convergence model, this paper concludes that there exists β-convergence in the water resources utilization efficiency. Under the conditions of considering and without considering the undesirable output, it takes about 52.6 and 5.6 years respectively to achieve the extent of half of convergence. By mean of the spatial Durbin econometric model, this paper studies spatial spillover effects of the provincial water resources utilization efficiency in China. The results are as follows. 1) With considering and without considering the undesirable output, there is significant spatial correlation in provincial water resource efficiency in China. 2) Under the two cases, the spatial autoregressive coefficients (ρ) are 0.278 and 0.507 respectively, at 1% significance level. There exist the spatial spillover effects of provincial water resources utilization efficiency. 3) With considering the undesirable output, these factors of the education funds, the transportation infrastructure, and the industrial and agricultural water consumption proportion have positive impacts. These factors of foreign direct investment, the industry value-added water consumption per ten thousand yuan, per capita water consumption, and the total precipitation have negative impacts. 4) Without considering the undesirable output, the factor of GDP per laborer has a greater positive significant influence on the water resources utilization efficiency. However the facts of industry value-added water consumption in ten thousand yuan and the transportation infrastructure have no significant influence. 5) Regardless of undesirable output of water resources utilization efficiency, the assessment of the present real water resources utilization in China will be distorted and policy-making will be misled. The water efficiency measure considering environmental factors (such as gray water footprint) is more reasonable.
DOI:10.11821/dlxb201401012URL [本文引用: 1]
Based on provincial panel data of water footprint and grey water footprint, and with the help of data envelopment analysis model considering and without considering the undesirable output, this paper estimates the water resources utilization efficiency in China from 1997 to 2011. The spatial weighting matrix based on economy-space distance function is established to discuss spatial autocorrelation of water resources utilization efficiency. With the help of absolute β convergence model, this paper concludes that there exists β convergence in the water resources utilization efficiency. Under the condition of considering and without considering the undesirable output, it takes about 52.6 and 5.6 years respectively to achieve the extent of half of convergence. By mean of the space Durbin econometric model, this paper studies spatial spillover effects of the provincial water resources utilization efficiency in China. The results show that, 1) With considering and without considering the undesirable output, there is significant spatial correlation in provincial water resource efficiency in China. 2) Under the two cases, the spatial autoregressive coefficients (ρ) are 0.278 and 0.507 respectively, at 1% significance level. There exist the spatial spillover effects of provincial water resources utilization efficiency. 3) With considering the undesirable output, these factors of the education funds, the transportation infrastructure, and the proportion of industrial and agricultural water have positive impacts. These factors of foreign direct investment, the industrial added value water consumption in ten thousand yuan, per capita water consumption, and the total precipitation have negative impacts. 4) Without considering the unexpected output, the factor of GDP per labor has a greater positive significant influence on the water resources utilization efficiency. However the facts of industrial added value water consumption in ten thousand yuan and the transportation infrastructure have no significant influence. 5) Regardless of undesirable output of water resources utilization efficiency, the assessment of the present real water resources utilization in China will be distorted and policy-making will be misled. The water efficiency measure considering environmental factors (such as gray water footprint) is more reasonable.
[本文引用: 1]
[本文引用: 1]
[本文引用: 1]
[本文引用: 1]
[本文引用: 1]
[本文引用: 1]
[本文引用: 1]
[本文引用: 1]
[本文引用: 1]
[本文引用: 1]
[本文引用: 1]
[本文引用: 1]
[本文引用: 1]
[本文引用: 1]
[本文引用: 1]
[本文引用: 1]
[本文引用: 1]
[本文引用: 1]
[本文引用: 1]
[本文引用: 1]
[本文引用: 1]
[本文引用: 1]
[本文引用: 1]
[本文引用: 1]
[本文引用: 1]
[本文引用: 1]
[本文引用: 1]
[本文引用: 1]
[本文引用: 1]
[本文引用: 1]
[本文引用: 1]
[本文引用: 1]
[本文引用: 1]
[本文引用: 1]
[本文引用: 1]
[本文引用: 1]
[本文引用: 1]
[本文引用: 1]
[本文引用: 2]
[本文引用: 2]
[本文引用: 1]
[本文引用: 1]
