 ,中国农业大学动物科技学院,畜禽育种国家工程实验室,农业农村部动物遗传育种与繁殖重点实验室,北京 100193
Measuring genetic connectedness between herds based on high density SNP markers
Ziwen Zhou, Xue Wang, Xiangdong Ding,National Engineering Laboratory for Animal Breeding, Key Laboratory of Animal Genetics, Breeding and Reproduction of Ministry of Agriculture and Rural Affairs, College of Animal Science and Technology, China Agricultural University,Beijing 100193, China通讯作者: 丁向东,博士,副教授,研究方向:猪遗传育种和统计遗传学。E-mail:xding@cau.edu.cn
编委: 李明洲
收稿日期:2020-10-19修回日期:2021-02-17网络出版日期:2021-04-16
| 基金资助: |
Received:2020-10-19Revised:2021-02-17Online:2021-04-16
| Fund supported: |
作者简介 About authors
周子文,在读硕士研究生,专业方向:动物遗传育种。E-mail:

摘要
联合育种的准确性受到群体间遗传关联程度的影响。本研究通过比较基于系谱数据和基因组数据计算的群体遗传关联,探究高密度SNP标记在遗传关联估计中的应用前景。本研究同时使用了模拟数据和真实数据,采用6种不同的遗传关联计算方法,包括PEVD(prediction error variance of differences)、PEVD(x)、VED(variance of estimated difference)、CD(generalized coefficient of determination)、r(prediction error correlation)和CR(connectedness rating),比较基于构建不同的关系矩阵(A、G、Gs、G0.5和H矩阵)的群体间遗传关联。模拟数据和实际数据结果表明,除PEVD(x)和VED方法外,PEVD、CD、r和CR基于基因组信息的G、Gs和G0.5阵计算的遗传关联程度均高于基于系谱信息的A阵,基于同时利用系谱和基因组信息的H阵遗传关联结果一般介于A阵与G阵之间。当CR和r为0时,CD都较高,高估了群体遗传关联。用r度量3个遗传分化程度不同的猪场间遗传关联时,基于G阵的r值均为0.01,不能准确反映群体真实遗传关联。随着遗传力的提高,所有群体遗传关联评估方法都有所改善,但遗传力为0.1时,PEVD基于A阵结果优于G阵,中高遗传力性状用于估计遗传关联优于低遗传力性状。本研究证明高密度SNP标记比系谱信息估计群体间遗传关联更有优势,CR是衡量遗传关联稳健而可靠的评价指标,计算简单,受性状遗传力影响较小。PEVD可以作为补充,量化具体群体遗传关联下的育种值预测误差情况。G矩阵比Gs、G0.5阵能更好反映群体遗传关联。
关键词:
Abstract
The accuracy of genetic evaluations in different herds is affected by the degree of genetic connectedness among herds. In this study, we explored the application of high density SNP markers in the assessment of genetic connectedness by comparing the genetic connectedness based on pedigree data and genomic data. Six methods, including PEVD (prediction error variance of differences between estimated breeding values), PEVD (x), VED (variance of estimated difference between the herd effects), CD (generalized coefficient of determination), r (prediction error correlation) and CR (connectedness rating), were implemented to measure the genetic connectedness based on different relationship matrices (A, G, Gs, G0. 5 and H). Our results from both simulated data and SNP chip data indicated that, except for the PEVD (x) and VED methods, the genetic connectedness obtained by PEVD, CD, r and CR based on G. Gs and G0.5 matrices (using genome information only) were superior to those based on A matrix (using pedigree information only). Generally, for most approaches, the genetic connectedness based on H matrix (using both pedigree and genome information) was somewhere between A matrix and G matrices. CD could overestimate the degree of genetic connectedness as it was still very high when CR and r were close to 0. The method r could not accurately reflect the true genetic connectedness of the populations. It generated 0.01 of genetic connectedness for all three pig breeding farms, which were actually genetically different with each other. With increasing of heritability, the degree of genetic connectedness obtained by all methods were increased as well. However, in the case of heritability 0.1, PEVD based on A matrix performed better than based on G matrix, suggesting that traits with medium and high heritability are more suitable for the assessment of genetic connectedness compared to traits with low heritability. Our findings indicated that high-density SNP markers have advantages over pedigree analysis for the measurement of genetic connectedness, and CR is a robust and reliable method to assess genetic connectedness. Further, CR is easily calculated and less affected by heritability of trait. PEVD is good supplement to quantify the prediction errors of estimated breeding values under the specific genetic connectedness. In comparison, G matrix can reflect genetic connectedness better than its extensions Gs and G0.5 matrix.
Keywords:
PDF (571KB)元数据多维度评价相关文章导出EndNote|Ris|Bibtex收藏本文
本文引用格式
周子文, 王雪, 丁向东. 基于高密度SNP标记估计群体间遗传关联. 遗传[J], 2021, 43(4): 340-349 doi:10.16288/j.yczz.20-351
Ziwen Zhou.
联合评估是家畜育种中一种有效方式,可将不同国家、地区、育种组织的育种数据联合起来对个体进行遗传评估,由于扩大了群体规模,从而提高了育种值估计的准确性,而且能够进行大范围内种畜的比较和选种,实现联合育种。奶牛、猪育种中这一做法十分通行,但多个群体的联合遗传评估,群体间存在关联是前提,表现为群体具有遗传上的关联或者由于相同环境造成的关联[1],从而使多个群体的联合评估可以在同一尺度上进行比较。相同环境所造成的群体关联主要通过不同群体在中心测定站统一进行性能测定实现,但由于中心测定站测定规模限制,此种群体关联影响有限。群体关联更多是由于场间遗传交流产生的遗传联系,如我国生猪遗传改良计划开展的联合遗传评估,通过场间遗传交流建立不同生猪核心育种场之间的遗传联系,形成了杜洛克、长白和大白3个品种多个遗传关联组[2]。每个关联组联合评估与单场遗传评估相比,遗传参数估计和个体育种值估计准确性更高[3],并且可以进行个体跨场比较,挑选优秀种猪。
群体遗传关联有多种估计方法,可以分为两大类:育种值估计预测误差方差和育种值比较的可靠性或相关系数。第一种主要有预测误差方差方法(prediction error variance of differences, PEVD)[4]、PEVD(x)[5]和场效应差异的估计方差(variance of estimated difference, VED)[4]。从理论上说,PEVD是一种较为理想的度量遗传关联的方法,该方法通过计算不同个体之间育种值(estimated breeding value, EBV)差异的预测误差方差,评价两个个体育种值比较的准确性,但该方法计算复杂,难以用于育种实践[4]。PEVD(x)和VED是PEVD的近似估计方法,PEVD(x)通过构建一个差异向量x近似估计PEVD,进行简化计算[5],VED主要计算场效应之间的预测误差方差[4]。第二类群体遗传关联估计方法主要有广义决定系数方法(generalized coefficient of determination, CD)[5]、预测误差相关系数(prediction error correlation, r)[6]和场间关联率(connectedness rating, CR)[7]。CD定义为估计育种值比较的可靠性,即预测值差异与真实值差异间相关系数的平方[5],r通过计算两个群体之间两两配对的预测误差相关系数均值来评价遗传关联程度[6]。CR主要计算场效应之间的相关,或者群体均值估计误差之间的相关[7]。
遗传关联计算通常基于系谱数据[8],但是系谱数据难以保证其完整性和准确性,会导致部分场间遗传关联低于真实情况,或者产生错误的场间遗传关联。如果两个群体均有基因组数据,则即便缺乏完整准确的系谱记录,也可以估计遗传关联,从而拓展了遗传关联方法的使用范围。使用基因组数据估计遗传关联的另一个主要优势为基因组数据能够真实反映个体间亲缘关系,通过基因组数据构建的个体间关系矩阵比基于系谱信息的更加准确[9,10,11],可以捕捉到系谱数据中不存在的遗传关联。
本研究旨在通过比较不同群体关联估计方法基于系谱和SNP芯片数据计算的遗传关联,探究基因组数据在遗传关联估计中的应用效果及各种群体关联估计方法的优劣。
1 数据与方法
1.1 模拟数据
本研究采用GPOPSIM[12]软件模拟基因组数据。模拟了18条染色体,每条染色体长度为100 cM, 染色体总长度为18 M,总共模拟了306个QTL,随机分布在染色体组上。SNP标记和QTL的突变率分别为1.25×10⁻⁶和2.5×10⁻³。从每条染色体上均匀抽取2834个SNP,共51,012个SNP,生成基因型数据。表型数据由软件模拟生成,遗传力设定为0.3,遗传方差为2。群体模拟首先生成一个1000世代的历史群体,每个世代群体规模保持不变,均由300头公畜和300头母畜组成,公母随机交配,每头母畜产生10个后代,公母各半。从第1000个世代群体后代中随机抽取,生成两个亚群,每个亚群均由20头公畜和600头母畜构成。每个亚群内,每头公畜与30头母畜随机交配,每头母畜产生10个后代,公母比例1∶1,记为世代1。从世代2开始,每个亚群内均从上一世代随机选择20头公畜与1500头母畜交配,母畜产生后代数与性别比例同世代1,不同世代群体大小保持不变。重复上述过程,直至世代7,两个亚群间不发生遗传交流。两个亚群世代1至世代7所有个体均有表型,仅第5世代至第7世代每个亚群各有3000个体(每个公畜家系中一半个体)具有基因型数据。
1.2 真实数据
本研究同时利用3家国家生猪核心育种场(以下简称“核心场”)北京六马养猪科技股份有限公司(场代码BJLM,简称“北京六马”)、北京养猪育种中心(场代码BBSC,简称“养猪中心”)及新疆天康畜牧科技有限公司(场代码XJTC,简称“新疆天康”)2012~2019年大白猪数据。北京六马和养猪中心种猪来源于美国,新疆天康来源于加拿大。3家核心场生长性状达100 kg体重日龄和100 kg活体背膘厚表型数据分别为33,883、13,259和13,763条,系谱数据各有36,577、75,255和14,409条,具有SNP芯片基因型个体数为2382、1712和1239头。北京六马和养猪中心的基因型数据均采用PorcineSNP80K Beadchip芯片(简称80K)测定,共包含68,528个SNP位点;新疆天康的基因型数据则由PorcineSNP50K Beadchip芯片(简称50K)测定,共包含50,697个SNP位点。两种芯片均参照猪参考基因组11.1版本,除去未知染色体上的位点后,两款芯片共同位点数为48,675。芯片基因型填充步骤分两步进行,首先对80K芯片个体进行填充,剔除未知染色体和常染色体上的位点,之后将其作为参考群对所有50K芯片个体进行填充,芯片数据填充处理使用beagle[13]软件完成。填充后对芯片数据进行如下质控处理:(1)个体检出率(call rate)达到90%以上;(2)单个SNP检出率达到90%以上;(3)SNP位点的最小等位基因频率不低于0.05;(4)每个SNP位点哈代-温伯格平衡检验P值大于10-6。质控筛选后,所有基因型个体、45569个SNP位点满足要求。
1.3 育种值估计模型
群体关联估计主要基于育种值估计,本研究所有群体遗传关联方法计算均基于以下育种值估计模型:$y=\text{X}b+\text{Z}a+e$
其中,y为单一性状表型值向量(实际数据用达100kg体重日龄);b为场效应向量;a为加性遗传随机效应或育种值向量,服从正态分布N(0,$K\sigma _{a}^{2}$),$\sigma _{a}^{2}$为加性遗传方差,K阵为亲缘关系矩阵,可使用A阵、G阵、H阵等,主要基于系谱信息、基因组信息或同时利用系谱-基因组信息建立;e为随机残差,服从正态分布N(0, I$\sigma _{e}^{2}$)),$\sigma _{e}^{2}$为残差方差;X和Z为相应的结构矩阵。
1.4 遗传关联计算方法
本研究使用PEVD、PEVD(x)、VED、CD、r和CR等6种方法估计群体遗传关联。PEVD计算公式如下:$\begin{align} & \text{PEVD}({{{\hat{\mu }}}_{i}}-{{{\hat{\mu }}}_{j}})=[\text{PEV}({{{\hat{\mu }}}_{i}})+\text{PEV}({{{\hat{\mu }}}_{j}})- \\ & \ \ \ \ 2\text{PEC}({{{\hat{\mu }}}_{i}},{{{\hat{\mu }}}_{j}})]=(\text{C}_{ii}^{22}+\text{C}_{jj}^{22}-2\text{C}_{ij}^{22})\sigma _{e}^{2} \\ \end{align}$
其中$\operatorname{PEV}({{\hat{u}}_{i}})$、$\operatorname{PEV}({{\hat{u}}_{j}})$和$\operatorname{PEC}({{\hat{u}}_{i}},{{\hat{u}}_{j}})$分别为个体加性效应的预测误差方差和协方差,${{\mathbf{C}}^{22}}$矩阵为系数矩阵逆矩阵的子矩阵,$\sigma _{e}^{2}$为残差方差。以上参数均可通过育种值估计模型求解获得。群体间PEVD通过计算属于不同群体的所有个体两两配对的PEVD均值得到;群体内PEVD通过计算单个群体内的所有个体两两配对的PEVD均值得到。
PEVD(x)方法参照Lalo?等[5]。VED、CD、r 和 CR 方法计算公式如下:
$VED=\text{var}(\hat{h}_{1})+\text{var}(\hat{h}_{2})-2\text{cov}(\hat{h}_{1},\hat{h}_{2})$
$\text{C}{{\text{D}}_{ij}}=1-\lambda \frac{\mathbf{C}_{ii}^{22}+\mathbf{C}_{jj}^{22}-2\mathbf{C}_{ij}^{22}}{{{\mathbf{K}}_{ii}}+{{\mathbf{K}}_{jj}}-2{{\mathbf{K}}_{ij}}}$
${{\text{r}}_{ij}}=\frac{\operatorname{PEC}({{{\hat{u}}}_{i}},{{{\hat{u}}}_{j}})}{\sqrt{\operatorname{PEV}({{{\hat{u}}}_{i}})\operatorname{PEV}({{{\hat{u}}}_{j}})}}$
$\text{CR}=\frac{\text{cov}(\hat{h}_{1},\hat{h}_{2})}{\sqrt{\text{var}(\hat{h}_{1})\text{var}(\hat{h}_{2})}}$
其中${{\mathbf{K}}_{ii}}$、${{\mathbf{K}}_{jj}}$和${{\mathbf{K}}_{ij}}$为关系矩阵中的相应元素,$\lambda $为随机残差与加性方差的比值;$\text{var}(\hat{h}_{1})$、$\text{var}(\hat{h}_{2})$和$\text{cov}(\hat{h}_{1},\hat{h}_{2})$分别为场效应的方差和协方差。与PEVD类似,群体间的CD和r计算方法为群体间所有个体两两匹配求均值。本研究中所有遗传关联方法计算均通过自编R程序实现。6种计算方法中,CD、r和CR范围在0~1之间,当r或CR为0时,说明两个群体之间缺乏遗传关联,CD、r和CR值越大说明遗传关联程度越高。PEVD、PEVD(x)和VED值越小,说明遗传关联程度越高。
1.5 亲缘关系矩阵构建
本研究主要利用系谱数据和SNP芯片数据,构建1.3中的K阵,包括A阵、G阵、Gs阵、G0.5阵和H阵。G阵构建参照VanRaden等[14],为防止G阵为奇异阵导致无法求逆,本研究中将G阵对角线元素均增加了0.01[15]。研究表明,使用G阵计算预测误差相关系数r时,r容易出现负值[16,17]。本研究通过将G阵中的负值替换为0,避免了r和CR方法结果出现负值。G阵构建中需要每个标记在基础群体时的最小等位基因频率,通常用当前群体的最小等位基因频率代替,G0.5矩阵将最小等位基因频率均假设为0.5[18,19]。为校正G阵中元素大小,使G阵与A阵尺度保持一致。本研究将G阵中的所有元素校正到给定的最小值和最大值的范围之内,命名为Gs阵。Gs矩阵构建方法如下:
${{\mathbf{G}}_{{{\mathbf{s}}_{\mathbf{ij}}}}}=\frac{({{\mathbf{G}}_{\text{smax}}}-{{\mathbf{G}}_{\text{smin}}})({{\mathbf{G}}_{ij}}-{{\mathbf{G}}_{\min }})}{{{\mathbf{G}}_{\max }}-{{\mathbf{G}}_{\min }}}$
其中Gsmax、Gsmin为给定的Gs矩阵的最大值和最小值,本研究分别设定为2和0,以模拟A阵中的最大值和最小值;Gmax、Gmin为G阵中的最大值和最小值;Gij为相应的G阵元素。
本研究H阵构建参照Legarra等[20],其中H阵中使用的G阵经过了两步校正,第一步校正参照Legarra等[20],生成一个新的矩阵Ga,保证G阵和A阵具有相同的尺度。由于基因型数据不能完全解释基因组信息,赋予Ga阵和A阵不同的权重,生成新的Gw阵,最终用于H阵构建。本研究Ga阵和A阵权重分别为0.95和0.05。
2 结果与分析
2.1 群体关联估计方法和关系矩阵影响
表1反映了基于模拟数据,6种群体关联估计方法和5种关系矩阵对群体关联估计的影响。以模拟数据第5世代两个亚群群体关联结果为例,使用G阵相较于A阵能够提高群体遗传关联。PEVD从1.65降至1.32,G0.5阵则进一步使PEVD降低至0.9285。基于Gs阵估计的PEVD高于G阵,但仍低于A阵,同时利用系谱和基因组信息的H阵PEVD与G阵接近。作为PEVD的扩展,PEVD(x)和VED方法却呈现了相反趋势,G、Gs、G0.5阵结果劣于A阵,基于A阵的PEVD(x)和VED过低,接近于0。由于受A阵影响,基于H阵的PEVD(x)和VED也很小,分别为0.002和0.004。G、Gs、G0.5矩阵PEVD(x)和VED在0.27~0.42间变化,G0.5最小,Gs最大。Table 1
表1
表1不同群体关联估计方法基于关系矩阵A、G和H群体遗传关联汇总(模拟数据第5世代)
Table 1
| 方法 | 关系矩阵 | ||||
|---|---|---|---|---|---|
| A | G | G0.5 | Gs | H | |
| PEVD | 1.6471 | 1.3218 | 0.9285 | 1.5287 | 1.3725 |
| PEVD(x) | 0.0003 | 0.3248 | 0.2662 | 0.4165 | 0.0016 |
| VED | 0.0019 | 0.3279 | 0.2690 | 0.4196 | 0.0037 |
| CD | 0.5882 | 0.6896 | 0.6790 | 0.7366 | 0.6550 |
| r | 0 | 0.0008 | 0.7478 | NaN | 0.0003 |
| CR | 0 | 0.0031 | 0.9109 | 0.0035 | 0.0200 |
新窗口打开|下载CSV
对于r和CR,通过系谱数据计算两个亚群遗传关联均为0,表明由于世代分隔较远,两个群体从系谱衡量已没有遗传联系。但基于基因组信息的不同关系矩阵,r和CR结果均不为零,表明基因组数据能够捕捉系谱中不存在的遗传关联。r和CR基于G和H很低,分别为(0.0008,0.0003)和(0.003,0.02),基于G0.5则高达0.75和0.91。r基于Gs由于出现负值导致不可计算,CR则与基于G阵接近。与r和CR相比,决定系数CD所有情况下都较高,在0.59~0.69之间,G阵高于A阵,Gs阵最高。对于大多数遗传关联估计方法,H阵结果均介于A阵与G阵之间。
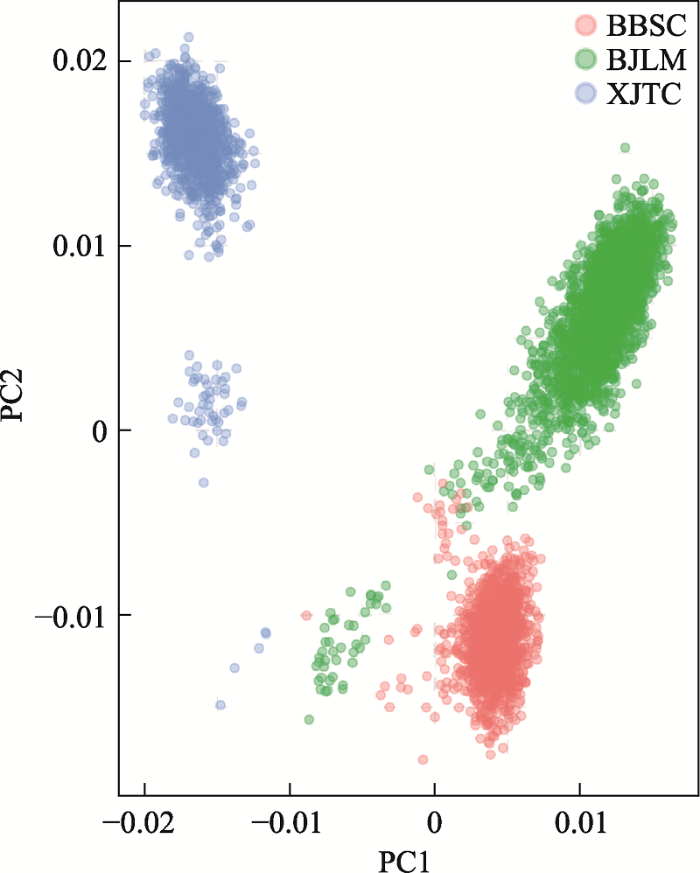
表2反映了基于3家核心场的群体关联估计方法和关系矩阵对群体关联大小的影响。由于3个场之间没有系谱联系,没有考虑综合系谱和基因组信息的H矩阵。主成分分析表明3个群体在基因组信息上存在联系,如图1所示,养猪中心与北京六马群体都为美系大白,遗传背景较为接近,新疆天康和养猪中心群体分化最大。场间关联结果也基本表明,大多数情况下养猪中心与北京六马群体关联更高些。在PEVD、PEVD(x)和VED三种方法中,由于没有系谱联系,基于A阵的PEVD最大,例外情况是,养猪中心与新疆天康之间的遗传关联,基于G阵和Gs阵计算的PEVD高于A阵。所有情况下,G阵和Gs阵PEVD结果接近,基于G0.5的PEVD最小。与模拟数据结果类似,PEVD(x)和VED方法基于G、Gs、G0.5阵结果劣于A阵,基于A阵的PEVD(x)和VED为0.02~0.06,远低于G阵及其扩展矩阵。在不同G阵结果中,G0.5阵PEVD(x)和VED最小,但对于养猪中心与新疆天康,G0.5阵PEVD(x)和VED高于G阵与Gs阵,所有情况下,G阵与Gs阵结果类似。基于A阵计算的3家核心场之间的预测误差相关r和关联率CR均为0,但决定系数CD较高,在0.55~0.67之间,与模拟数据结果反映的趋势相似。使用基于基因组信息的G阵及其校正矩阵计算的r和CR都不为零,3个场基于G阵的 r均为0.01,CR分别为0.15、0.07和0.04。3个场基于Gs的r和CR与基于G阵接近,但3个场基于G0.5的r和CR很高,分别为(0.59,0.49,0.48)和(0.94,0.82,0.82)。同时,3个场基于G、Gs、G0.5的CD值与基于A阵相差不大,在0.59~0.68之间变化。
Table 2
表2
表23家猪育种场基于不同估计方法和关系矩阵A、G遗传关联汇总
Table 2
| 群体 | 方法 | 关系矩阵 | |||
|---|---|---|---|---|---|
| A | G | Gs | G0.5 | ||
| BJLM-BBSC | PEVD | 15.5600 | 11.9300 | 12.3100 | 9.0500 |
| PEVD(x) | 0.0200 | 1.0600 | 1.1100 | 0.8600 | |
| VED | 0.0500 | 1.0800 | 1.1300 | 0.8800 | |
| CD | 0.5500 | 0.6700 | 0.6800 | 0.6700 | |
| r | 0 | 0.0100 | 0.0200 | 0.5900 | |
| CR | 0 | 0.1500 | 0.1500 | 0.9400 | |
| BJLM-XJTC | PEVD | 15.1500 | 14.1300 | 13.4300 | 11.3200 |
| PEVD(x) | 0.0200 | 2.5200 | 2.3300 | 2.3000 | |
| VED | 0.0400 | 2.5400 | 2.3500 | 2.3300 | |
| CD | 0.5600 | 0.6200 | 0.6100 | 0.6200 | |
| r | 0 | 0.0100 | 0.0100 | 0.4900 | |
| CR | 0 | 0.0700 | 0.0700 | 0.8200 | |
| BBSC-XJTC | PEVD | 13.2300 | 14.5100 | 13.9800 | 12.200 |
| PEVD(x) | 0.0300 | 2.1600 | 2.0500 | 2.4800 | |
| VED | 0.0600 | 2.1900 | 2.0800 | 2.5100 | |
| CD | 0.6200 | 0.6000 | 0.5900 | 0.5900 | |
| r | 0 | 0.0100 | 0.0100 | 0.4800 | |
| CR | 0 | 0.0400 | 0.0400 | 0.8200 | |
新窗口打开|下载CSV
图1
 新窗口打开|下载原图ZIP|生成PPT
图13家核心场芯片数据主成分分析结果
PC1、PC2分别为第一和第二主成分,BBSC、BJLM、XJTC分别代表北京六马、养猪中心及新疆天康3家国家生猪核心育种场。
Fig. 1Principal component analysis of three pig breeding farms
2.2 世代对群体关联影响
表1中模拟数据结果表明两个亚群经过多个世代分离后,系谱上很难建立群体间遗传联系,但基因组信息仍能捕获到群体间联系。随着世代增加,两个亚群遗传结构差异会越来越大,群体间遗传关联也会减弱。如表3所示,随着世代增加,所有群体关联估计方法基于G阵结果均显示群体间遗传关联程度不断降低。PEVD、PEVD(x)和VED估计育种值预测误差,从第5世代到第7世代,两个亚群PEVD、PEVD(x)和VED逐渐增大,说明预测误差变大。r和CR则从5世代的0.0008和0.0031逐渐下降至第7世代的0,说明随着群体不断分化,两个群体之间的遗传距离越来越远。与其他方法不同,CD变化幅度较小,仅从第5世代的0.6896减小到第7世代的0.6616。表3不同世代基于G阵的遗传关联变化情况
Table 3
Table 3The changes of genetic connectedness based on G matrix in different generations of simulated data
| 方法 | 世代 | ||
|---|---|---|---|
| 5 | 6 | 7 | |
| PEVD | 1.3218 | 1.4136 | 1.5150 |
| PEVD(x) | 0.3248 | 0.4380 | 0.5835 |
| VED | 0.3279 | 0.4412 | 0.5866 |
| CD | 0.6896 | 0.6733 | 0.6616 |
| r | 0.0008 | 0.0001 | 0 |
| CR | 0.0031 | 0.0002 | 0 |
新窗口打开|下载CSV
2.3遗传力对遗传关联统计量的影响
本研究采用模拟数据中第5世代数据,通过设置不同的遗传力大小(0.1、0.3、0.5和0.7),研究遗传力大小对遗传关联统计量的影响。如表4所示。随着性状遗传力从0.1增加到0.7,除了PEVD(x)方法基于A阵不同遗传力下群体关联值保持为0.0003不变之外,使用不同关系矩阵A、G、和H计算PEVD、PEVD(x)和VED均不断降低。CD基于不同关系矩阵的值也是随着遗传力变大而变大,r和CR基于A阵的值在不同遗传力水平下为0,它们基于G阵随遗传力变大而变大,但CR基于G阵变化幅度较小。从表4也可以看出,当遗传力为0.3~0.7时,在相同遗传力水平下,PEVD基于G阵优于A阵,H阵介于两者之间;对低遗传力0.1,A阵最优,G阵最差。CD也呈现与PEVD相同的现象。PEVD(x)、VED则是所有遗传力水平下,基于G阵的值最大,分别在0.22~0.4和0.22~0.42之间变动,远远大于基于A阵和H阵的0.0003~0.0095和0.0006~0.0063和0.001~0.012。表4虽然说明随着遗传力变大,PEVD、PEVD(x)和VED减小,CD、r、CR变大,但不意味着群体关联增强。
表4不同遗传力水平下各群体关联估计方法基于关系矩阵A、G和H结果汇总
Table 4
Table 4Summary of genetic connectedness obtained by different approaches based on relationship matrices A, G and H under different levels of heritability
| 方法 | 关系矩阵 | 遗传力(h2) | |||
|---|---|---|---|---|---|
| 0.1 | 0.3 | 0.5 | 0.7 | ||
| PEVD | A | 1.8900 | 1.6500 | 1.3300 | 0.9200 |
| G | 2.1900 | 1.3200 | 0.8900 | 0.3600 | |
| H | 1.9000 | 1.3700 | 1.0100 | 0.6500 | |
| PEVD(x) | A | 0.0003 | 0.0003 | 0.0003 | 0.0003 |
| G | 0.4000 | 0.3200 | 0.2700 | 0.2200 | |
| H | 0.0095 | 0.0016 | 0.0007 | 0.0003 | |
| VED | A | 0.0063 | 0.0019 | 0.0010 | 0.0006 |
| G | 0.4200 | 0.3300 | 0.2700 | 0.2200 | |
| H | 0.0120 | 0.0040 | 0.0020 | 0.0010 | |
| CD | A | 0.5300 | 0.5900 | 0.6700 | 0.7700 |
| G | 0.4900 | 0.6900 | 0.7900 | 0.9200 | |
| H | 0.5200 | 0.6600 | 0.7500 | 0.8400 | |
| r | A | 0 | 0 | 0 | 0 |
| G | 0.0003 | 0.0008 | NaN | NaN | |
| H | 0.0003 | 0.0003 | NaN | NaN | |
| CR | A | 0 | 0 | 0 | 0 |
| G | 0.0020 | 0.0030 | 0.0030 | 0.0100 | |
| H | 0.1500 | 0.0200 | 0.0090 | 0.0050 | |
新窗口打开|下载CSV
表5表示不同遗传力水平下群体内PEVD变化情况,所有关系矩阵群体内PEVD值几乎均随着遗传力的增加而降低。可以看出,群体内PEVD变化趋势与群体间PEVD一致。群体内个体之间的遗传关联程度远高于群体间个体之间,这表明无论个体间有无实质遗传关联,提高遗传力水平对于PEVD均有类似的降低作用。因此,由于高遗传力造成的PEVD的降低,不能说明群体间关联程度有提高。
表5不同遗传力水平下群体内个体关联均值(基于PEVD)
Table 5
Table 5Averaged genetic connectedness (PEVD) within group under different levels of heritability
| 群体 | 关系矩阵 | 遗传力 | |||
|---|---|---|---|---|---|
| 0.1 | 0.3 | 0.5 | 0.7 | ||
| 1 | A | 1.8900 | 1.6500 | 1.3300 | 0.9200 |
| G | 1.7400 | 0.9600 | 0.6300 | 0.0800 | |
| H | 1.8800 | 1.1000 | 0.6900 | 0.3700 | |
| 2 | A | 1.8900 | 1.6500 | 1.3300 | 0.9200 |
| G | 1.8300 | 1.0400 | 0.6000 | 0.2100 | |
| H | 1.8900 | 1.6500 | 1.3300 | 0.9200 | |
新窗口打开|下载CSV
3 讨论
3.1 高密度SNP标记估计群体关联的优势
通过系谱数据估计群体遗传关联程度时,一个常见的问题是系谱不全或存在错误,或者无法从系谱中追溯联系。本研究表明,使用基因组数据能够捕捉系谱中不存在的、由更久远的共同祖先导致的个体间遗传关联。即使根据系谱能够建立群体关联,与基于系谱构建的A矩阵相比,基因组数据可以更加准确地估计个体间亲缘关系[10],提高群体关联估计准确性。本研究模拟数据和实际数据结果都显示,大部分遗传关联估计方法基于高密度SNP标记建立的个体亲缘关系矩阵都优于基于A矩阵。这与Yu等[16]、Zhang等[17]研究结果一致,说明利用SNP标记估计群体关联更有优势。3.2 群体间遗传关联度量方法比较
PEVD(x)和VED方法为PEVD方法的近似估计方法,这两种方法相比于PEVD方法计算简单,但本研究模拟数据和实际数据结果表明,相同条件下PEVD(x)和VED均小于PEVD(表1,表2),PEVD(x)和VED 基于G、Gs、G0.5及H阵结果劣于A阵,基于A阵的PEVD(x)和VED过低,接近于0(表1,表2),说明两个群体个体间育种值预测误差很小,这与实际情况有很大偏离。而且,当遗传力从0.1提高到0.7,PEVD(x)方法基于A阵一直保持为0.0003,但基于G阵却在变小(表4),说明PEVD(x)和VED不是理想的度量群体关联的方法。PEVD及其近似估计方法的一个缺点是取值没有范围,如表1和表2所示,模拟数据与真实数据估计值差异很大,因此难以判断遗传关联程度。另外PEVD容易受到群体大小和结构的影响,例如两个群体基于背膘厚性状计算得到的PEVD为0.8 mm,这个结果对于两个大群体而言可能表示关联程度较差,但是对于两个小群体可能表示关联程度较好[7]。CD、r和CR方法取值范围在0~1之间,可以比较好度量群体关联。但是CD值即使系谱上不存在遗传联系仍然很高,而CR和r为0(表1,表2)。当估计养猪中心和新疆天康群体关联时,CD基于A阵最高(表2),与其他统计量不太一样,表明CD容易高估群体关联程度。统计量r大多数情况下低于CR,但是在实际数据中,不能准确反映群体间的实际群体关联。当用r度量养猪中心、北京六马和新疆天康3个群体间遗传关联时,基于G阵的r值均为0.1,区分不出群体的分化远近。而养猪中心-北京六马、北京六马-新疆天康、养猪中心-新疆天康基于G阵的CR分别为0.15、0.07、0.04,能很好说明群体之间的遗传关联情况。越来越多研究表明,CR可以作为衡量群体关联程度的稳定方法[21],MATHUR等[22]利用加拿大育种数据进行分析,结果显示场间平均遗传关联CR大于等于0.03时开展联合遗传评估效果较好。这表明虽然通过系谱无法开展3个核心场间的联合遗传评估,但是可以开展基于基因组信息的基因组联合评估,如北京地区的大白猪基因组联合育种[23]。而且与PEVD相比,CR不需要进行个体间两两匹配求均值,计算简单,并且可以同时估计多个群体之间的遗传关联程度。
3.3 基于SNP标记关系矩阵比较
基于SNP标记构建的个体关系矩阵可以更真实反映个体间亲缘关系,但是要求每个标记的等位基因频率为基础群体的,这个不易获得,所以通常用当前群体的等位基因频率代替。因此除了经典的G阵,还有其他方法来解决等位基因频率问题,如Gs和G0.5。本研究表明,基于G阵与Gs阵的各种遗传关联估计方法结果比较接近,G0.5过于高估群体间遗传关联。当用CR度量模拟数据两个亚群和实际数据3个核心场间遗传关联时,基于A阵的群体关联都为0,说明群体间联系很弱,基于G阵与Gs的模拟数据亚群分别为0.0031和0.0035,但基于G0.5则高达0.91;3个核心场间基于G阵与Gs均为0.15、0.07和0.04,而基于G0.5则为0.94、0.82和0.82。G0.5阵假定所有标记的最小等位基因频率均为0.5,此假设过于理想,既无法反映基础群体的情况,也无法反映当前群体的真实情况,从而导致遗传关联结果出现较大偏差。因此,G0.5阵不适合用于评估群体遗传关联。本研究中H阵结果一般介于A阵和G阵之间,这与Yu等研究结果相同[16]。H阵由A阵和G阵混合而成,因此使用H阵估计遗传关联结果一般优于仅使用系谱数据结果,而当大部分个体均有基因组数据时,H阵遗传关联结果提升幅度可能低于G阵。
3.4 遗传力影响
本研究设定了高、中、低4种遗传力水平检验其对群体关联估计方法影响。大多数情况下,群体关联统计量会随着遗传力升高而改善,但就像群体内个体遗传关联也呈现相同变化一样(表5),不能说明群体间关联程度有提高。遗传力升高会提高育种值估计准确性,降低了育种值预测误差,因而改善了相应的群体关联统计量。因此,在育种实践中,遗传力不同的性状估计的遗传关联结果之间缺乏可比性。另外,本研究发现,低遗传力(0.1)情况下,基于A阵的PEVD优于G阵,与大多数情况下G阵优于A阵相反,说明低遗传力性状不太适合用来估计群体遗传关联。参考文献 原文顺序
文献年度倒序
文中引用次数倒序
被引期刊影响因子
[本文引用: 1]
[本文引用: 1]
[本文引用: 1]
[本文引用: 1]
[本文引用: 1]
[本文引用: 4]
[本文引用: 5]
[本文引用: 2]
[本文引用: 3]
[本文引用: 1]
[本文引用: 1]
URLPMID:18076471 [本文引用: 1]
DOI:10.1111/j.1439-0388.2007.00693.xURLPMID:18076474 [本文引用: 2]

Traditional selection methods, such as sib and best linear unbiased prediction (BLUP) selection, which increased genetic gain by increasing accuracy of evaluation have also led to an increased rate of inbreeding per generation (DeltaFG). This is not necessarily the case with genome-wide selection, which also increases genetic gain by increasing accuracy. This paper explains why genome-wide selection reduces DeltaFG when compared with sib and BLUP selection. Genome-wide selection achieves high accuracies of estimated breeding values through better prediction of the Mendelian sampling term component of breeding values. This increases differentiation between sibs and reduces coselection of sibs and DeltaFG. The high accuracy of genome-wide selection is expected to reduce the between family variance and reweigh the emphasis of estimated breeding values of individuals towards the Mendelian sampling term. Moreover, estimation induced intraclass correlations of sibs are expected to be lower in genome-wide selection leading to a further decrease of coselection of sibs when compared with BLUP. Genome-wide prediction of breeding values, therefore, enables increased genetic gain while at the same time reducing DeltaFG when compared with sib and BLUP selection.
DOI:10.1534/genetics.107.080838URLPMID:18202394 [本文引用: 1]
Genomic selection uses total breeding values for juvenile animals, predicted from a large number of estimated marker haplotype effects across the whole genome. In this study the accuracy of predicting breeding values is compared for four different models including a large number of markers, at different marker densities for traits with heritabilities of 50 and 10%. The models estimated the effect of (1) each single-marker allele [single-nucleotide polymorphism (SNP)1], (2) haplotypes constructed from two adjacent marker alleles (SNP2), and (3) haplotypes constructed from 2 or 10 markers, including the covariance between haplotypes by combining linkage disequilibrium and linkage analysis (HAP_IBD2 and HAP_IBD10). Between 119 and 2343 polymorphic SNPs were simulated on a 3-M genome. For the trait with a heritability of 10%, the differences between models were small and none of them yielded the highest accuracies across all marker densities. For the trait with a heritability of 50%, the HAP_IBD10 model yielded the highest accuracies of estimated total breeding values for juvenile and phenotyped animals at all marker densities. It was concluded that genomic selection is considerably more accurate than traditional selection, especially for a low-heritability trait.
[本文引用: 1]
DOI:10.1016/j.ajhg.2009.01.005URLPMID:19200528 [本文引用: 1]
We present methods for imputing data for ungenotyped markers and for inferring haplotype phase in large data sets of unrelated individuals and parent-offspring trios. Our methods make use of known haplotype phase when it is available, and our methods are computationally efficient so that the full information in large reference panels with thousands of individuals is utilized. We demonstrate that substantial gains in imputation accuracy accrue with increasingly large reference panel sizes, particularly when imputing low-frequency variants, and that unphased reference panels can provide highly accurate genotype imputation. We place our methodology in a unified framework that enables the simultaneous use of unphased and phased data from trios and unrelated individuals in a single analysis. For unrelated individuals, our imputation methods produce well-calibrated posterior genotype probabilities and highly accurate allele-frequency estimates. For trios, our haplotype-inference method is four orders of magnitude faster than the gold-standard PHASE program and has excellent accuracy. Our methods enable genotype imputation to be performed with unphased trio or unrelated reference panels, thus accounting for haplotype-phase uncertainty in the reference panel. We present a useful measure of imputation accuracy, allelic R(2), and show that this measure can be estimated accurately from posterior genotype probabilities. Our methods are implemented in version 3.0 of the BEAGLE software package.
DOI:10.3168/jds.2007-0980URLPMID:18946147 [本文引用: 1]
Efficient methods for processing genomic data were developed to increase reliability of estimated breeding values and to estimate thousands of marker effects simultaneously. Algorithms were derived and computer programs tested with simulated data for 2,967 bulls and 50,000 markers distributed randomly across 30 chromosomes. Estimation of genomic inbreeding coefficients required accurate estimates of allele frequencies in the base population. Linear model predictions of breeding values were computed by 3 equivalent methods: 1) iteration for individual allele effects followed by summation across loci to obtain estimated breeding values, 2) selection index including a genomic relationship matrix, and 3) mixed model equations including the inverse of genomic relationships. A blend of first- and second-order Jacobi iteration using 2 separate relaxation factors converged well for allele frequencies and effects. Reliability of predicted net merit for young bulls was 63% compared with 32% using the traditional relationship matrix. Nonlinear predictions were also computed using iteration on data and nonlinear regression on marker deviations; an additional (about 3%) gain in reliability for young bulls increased average reliability to 66%. Computing times increased linearly with number of genotypes. Estimation of allele frequencies required 2 processor days, and genomic predictions required <1 d per trait, and traits were processed in parallel. Information from genotyping was equivalent to about 20 daughters with phenotypic records. Actual gains may differ because the simulation did not account for linkage disequilibrium in the base population or selection in subsequent generations.
DOI:10.1186/s12711-016-0260-7URLPMID:27788669 [本文引用: 1]
BACKGROUND: The mixed linear model employed for genomic best linear unbiased prediction (GBLUP) includes the breeding value for each animal as a random effect that has a mean of zero and a covariance matrix proportional to the genomic relationship matrix ([Formula: see text]), where the inverse of [Formula: see text] is required to set up the usual mixed model equations (MME). When only some animals have genomic information, genomic predictions can be obtained by an extension known as single-step GBLUP, where the covariance matrix of breeding values is constructed by combining the pedigree-based additive relationship matrix with [Formula: see text]. The inverse of the combined relationship matrix can be obtained efficiently, provided [Formula: see text] can be inverted. In some livestock species, however, the number [Formula: see text] of animals with genomic information exceeds the number of marker covariates used to compute [Formula: see text], and this results in a singular [Formula: see text]. For such a case, an efficient and exact method to obtain GBLUP and single-step GBLUP is presented here. RESULTS: Exact methods are already available to obtain GBLUP when [Formula: see text] is singular, but these require working with large dense matrices. Another approach is to modify [Formula: see text] to make it nonsingular by adding a small value to all its diagonals or regressing it towards the pedigree-based relationship matrix. This, however, results in the inverse of [Formula: see text] being dense and difficult to compute as [Formula: see text] grows. The approach presented here recognizes that the number r of linearly independent genomic breeding values cannot exceed the number of marker covariates, and the mixed linear model used here for genomic prediction only fits these r linearly independent breeding values as random effects. CONCLUSIONS: The exact method presented here was compared to Apy-GBLUP and to Apy single-step GBLUP, both of which are approximate methods that use a modified [Formula: see text] that has a sparse inverse which can be computed efficiently. In a small numerical example, predictions from the exact approach and Apy were almost identical, but the MME from Apy had a condition number about 1000 times larger than that from the exact approach, indicating ill-conditioning of the MME from Apy. The practical application of exact SSGBLUP is not more difficult than implementation of Apy.
[本文引用: 3]
DOI:10.1371/journal.pone.0201400URLPMID:30063724 [本文引用: 2]
The magnitude of connectedness among management units (e.g., flocks and herds) gives a reliable estimate of genetic evaluation across these units. Traditionally, pedigree-based methods have been used to evaluate the genetic connectedness in China. However, these methods have not been able to yield a substantial outcome due to the lack of accuracy and integrity of pedigree data. Therefore, it is necessary to ascertain genetic connectedness using genomic information (i.e., genome-based genetic connectedness). Moreover, the effects of various levels of genome-based genetic connectedness on the accuracy of genomic prediction still remain poorly understood. A simulation study was performed to evaluate the genome-based genetic connectedness across herds by applying prediction error variance of difference (PEVD), coefficient of determination (CD) and prediction error correlation (r). Genomic estimated breeding values (GEBV) were predicted using a GBLUP model from a single and joint reference population. Overall, a continued increase in CD and r with a corresponding decrease in PEVD was observed as the number of common sires varies from 0 to 19 regardless of heritability levels, indicating increasing genetic connectedness between herds. Higher heritability tends to obtain stronger genetic connectedness. Compared to pedigree information, genomic relatedness inferred from genomic information increased the estimates of genetic connectedness across herds. Genomic prediction using the joint versus single reference population increased the accuracy of genomic prediction by 25% and lower heritability benefited more. Moreover, the largest benefits were observed as the number of common sires equals 0, and the gain of accuracy decreased as the number of common sires increased. We confirmed that genome-based genetic connectedness enhanced the estimates of genetic connectedness across management units. Additionally, using the combined reference population substantially increased accuracy of genomic prediction. However, care should be taken when combining reference data for closely related populations, which may give less reliable prediction results.
[本文引用: 1]
[本文引用: 1]
URLPMID:19700729 [本文引用: 2]
[本文引用: 1]
[本文引用: 1]
[本文引用: 1]
[本文引用: 1]
[本文引用: 1]
