卓雯君1,
虞虎2,,,
龙娇1,
刘玉芳3
1.贵州大学经济学院 贵阳 550025
2.中国科学院地理科学与资源研究所 北京 100101
3.重庆文理学院 重庆 402160
基金项目: 中国科学院战略性先导科技专项(A类)XDA23020101
国家自然科学基金项目41801129
详细信息
作者简介:崔海洋, 研究方向为民族学、生态人类学。E-mail: hosanna2004@163.com
通讯作者:虞虎, 研究方向为旅游可持续发展。E-mail: yuhuashd@126.com
中图分类号:F323.22;F224计量
文章访问数:109
HTML全文浏览量:16
PDF下载量:19
被引次数:0
出版历程
收稿日期:2020-11-19
录用日期:2021-02-23
刊出日期:2021-07-01
Calculation of agricultural production efficiency based on a three-stage Data Envelopment Analysis model and analysis of the spatial-temporal characteristics: An example from the Yangtze River Economic Belt
CUI Haiyang1,,ZHUO Wenjun1,
YU Hu2,,,
LONG Jiao1,
LIU Yufang3
1. School of Economics, Guizhou University, Guiyang 550025, China
2. Institute of Geographic Sciences and Natural Resources Research, Chinese Academy of Sciences, Beijing 100101, China
3. Chongqing University of Arts and Sciences, Chongqing 402160, China
Funds: the Strategic Leading Science and Technology Project (Class A) of Chinese Academy of SciencesXDA23020101
the National Natural Science Foundation of China41801129
More Information
Corresponding author:YU Hu, E-mail: yuhuashd@126.com
摘要
HTML全文
图
参考文献
相关文章
施引文献
资源附件
访问统计
摘要
摘要:为响应长江经济带"大保护"的战略号召和完成国家赋予长江经济带各省市的重大历史任务,长江经济带正在推进农业产业结构调整、优化投入产出比例,保障稳定可持续的农业生产。本文基于三阶段DEA模型和聚类分析相结合的方法,以2008-2018年的长江经济带为例,测算其农业生产效率并分析时空特征。研究表明,外生环境因素对长江经济带农业生产效率的影响显著,存在明显的时空差异。其中:1)剔除环境因素后,长江经济带农业生产效率整体向好,四川省和江苏省处于效率前沿面,上海市的农业生产效率值出现明显下降;2)长江经济带农业生产效率逐年波动发展,长江中游地区相对上游和下游地区的农业生产效率更具优势,个别省份的农业生产效率水平与其经济社会发展程度不匹配;3)劳动力、土地、灌溉等投入要素的增加均会引起农业生产效率的增加,财政投入力度及人均GDP与农业生产效率之间不存在明显的正向相关关系,受灾面积对农业生产效率有显著负面影响。
关键词:农业生产效率/
三阶段DEA/
时空特征/
长江经济带
Abstract:In response to the strategic call for the "Great Protection" of the Yangtze River Economic Belt and to fulfill the important historical tasks assigned by the state to the provinces and cities of the area, the Yangtze River Economic Belt is adjusting the agricultural industry structure, optimizing the input-output ratio, and ensuring stable and sustainable agricultural production. Based on the combination of the three-stage Data Envelopment Analysis (DEA) model and cluster analysis, this study examined the Yangtze River Economic Belt from 2008 to 2018 to measure its agricultural production efficiency and to analyze its temporal and spatial characteristics. Studies shown that exogenous environmental factors significantly (P < 5%) impact agricultural production efficiency in the Yangtze River Economic Zone, and there were temporal and spatial differences. These include: 1) after excluding environmental factors, the overall agricultural production efficiency of the Yangtze River Economic Zone had improved. Sichuan and Jiangsu Provinces were at the forefront of efficiency, whereas the agricultural production efficiency of Shanghai had obviously declined. 2) The agricultural production efficiency of the Yangtze River Economic Belt varied year by year, with fluctuating development. The middle reaches of the Yangtze River had advanced agricultural production efficiency more than the upstream and downstream regions, and the agricultural production efficiency of the individual provinces did not match their economic and social development. 3) Increases in labor, land, irrigation, and other input factors increased agriculture production efficiency, there was no correlation between fiscal investment per capita gross domestic product (GDP) and agricultural production efficiency. The disaster-affected area had a significant negative impact on agricultural production efficiency.
Key words:Agricultural production efficiency/
Three-stage Date Envelopment Analysis/
Temporal and spatial characteristics/
Yangtze River Economic Belt
HTML全文

图1长江经济带农业生产总值及其占全国比重
Figure1.Gross agricultural production value of the Yangtze River Economic Zone and its national proportion
 下载: 全尺寸图片幻灯片
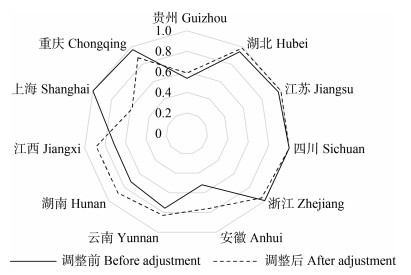
图2长江经济带各省(市)调整前与调整后的农业生产效率
Figure2.Agricultural production efficiencies of provinces (cities) of the Yangtze River Economic Belt before and after adjustment
下载: 全尺寸图片幻灯片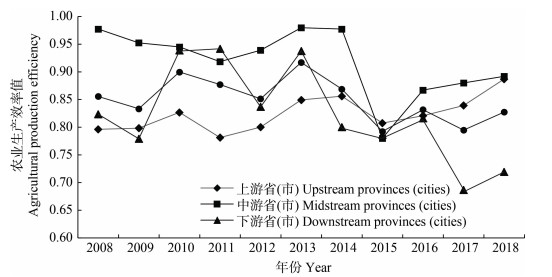
图32008 — 2 01 8年长江经济带上中下游省市农业生产效率均值趋势
Figure3.Trends of average agricultural production efficiencies in the upper, middle and lower reaches of the Yangtze River Economic Belt from 2008 to 2018
下载: 全尺寸图片幻灯片表1长江经济带农业生产效率相关变量及其统计性描述
Table1.Variables related to agricultural production efficiency in the Yangtze River Economic Belt and their statistical description
| 变量类型 Variable type | 名称 Name | 单位 Unit | 符号 Symbolic | 均值 Mean | 标准差 Standard deviation |
| 产出变量 Output variable | 农业总产值Total agricultural output value | 108 ¥ | OP | 3181.44 | 1864.72 |
| 投入变量 Input variable | 农业机械总动力Total power of agricultural machinery | 104 kW | I1 | 3188.36 | 1728.36 |
| 农用化肥施用量Amount of agricultural fertilizer | 104 t | I2 | 192.14 | 107.74 | |
| 第一产业劳动力Primary industry labor | 104 peoples | I3 | 1116.14 | 562.09 | |
| 农作物播种面积Sown area of crops | 103 hm2 | I4 | 4954.79 | 2780.96 | |
| 有效灌溉面积Effective irrigation area | 103 hm2 | I5 | 2127.21 | 1178.15 | |
| 环境变量 Environment variable | 财政对农业的支持Financial support for agriculture | 108 ¥ | E1 | 474.32 | 251.24 |
| 人均GDP GDP per capita | ¥ | E2 | 46 181.66 | 20 614.85 | |
| 受灾面积Disaster-affected area | 103 hm2 | E3 | 823.50 | 908.06 |
下载: 导出CSV表22008 —2018年长江经济带省市的农业产出与投入的Pearson相关系数检验
Table2.Pearson correlation coefficient test of agricultural output and input in provinces and cities of the Yangtze River Economic Belt from 2008 to 2018
| OP | I1 | I2 | I3 | I4 | I5 | |
| OP | 1.000 | |||||
| I1 | 0.754*** | 1.000 | ||||
| I2 | 0.793** | 0.832*** | 1.000 | |||
| I3 | 0.547*** | 0.663*** | 0.725*** | 1.000 | ||
| I4 | 0.296*** | 0.692*** | 0.639*** | 0.518*** | 1.000 | |
| I5 | 0.809*** | 0.925*** | 0.885*** | 0.592*** | 0.581*** | 1.000 |
| OP、I1-I5为表 1中的投入及产出变量。*和**表示P < 0.05和P < 0.01水平显著相关。OP and I1-I5 are the input and output variables shown in the table 1. * and ** represent significant correlations at P < 0.05 and P < 0.01 levels, respectively. | ||||||
下载: 导出CSV表3一阶段DEA-BCC模型下的2008 —2018年长江经济带的农业生产效率
Table3.Agricultural production efficiencies of provinces (cities) of the Yangtze River Economic Belt Region from 2008 to 2018 based on the one-stage DEA-BCC model
| 省(市) Province (city) | 2008 | 2009 | 2010 | 2011 | 2012 | 2013 | 2014 | 2015 | 2016 | 2017 | 2018 | 均值Mean |
| 安徽Anhui | 0.557 | 0.519 | 0.560 | 0.552 | 0.561 | 0.468 | 0.503 | 0.508 | 0.509 | 0.502 | 0.474 | 0.512 |
| 贵州Guizhou | 0.620 | 0.563 | 0.554 | 0.518 | 0.572 | 0.526 | 0.514 | 0.494 | 0.494 | 0.518 | 0.535 | 0.537 |
| 江西Jiangxi | 0.723 | 0.664 | 0.676 | 0.665 | 0.644 | 0.646 | 0.702 | 0.741 | 0.804 | 0.820 | 0.752 | 0.712 |
| 湖南Hunan | 0.759 | 0.819 | 0.896 | 0.892 | 0.821 | 0.787 | 0.813 | 0.440 | 0.482 | 0.533 | 0.638 | 0.716 |
| 云南Yunnan | 0.706 | 0.747 | 0.703 | 0.620 | 0.754 | 0.829 | 0.822 | 0.792 | 0.723 | 0.717 | 0.914 | 0.757 |
| 湖北Hubei | 0.933 | 0.935 | 0.981 | 0.994 | 0.969 | 0.995 | 1.000 | 0.868 | 0.906 | 0.920 | 0.898 | 0.945 |
| 重庆Chongqing | 0.899 | 0.929 | 0.932 | 0.963 | 0.942 | 1.000 | 1.000 | 1.000 | 1.000 | 1.000 | 1.000 | 0.970 |
| 江苏Jiangsu | 0.869 | 0.869 | 0.964 | 1.000 | 1.000 | 1.000 | 1.000 | 1.000 | 1.000 | 1.000 | 1.000 | 0.973 |
| 浙江Zhejiang | 1.000 | 0.960 | 1.000 | 1.000 | 1.000 | 1.000 | 1.000 | 1.000 | 1.000 | 1.000 | 1.000 | 0.996 |
| 四川Sichuan | 1.000 | 1.000 | 1.000 | 1.000 | 1.000 | 1.000 | 1.000 | 1.000 | 1.000 | 1.000 | 1.000 | 1.000 |
| 上海Shanghai | 1.000 | 1.000 | 1.000 | 1.000 | 1.000 | 1.000 | 1.000 | 1.000 | 1.000 | 1.000 | 1.000 | 1.000 |
下载: 导出CSV表4长江经济带的农业生产效率二阶段似SFA前沿回归调整结果
Table4.SFA forward regression adjustment results in two-stage of agricultural production efficiency in the Yangtze River Economic Belt
| 环境变量Environment variable | 松弛变量Slack variable | ||||
| I1 | I2 | I3 | I4 | I5 | |
| E1 | –0.171 | –0.001 | 0.034** | –0.133 | –0.013 |
| E2 | 0.001** | 0.001* | 0.000 | 0.214* | 0.000 |
| E3 | 0.0561 | 0.008 | –0.0084** | –0.0046** | 0.0474 |
| C | –163.570* | –8.870*** | 25.910** | –195.410** | –92.770* |
| LR test | 72.45 | 45.45 | 42.89 | 85.35 | 83.96 |
| Prob > chi | 0.00 | 0.00 | 0.00 | 0.00 | 0.00 |
| log likelihood | –998.98 | –611.87 | –851.67 | –1088.88 | –929.67 |
| E1-E3、I1-I5见表 1中的环境变量和投入变量。*、**和***表示P < 0.1、P < 0.05和P < 0.01水平显著相关。E1-E3 and I1-I5 are the environmental and output variables shown in the table 1. *, ** and *** represent significant correlations at P < 0.1, P < 0.05 and P < 0.01 levels, respectively. | |||||
下载: 导出CSV表52008 —2018年三阶段DEA-BCC调整后长江经济带各省市的农业生产效率值
Table5.Agricultural production efficiencies of provinces (cities) of the Yangtze River Economic Belt from 2008 to 2018 based on the three-stage DEA-BCC model
| 地区Area | 省(市) Province (city) | 2008 | 2009 | 2010 | 2011 | 2012 | 2013 | 2014 | 2015 | 2016 | 2017 | 2018 | 均值Mean |
| 上游 Upstream | 云南Yunnan | 0.734 | 0.802 | 0.759 | 0.632 | 0.826 | 0.858 | 0.926 | 0.908 | 0.876 | 0.830 | 0.965 | 0.829 |
| 四川Sichuan | 1.000 | 1.000 | 1.000 | 1.000 | 1.000 | 1.000 | 1.000 | 1.000 | 1.000 | 1.000 | 1.000 | 1.000 | |
| 贵州Guizhou | 0.646 | 0.535 | 0.724 | 0.679 | 0.571 | 0.643 | 0.634 | 0.444 | 0.502 | 0.527 | 0.583 | 0.590 | |
| 重庆Chongqing | 0.805 | 0.856 | 0.824 | 0.814 | 0.804 | 0.896 | 0.864 | 0.878 | 0.905 | 1.000 | 1.000 | 0.877 | |
| 中游 Midstream | 湖北Hubei | 0.989 | 0.988 | 0.979 | 0.949 | 0.981 | 1.000 | 1.000 | 0.972 | 1.000 | 1.000 | 1.000 | 0.987 |
| 湖南Hunan | 0.961 | 0.997 | 1.000 | 0.999 | 1.000 | 0.996 | 0.970 | 0.572 | 0.650 | 0.797 | 0.766 | 0.883 | |
| 江西Jiangxi | 0.982 | 0.872 | 0.856 | 0.807 | 0.836 | 0.943 | 0.962 | 0.796 | 0.951 | 0.843 | 0.910 | 0.887 | |
| 下游 Downstream | 江苏Jiangsu | 1.000 | 1.000 | 1.000 | 1.000 | 1.000 | 1.000 | 1.000 | 1.000 | 1.000 | 1.000 | 1.000 | 1.000 |
| 安徽Anhui | 0.814 | 0.894 | 0.755 | 0.767 | 0.731 | 0.750 | 0.741 | 0.704 | 0.752 | 0.752 | 0.691 | 0.759 | |
| 浙江Zhejiang | 1.000 | 0.983 | 1.000 | 1.000 | 0.956 | 1.000 | 1.000 | 0.927 | 0.832 | 0.864 | 0.956 | 0.956 | |
| 上海Shanghai | 0.480 | 0.240 | 1.000 | 1.000 | 0.660 | 1.000 | 0.460 | 0.515 | 0.680 | 0.130 | 0.230 | 0.581 |
下载: 导出CSV表6剔除环境变量后长江经济带农业生产效率聚类分析结果比较
Table6.Comparison of cluster analysis results of agricultural production efficiencies in the Yangtze River Economic Belt after excluding environmental variables
| 地区分类Area class | 第1阶段The first stage | 第3阶段The third stage |
| Ⅰ | 四川、上海Sichuan, Shanghai | 四川、江苏Sichuan, Jiangsu |
| Ⅱ | 湖北、重庆、江苏、浙江Hubei, Chongqing, Jiangsu, Zhejiang | 重庆、湖南、江西、浙江、湖北Chongqing, Hunan, Jiangxi, Zhejiang, Hubei |
| Ⅲ | 云南、江西、湖南Yunnan, Jiangxi, Hunan | 云南、安徽Yunnan, Anhui |
| Ⅳ | 安徽、贵州Anhui, Guizhou | 贵州、上海Guizhou, Shanghai |
下载: 导出CSV参考文献
| [1] | 秦清芝, 杨雪英. 挖掘乡村综合价值促进城乡融合发展[J]. 人民论坛, 2019, (34): 76-77 doi: 10.3969/j.issn.1004-3381.2019.34.023 QIN Q Z, YANG X Y. Exploring the comprehensive value of rural areas to promote the integrated development of urban and rural areas[J]. People's Tribune, 2019, (34): 76-77 doi: 10.3969/j.issn.1004-3381.2019.34.023 |
| [2] | 李裕瑞, 杨乾龙, 曹智. 长江经济带农业发展的现状特征与模式转型[J]. 地理科学进展, 2015, 34(11): 1458-1469 https://www.cnki.com.cn/Article/CJFDTOTAL-DLKJ201511014.htm LI Y R, YANG Q L, CAO Z. Current status and pattern transformation of agricultural development in the Yangtze River Economic Belt[J]. Progress in Geography, 2015, 34(11): 1458-1469 https://www.cnki.com.cn/Article/CJFDTOTAL-DLKJ201511014.htm |
| [3] | 华德亚, 汤龙. 产业结构与就业结构协调性及地区趋同研究[J]. 统计与决策, 2019, 35(9): 145-149 https://www.cnki.com.cn/Article/CJFDTOTAL-TJJC201909035.htm HUA D Y, TANG L. Research on the coordination of industrial structure and employment structure and regional convergence[J]. Statistics & Decision, 2019, 35(9): 145-149 https://www.cnki.com.cn/Article/CJFDTOTAL-TJJC201909035.htm |
| [4] | FARRELL M J. The measurement of productive efficiency[J]. Journal of the Royal Statistical Society Series A: General, 1957, 120(3): 253 doi: 10.2307/2343100 |
| [5] | MOLL P. The intercountry agricultural production function and productivity differences among countries: Comment[J]. Journal of Development Economics, 1988, 28(1): 121-124 doi: 10.1016/0304-3878(88)90018-1 |
| [6] | RUTTAN V W. Productivity growth in world agriculture: sources and constraints[J]. Journal of Economic Perspectives, 2002, 16(4): 161-184 doi: 10.1257/089533002320951028 |
| [7] | CHEN S E, BHAGOWALIA P, SHIVELY G. Input choices in agriculture: Is there a gender bias?[J]. World Development, 2011, 39(4): 561-568 doi: 10.1016/j.worlddev.2010.09.012 |
| [8] | 赵蕾, 王怀明. 中国农业生产率的增长及收敛性分析[J]. 农业技术经济, 2007, (2): 93-98 doi: 10.3969/j.issn.1000-6370.2007.02.016 ZHAO L, WANG H M. Analysis on the growth and convergence of China's agricultural productivity[J]. Journal of Agrotechnical Economics, 2007, (2): 93-98 doi: 10.3969/j.issn.1000-6370.2007.02.016 |
| [9] | 熊崇俊. 中国农业生产效率评价研究[J]. 农业经济, 2008, (11): 3-5 doi: 10.3969/j.issn.1001-6139.2008.11.001 XIONG C J. Research on China's agricultural production efficiency evaluation[J]. Agricultural Economy, 2008, (11): 3-5 doi: 10.3969/j.issn.1001-6139.2008.11.001 |
| [10] | 高强, 丁慧媛, 李宪宝. 沿海地区农业生产效率及变动趋势研究[J]. 财经问题研究, 2011, (12): 10-15 doi: 10.3969/j.issn.1000-176X.2011.12.002 GAO Q, DING H Y, LI X B. Research on agricultural production efficiency and its changing trend in coastal areas[J]. Research on Financial and Economic Issues, 2011, (12): 10-15 doi: 10.3969/j.issn.1000-176X.2011.12.002 |
| [11] | 任世鑫, 谢志祥, 杨洋, 等. 基于超效率DEA的中原经济区农业生产效率研究[J]. 华中师范大学学报: 自然科学版, 2016, 50(2): 282-287 doi: 10.3969/j.issn.1000-1190.2016.02.021 REN S X, XIE Z X, YANG Y, et al. Study on agricultural production efficiency based on super-efficiency DEA model in Central Plains Economic Region[J]. Journal of Central China Normal University: Natural Sciences, 2016, 50(2): 282-287 doi: 10.3969/j.issn.1000-1190.2016.02.021 |
| [12] | 焦源. 山东省农业生产效率评价研究[J]. 中国人口·资源与环境, 2013, 23(12): 105-110 doi: 10.3969/j.issn.1002-2104.2013.12.016 JIAO Y. Evaluation research of agricultural production efficiency in Shandong Province[J]. China Population, Resources and Environment, 2013, 23(12): 105-110 doi: 10.3969/j.issn.1002-2104.2013.12.016 |
| [13] | 郭军华, 倪明, 李帮义. 基于三阶段DEA模型的农业生产效率研究[J]. 数量经济技术经济研究, 2010, 27(12): 27-38 https://www.cnki.com.cn/Article/CJFDTOTAL-SLJY201012003.htm GUO J H, NI M, LI B Y. Research on agricultural production efficiency based on three-stage DEA model[J]. The Journal of Quantitative & Technical Economics, 2010, 27(12): 27-38 https://www.cnki.com.cn/Article/CJFDTOTAL-SLJY201012003.htm |
| [14] | 陈鸣, 邓荣荣. 农业R&D投入与农业全要素生产率——一个空间溢出视角的解释与证据[J]. 江西财经大学学报, 2020, (2): 86-97 CHEN M, DENG R R. Agricultural R & D input and agricultural total factor productivity: an explanation and evidence from the perspective of spatial spillover[J]. Journal of Jiangxi University of Finance and Economics, 2020, (2): 86-97 |
| [15] | FRIED H O, LOVELL C A K, SCHMIDT S S, et al. Accounting for environmental effects and statistical noise in data envelopment analysis[J]. Journal of Productivity Analysis, 2002, 17(1/2): 157-174 |
| [16] | 叶文忠, 刘俞希. 长江经济带农业生产效率及其影响因素研究[J]. 华东经济管理, 2018, 32(3): 83-88 https://www.cnki.com.cn/Article/CJFDTOTAL-HDJJ201803012.htm YE W Z, LIU Y X. Agricultural productivity and influential factors in the Yangtze River economic belt[J]. East China Economic Management, 2018, 32(3): 83-88 https://www.cnki.com.cn/Article/CJFDTOTAL-HDJJ201803012.htm |
| [17] | 王振, 周海旺, 王晓娟. 长江经济带发展报告(2017-2018)[M]. 北京: 社会科学文献出版社, 2018 WANG Z, ZHOU H W, WANG X J. Report on the Development of the Yangtze River Economic Belt: 2017-2018[M]. Beijing: Social Sciences Literature Publishing House, 2008 |
| [18] | 吴传清. 黄金水道——长江经济带[M]. 重庆: 重庆大学出版社, 2019 WU C Q. Golden Waterway-Yangtze River Economic Belt[M]. Chongqing: Chongqing University Press, 2008 |
| [19] | 陈卫平. 中国农业生产率增长、技术进步与效率变化: 1990-2003年[J]. 中国农村观察, 2006, (1): 18-23 https://www.cnki.com.cn/Article/CJFDTOTAL-ZNCG200601002.htm CHEN W P. Productivity growth, technical progress and efficiency change in Chinese agriculture: 1990-2003[J]. China Rural Survey, 2006, (1): 18-23 https://www.cnki.com.cn/Article/CJFDTOTAL-ZNCG200601002.htm |
| [20] | 李谷成. 技术效率、技术进步与中国农业生产率增长[J]. 经济评论, 2009, (1): 60-68 https://www.cnki.com.cn/Article/CJFDTOTAL-JJPL200901011.htm LI G C. Technical efficiency, technological progress and China's agricultural productivity growth[J]. Economic Review, 2009, (1): 60-68 https://www.cnki.com.cn/Article/CJFDTOTAL-JJPL200901011.htm |
| [21] | 周锦, 赵正玉. 乡村振兴战略背景下的文化建设路径研究[J]. 农村经济, 2018, (9): 9-15 https://www.cnki.com.cn/Article/CJFDTOTAL-NCJJ201809003.htm ZHOU J, ZHAO Z Y. Research on the path of cultural construction under the background of rural revitalization strategy[J]. Rural Economy, 2018, (9): 9-15 https://www.cnki.com.cn/Article/CJFDTOTAL-NCJJ201809003.htm |
| [22] | 宫少颖, 汤进华, 吴永兴. 上海市农业产业结构及竞争力的区域差异分析[J]. 上海农业学报, 2012, 28(4): 110-114 https://www.cnki.com.cn/Article/CJFDTOTAL-SHLB201204040.htm GONG S Y, TANG J H, WU Y X. Analysis on the regional differences in Shanghai agricultural structure and competitiveness[J]. Acta Agriculturae Shanghai, 2012, 28(4): 110-114 https://www.cnki.com.cn/Article/CJFDTOTAL-SHLB201204040.htm |
| [23] | 张凡凡, 张启楠, 李福夺, 等. 基于三阶段DEA-Windows的主产区粮食生产效率评价[J]. 中国农业资源与区划, 2019, 40(5): 158-165 https://www.cnki.com.cn/Article/CJFDTOTAL-ZGNZ201905022.htm ZHANG F F, ZHANG Q N, LI F D, et al. Evaluation of grain production efficiency in the main production area based on the three stage DEA-Windows[J]. Chinese Journal of Agricultural Resources and Regional Planning, 2019, 40(5): 158-165 https://www.cnki.com.cn/Article/CJFDTOTAL-ZGNZ201905022.htm |
| [24] | 胡海, 庄天慧. 共生理论视域下农村产业融合发展: 共生机制、现实困境与推进策略[J]. 农业经济问题, 2020, 41(8): 68-76 https://www.cnki.com.cn/Article/CJFDTOTAL-NJWT202008007.htm HU H, ZHUANG T H. On the integration development of rural industry from the perspective of symbiosis theory: symbiosis mechanism practical dilemma and promotion strategy[J]. Issues in Agricultural Economy, 2020, 41(8): 68-76 https://www.cnki.com.cn/Article/CJFDTOTAL-NJWT202008007.htm |
| [25] | 程翠云, 任景明, 王如松. 我国农业生态效率的时空差异[J]. 生态学报, 2014, 34(1): 142-148 https://www.cnki.com.cn/Article/CJFDTOTAL-STXB201401018.htm CHENG C Y, REN J M, WANG R S. Spatial-temporal distribution of agricultural eco-efficiency in China[J]. Acta Ecologica Sinica, 2014, 34(1): 142-148 https://www.cnki.com.cn/Article/CJFDTOTAL-STXB201401018.htm |
