沈智扬2,
林国华1,,
1.福建省农业科学院农业经济与科技信息研究所 福州 350003
2.中国进出口银行 北京 100031
基金项目: 2016年度中国科学院学部咨询评议项目和福建省属公益类科研院所基本科研专项2015R1016-8
详细信息
作者简介:许标文, 主要研究方向为农业可持续发展。E-mail:13596447@qq.com
通讯作者:林国华, 主要研究方向为生态农业。E-mail:linguohua@163.com
中图分类号:X322;F326.3;F224计量
文章访问数:719
HTML全文浏览量:8
PDF下载量:934
被引次数:0
出版历程
收稿日期:2018-10-13
录用日期:2018-11-19
刊出日期:2019-04-01
Evolution of green total factor productivity and regional disparity in China's husbandry
XU Biaowen1,,SHEN Zhiyang2,
LIN Guohua1,,
1. Institute of Agricultural Economy and Science Information, Fujian Academy of Agricultural Sciences, Fuzhou 350003, China
2. Export-Import Bank of China, Beijing 100031, China
Funds: the Annual Consulting and Evaluation Project of Academic Divisions of the Chinese Academy of Sciences in 2016 and the Public Welfare Foundation of Fujian Province2015R1016-8
More Information
Corresponding author:E-mail:inguohua@163.com
摘要
HTML全文
图
参考文献
相关文章
施引文献
资源附件
访问统计
摘要
摘要:绿色全要素生产率(TFP)是衡量经济发展方式转变的重要指标,畜牧业高质量发展提升绿色TFP尤为关键。现有文献在测算省域绿色要素生产率时忽视了各省份之间的异质性,生产率指数基于以自身为参照的距离函数,导致结果不能相互比较,无法为决策者提供准确的政策建议。本文提出了一种可以测算各省份经济增长和环境改善对提升全国绿色TFP贡献率的新方法,主要基于稳健型整体方向性距离函数和整体Luenberger绿色生产率指标,将中国整体作为统一的方向衡量各省份对全国要素生产率的贡献,使得各省份的效率值具有可比性。通过分析中国31个省份2001—2016年畜牧业绿色TFP的增长变化,研究发现:1)从整体上看,样本期我国畜牧业绿色TFP的年均增长率为5.01%,其中经济效率对畜牧业绿色TFP的贡献率达88.83%;技术进步对绿色TFP增长的贡献率高达78.65%。2)从区域上看,我国畜牧业区域发展不平衡,东部和中部地区畜牧业发展快于西部地区。3)我国畜牧业绿色TFP增长存在改进空间,且环境效率改进空间大于经济效率,东部地区经济效率改进空间趋小,畜牧业经济增长与碳排放出现弱脱钩状态;中部地区经济效率与环境效率均有很大的改进空间;西部地区经济效率及碳减排还有一定改进空间。因此,为实现畜牧业高质量发展,畜牧业绿色TFP应加快由依靠增加要素投入向注重环境改善转变,加强绿色科技创新的促进作用;同时要突破城乡及区域要素流动制度障碍,提高人均畜牧产值来推动畜牧业区域平衡发展。
关键词:畜牧业/
整体方向性距离函数/
绿色全要素生产率/
Luenberger生产率指标/
By-production模型
Abstract:Green total factor productivity (TFP) is a key indicator for measuring the transformation mode of economic development. The promotion of green TFP has been particularly important for achieving high-quality development of animal husbandry. Existing literatures on green TFP have ignored inter-regional heterogeneity. The productivity index has been usually measured based on distance functions of evaluated unit (province) own leading to results not inter-comparable among units. consequently failure in providing accurate policy advice for decision makers. This paper proposed a novel approach of allocating the contributions of economic gain and environmental improvement to green TFP growth of every evaluated unit. Based on the concept, the main contribution was based on a robust aggregate directional distance function and aggregate Luenberger productivity indicators. We set a unified direction for all over China to measure green TFP evolution of animal husbandry in 31 provinces for the period 2001-2016. The results showed that:1) generally, the average annual growth rate of green TFP in China's animal husbandry was 5.01%; of which the contribution rate of economic efficiency was 88.83% and that of technological progress as high as 78.65%. 2) There were regional imbalances in the development of animal husbandry industry across provinces, with eastern and central regions having faster growth than western areas. 3) There was potential of improvement in green TFP growth of animal husbandry in China with bigger room for improvement of environment efficiency than economic efficiency. Different directions of the improvement of green TFP growth of animal husbandry existed among the eastern, central and western regions of China. For the eastern regions, economy growth and carbon emission was in weak decoupling with small improvement room of TFP growth. For the central regions, both economic and environment efficiencies had great improvement room. And the western region had certain potential in economic efficiency enhancement and carbon emission reduction. Thus in order to realize high-quality development of animal husbandry, there was need to accelerate the transformation from relying on increasing the input of factors to environmental improvement for increasing green TFP of animal husbandry, and to strengthen the innovation of green science and technology. Also to realize balanced development of animal husbandry, it was necessary to break the police obstacles between urban and rural areas, and among regions, and increase per capita animal husbandry output value.
Key words:Animal husbandry/
Aggregate directional distance function/
Green total factor productivity/
Luenberger productivity indicator/
By-production technology
HTML全文
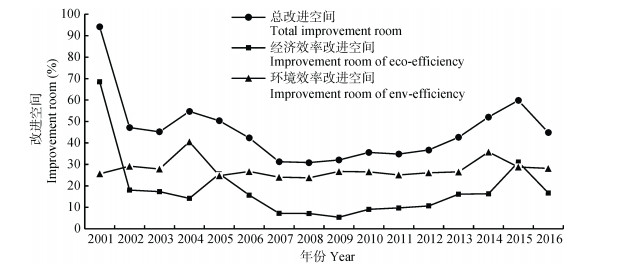
图1全国畜牧业的绿色增长潜力(2001—2016年)
Figure1.Green growth potential of Chinese husbandry (2001-2016)
 下载: 全尺寸图片幻灯片
表1中国主要畜牧品种温室气体排放系数
Table1.Greenhouse gases emission factors of major husbandry breeds in China
| kg?head-1?a-1 | |||
| 种类 Species | 甲烷排放系数 CH4 emission factor | 氧化亚氮排放系数 N2O emission factor | |
| 胃肠发酵 Abdominal fermentation | 排泄物 Excrement | ||
| 奶牛Cow | 68 | 16 | 1.00 |
| 非奶牛Non-dairy cow | 51.4 | 1.5 | 1.37 |
| 羊Sheep | 5 | 0.16 | 0.33 |
| 猪Pig | 1 | 3.5 | 0.53 |
| 家禽Poultry | — | 0.02 | 0.02 |
下载: 导出CSV表2中国畜牧业绿色全要素生产率指标累计值与分解(2001—2016年)
Table2.Cumulative value and decomposition of green total factor productivity in Chinese husbandry (2001-2016)
| 年份 Year | 绿色 全要素生产率 Green total factor productivity | 经济 全要素生产率 Total factor productivity in economic | 环境 全要素生产率 Total factor productivity in environment | 效率变化 (EC) Efficiency change | 经济 效率变化 Efficiency change in economic | 环境 效率变化 Efficiency change in environment | 技术进步 (TP) Technological progress | 经济 技术进步 Technological progress in economic | 环境 技术进步 Technological progress in environment |
| 2001 | 0.000 0 | 0.000 0 | 0.000 0 | 0.000 0 | 0.000 0 | 0.000 0 | 0.000 0 | 0.000 0 | 0.000 0 |
| 2002 | 0.125 5 | 0.134 5 | -0.009 0 | 0.469 5 | 0.505 0 | -0.035 5 | -0.344 1 | -0.370 5 | 0.026 5 |
| 2003 | 0.286 4 | 0.257 1 | 0.029 3 | 0.489 7 | 0.512 1 | -0.022 5 | -0.203 3 | -0.255 0 | 0.051 8 |
| 2004 | 0.378 3 | 0.338 1 | 0.040 2 | 0.394 5 | 0.543 7 | -0.149 2 | -0.016 2 | -0.205 6 | 0.189 4 |
| 2005 | 0.417 9 | 0.386 5 | 0.031 4 | 0.438 0 | 0.429 1 | 0.008 9 | -0.020 1 | -0.042 7 | 0.022 5 |
| 2006 | 0.437 6 | 0.407 3 | 0.030 3 | 0.517 8 | 0.528 6 | -0.010 8 | -0.080 2 | -0.121 2 | 0.041 1 |
| 2007 | 0.586 1 | 0.492 5 | 0.093 6 | 0.628 9 | 0.613 1 | 0.015 9 | -0.042 9 | -0.120 6 | 0.077 7 |
| 2008 | 0.665 4 | 0.568 6 | 0.096 8 | 0.632 9 | 0.614 4 | 0.018 5 | 0.032 5 | -0.045 8 | 0.078 3 |
| 2009 | 0.609 6 | 0.529 9 | 0.079 7 | 0.620 8 | 0.631 6 | -0.010 8 | -0.011 2 | -0.101 7 | 0.090 5 |
| 2010 | 0.648 1 | 0.565 8 | 0.082 3 | 0.585 6 | 0.594 7 | -0.009 1 | 0.062 5 | -0.029 0 | 0.091 5 |
| 2011 | 0.763 5 | 0.653 6 | 0.109 9 | 0.593 4 | 0.588 0 | 0.005 4 | 0.170 1 | 0.065 6 | 0.104 5 |
| 2012 | 0.785 7 | 0.687 7 | 0.098 0 | 0.574 3 | 0.578 7 | -0.004 5 | 0.211 4 | 0.109 0 | 0.102 5 |
| 2013 | 0.780 5 | 0.700 0 | 0.080 5 | 0.515 1 | 0.524 0 | -0.008 9 | 0.265 3 | 0.176 0 | 0.089 4 |
| 2014 | 0.686 7 | 0.699 3 | -0.012 6 | 0.420 7 | 0.522 2 | -0.101 6 | 0.266 0 | 0.177 1 | 0.089 0 |
| 2015 | 0.827 0 | 0.734 2 | 0.092 8 | 0.343 1 | 0.374 4 | -0.031 3 | 0.483 9 | 0.359 9 | 0.124 1 |
| 2016 | 0.838 3 | 0.720 6 | 0.117 7 | 0.493 0 | 0.518 3 | -0.025 3 | 0.345 3 | 0.202 3 | 0.143 0 |
| 年均增长率 Average annual growth rate (%) | 5.01 | 4.45 | 0.56 | 1.07 | 1.08 | -0.01 | 3.94 | 3.37 | 0.57 |
| 贡献率 Contribution rate (%) | 100.00 | 88.83 | 11.17 | 21.35 | 21.49 | -0.14 | 78.65 | 67.34 | 11.31 |
| 数据来源为除台湾省、香港特别行政区和澳门特别行政区外的31个省(市、区); 指标为累计变化值, 初始值2001年设为0。The data are of provinces (cities, regions) of China except Taiwan Province, Hong Kong Special Administrative Region and Macao Special Administrative Region. The value of every indicator is cumulative value, and initial value is set as 0 in 2001. | |||||||||
下载: 导出CSV表3中国区域及省际畜牧业绿色全要素生产率增长趋势分析(2001—2016年)
Table3.Analysis on green total factor productivity growth of regional and provincial husbandry in China (2001-2016)
| % | |||
| 地区 Area | 总趋势 General trend | 经济趋势 Economic trend | 环境趋势 Environment trend |
| 东部East area | 2.18 | 1.87 | 0.31 |
| 北京Beijing | 0.02 | 0.02 | 0.00 |
| 天津Tianjin | 0.05 | 0.05 | 0.00 |
| 河北Hebei | 0.52 | 0.44 | 0.09 |
| 辽宁Liaoning | 0.26 | 0.25 | 0.01 |
| 上海Shanghai | 0.01 | 0.01 | 0.00 |
| 浙江Zhejiang | 0.08 | 0.04 | 0.04 |
| 福建Fujian | 0.11 | 0.10 | 0.01 |
| 山东Shandong | 0.55 | 0.46 | 0.09 |
| 广东Guangdong | 0.20 | 0.18 | 0.02 |
| 海南Hainan | 0.03 | 0.03 | 0.00 |
| 江苏Jiangsu | 0.34 | 0.29 | 0.05 |
| 中部Central area | 1.93 | 1.77 | 0.16 |
| 山西Shanxi | 0.06 | 0.05 | 0.01 |
| 吉林Jilin | 0.18 | 0.13 | 0.05 |
| 黑龙江Heilongjiang | 0.29 | 0.23 | 0.06 |
| 安徽Anhui | 0.24 | 0.20 | 0.04 |
| 江西Jiangxi | 0.08 | 0.25 | -0.17 |
| 河南Henan | 0.47 | 0.38 | 0.09 |
| 湖南Hunan | 0.41 | 0.33 | 0.08 |
| 湖北Hubei | 0.20 | 0.20 | 0.00 |
| 西部West area | 0.90 | 0.81 | 0.09 |
| 四川Sichuan | 0.36 | 0.27 | 0.09 |
| 贵州Guizhou | 0.06 | 0.03 | 0.03 |
| 云南Yunnan | -0.10 | 0.03 | -0.14 |
| 西藏Tibet | -0.02 | -0.02 | 0.00 |
| 陕西Shaanxi | 0.10 | 0.08 | 0.02 |
| 重庆Chongqing | 0.08 | 0.07 | 0.02 |
| 广西Guangxi | 0.13 | 0.10 | 0.03 |
| 甘肃Gansu | 0.01 | 0.01 | 0.00 |
| 青海Qinghai | 0.02 | 0.02 | 0.00 |
| 宁夏Ningxia | 0.02 | 0.02 | 0.00 |
| 新疆Xinjiang | 0.07 | 0.06 | 0.01 |
| 内蒙古Inner Mongolia | 0.17 | 0.14 | 0.03 |
下载: 导出CSV表4中国不同区域和全国畜牧业绿色增长潜力(2001—2016年)
Table4.Green growth potential of husbandry in different regions and the whole county of China (2001-2016)
| % | |||||||||||
| 年份Year | 东部East area | 中部Central area | 西部West area | 全国National | |||||||
| 经济效率 改进空间 Improvement room of economic efficiency | 环境效率 改进空间 Improvement room of environment efficiency | 经济效率 改进空间 Improvement room of economic efficiency | 环境效率 改进空间 Improvement room of environment efficiency | 经济效率 改进空间 Improvement room of economic efficiency | 环境效率 改进空间 Improvement room of environment efficiency | 经济效率 改进空间 Improvement room of economic efficiency | 环境效率 改进空间 Improvement room of environment efficiency | ||||
| 2001 | 26.50 | 5.81 | 32.76 | 9.25 | 9.26 | 10.55 | 68.52 | 25.62 | |||
| 2002 | 7.93 | 6.69 | 5.58 | 11.52 | 4.51 | 10.96 | 18.02 | 29.17 | |||
| 2003 | 5.81 | 6.75 | 7.49 | 10.26 | 4.00 | 10.85 | 17.31 | 27.86 | |||
| 2004 | 5.21 | 12.95 | 5.75 | 14.21 | 3.19 | 13.37 | 14.15 | 40.54 | |||
| 2005 | 10.75 | 6.23 | 9.31 | 8.79 | 5.55 | 9.70 | 25.61 | 24.73 | |||
| 2006 | 6.54 | 7.08 | 5.90 | 9.46 | 3.22 | 10.15 | 15.66 | 26.69 | |||
| 2007 | 2.99 | 5.55 | 3.17 | 8.58 | 1.06 | 9.89 | 7.21 | 24.03 | |||
| 2008 | 2.73 | 5.78 | 3.01 | 8.39 | 1.34 | 9.59 | 7.08 | 23.77 | |||
| 2009 | 1.52 | 6.55 | 2.75 | 9.55 | 1.08 | 10.60 | 5.36 | 26.69 | |||
| 2010 | 2.37 | 6.52 | 4.05 | 9.60 | 2.63 | 10.41 | 9.05 | 26.53 | |||
| 2011 | 2.59 | 6.21 | 4.14 | 9.02 | 2.99 | 9.85 | 9.72 | 25.07 | |||
| 2012 | 2.90 | 6.76 | 4.45 | 9.62 | 3.30 | 9.68 | 10.64 | 26.06 | |||
| 2013 | 3.95 | 6.41 | 6.28 | 8.93 | 5.89 | 11.16 | 16.12 | 26.50 | |||
| 2014 | 3.53 | 3.73 | 6.77 | 15.23 | 5.99 | 16.81 | 16.29 | 35.77 | |||
| 2015 | 4.99 | 8.11 | 14.01 | 10.71 | 12.08 | 9.92 | 31.08 | 28.74 | |||
| 2016 | 5.02 | 7.16 | 6.42 | 10.59 | 5.25 | 10.39 | 16.69 | 28.15 | |||
| 增长潜力由改进空间(无效率值)衡量。Growth potential is measured by improvement space (inefficiency value). | |||||||||||
下载: 导出CSV参考文献
| [1] | 徐晓红, 汪侠.中国绿色全要素生产率及其区域差异——基于30个省面板数据的实证分析[J].贵州财经大学学报, 2016, (6):91-98 doi: 10.3969/j.issn.1003-6636.2016.06.010 XU X H, WANG X. China's green total factor productivity and regional differences-An empirical research based on panel data from 30 provinces[J]. Journal of Guizhou University of Finance and Economics, 2016, (6):91-98 doi: 10.3969/j.issn.1003-6636.2016.06.010 |
| [2] | 胡晓珍, 杨龙.中国区域绿色全要素生产率增长差异及收敛分析[J].财经研究, 2011, 37(4):123-134 http://d.old.wanfangdata.com.cn/Periodical/cjyj201104012 HU X Z, YANG L. Analysis of growth differences and convergence of regional green TFP in China[J]. Journal of Finance and Economics, 2011, 37(4):123-134 http://d.old.wanfangdata.com.cn/Periodical/cjyj201104012 |
| [3] | 韩海彬, 赵丽芬.环境约束下中国农业全要素生产率增长及收敛分析[J].中国人口·资源与环境, 2013, 23(3):70-76 doi: 10.3969/j.issn.1002-2104.2013.03.011 HAN H B, ZHAO L F. Growth and convergence of agricultural total factor productivity in China under environmental regulations[J]. China Population, Resources and Environment, 2013, 23(3):70-76 doi: 10.3969/j.issn.1002-2104.2013.03.011 |
| [4] | 岳立, 王晓君.环境规制视域下我国农业技术效率与全要素生产率分析——基于距离函数研究法[J].吉林大学社会科学学报, 2013, 53(4):85-92 YUE L, WANG X J. An analysis on technical efficiency and total factor productivity of China's agriculture in the perspective of environmental regulations[J]. Jilin University Journal Social Sciences Edition, 2013, 53(4):85-92 |
| [5] | 李谷成, 范丽霞, 闵锐.资源、环境与农业发展的协调性——基于环境规制的省级农业环境效率排名[J].数量经济技术经济研究, 2011, 28(10):21-36 http://d.old.wanfangdata.com.cn/Conference/8518854 LI G C, FAN L X, MIN R. The coordination of agricultural development with environment and resource[J]. The Journal of Quantitative & Technical Economics, 2011, 28(10):21-36 http://d.old.wanfangdata.com.cn/Conference/8518854 |
| [6] | 李谷成.中国农业的绿色生产率革命:1978-2008年[J].经济学, 2014, 13(1):537-558 http://d.old.wanfangdata.com.cn/Periodical/jjx201401006 LI G C. The green productivity revolution of agriculture in China from 1978 to 2008[J]. China Economic Quarterly, 2014, 13(1):537-558 http://d.old.wanfangdata.com.cn/Periodical/jjx201401006 |
| [7] | PASTOR J T, LOVELL C A K. A global Malmquist productivity index[J]. Economics Letters, 2005, 88(2):266-271 doi: 10.1016/j.econlet.2005.02.013 |
| [8] | OH D H. A global Malmquist-Luenberger productivity index[J]. Journal of Productivity Analysis, 2010, 34(3):183-197 doi: 10.1007/s11123-010-0178-y |
| [9] | OH D H, HESHMATI A. A sequential Malmquist-Luenberger productivity index:Environmentally sensitive productivity growth considering the progressive nature of technology[J]. Energy Economics, 2010, 32(6):1345-1355 doi: 10.1016/j.eneco.2010.09.003 |
| [10] | 曹佳, 肖海峰, 杨光. 1978-2007年我国畜牧业全要素生产率及其影响因素研究[J].技术经济, 2009, 28(7):62-66 doi: 10.3969/j.issn.1002-980X.2009.07.013 CAO J, XIAO H F, YANG G. Analysis on total factor productivity of livestock industry in China and its influence factors during 1978-2007[J]. Technology Economics, 2009, 28(7):62-66 doi: 10.3969/j.issn.1002-980X.2009.07.013 |
| [11] | 吴清秀.全要素生产率对区域畜牧业增长的贡献差异分析[J].呼伦贝尔学院学报, 2017, (1):78-85 doi: 10.3969/j.issn.1009-4601.2017.01.019 WU Q X. Contribution of total factor productivity to husbandry growth in different regions[J]. Journal of Hulunbeier University, 2017, (1):78-85 doi: 10.3969/j.issn.1009-4601.2017.01.019 |
| [12] | 邹洁, 项朝阳.中国大陆畜牧业环境效率测算及影响因素研究[J].环境污染与防治, 2016, 38(1):90-96 http://d.old.wanfangdata.com.cn/Periodical/hjwryfz201601016 ZOU J, XIANG C Y. Research on the livestock environmental efficiency in mainland China and its influencing factors[J]. Environmental Pollution and Control, 2016, 38(1):90-96 http://d.old.wanfangdata.com.cn/Periodical/hjwryfz201601016 |
| [13] | 崔姹, 王明利, 石自忠.基于温室气体排放约束下的我国草食畜牧业全要素生产率分析[J].农业技术经济, 2018, (3):66-78 http://epub.cnki.net/grid2008/detail.aspx?filename=NYJS201803006&dbname=DKFX2018 CUI C, WANG M L, SHI Z Z. Effect of greenhouse gas emissions on total factor productivity of herbivorous animal husbandry in China[J]. Journal of Agrotechnical Economics, 2018, (3):66-78 http://epub.cnki.net/grid2008/detail.aspx?filename=NYJS201803006&dbname=DKFX2018 |
| [14] | COELLI T, LAUWERS L, VAN HUYLENBROECK G. Environmental efficiency measurement and the materials balance condition[J]. Journal of Productivity Analysis, 2007, 28(1/2):3-12 |
| [15] | R DSETH K L. Environmental efficiency measurement and the materials balance condition reconsidered[J]. European Journal of Operational Research, 2016, 250(1):342-346 doi: 10.1016/j.ejor.2015.10.061 |
| [16] | MURTY S, RUSSELL R R, LEVKOFF S B. On modeling pollution-generating technologies[J]. Journal of Environmental Economics and Management, 2012, 64(1):117-135 doi: 10.1016/j.jeem.2012.02.005 |
| [17] | KOOPMANS T C. An analysis of production as an efficient combination of activities[M]//KOOPMANS T C. Activity Analysis of Production and Allocation. London:John Wiley and Sons Inc., 1951:33-97 |
| [18] | DEBREU G. The coefficient of resource utilization[J]. Econometrica, 1951, 19(3):273-292 doi: 10.2307/1906814 |
| [19] | SHEPHARD R W. Cost and Production Functions[M]. Princeton, NJ:Princeton University Press, 1953 |
| [20] | FARRELL M J. The measurement of productive efficiency[J]. Journal of the Royal Statistical Society. Series A, 1957, 120(3):253-290 doi: 10.2307/2343100 |
| [21] | SHEN Z Y, BALE?ENTISC T, CHEN X L, et al. Green growth and structural change in Chinese agricultural sector during 1997-2014[J]. China Economic Review, 2018, 51:83-96 doi: 10.1016/j.chieco.2018.04.014 |
| [22] | HACKMAN S T. Production Economics:Integrating the Microeconomic and Engineering Perspectives[M]. Berlin, Heidelberg:Springer, 2008 |
| [23] | BOUSSEMART J P, LELEU H, SHEN Z Y. Environmental growth convergence among Chinese regions[J]. China Economic Review, 2015, 34:1-18 doi: 10.1016/j.chieco.2015.03.003 |
| [24] | CHAMBERS R G, FāURE R, GROSSKOPF S. Productivity growth in APEC countries[J]. Pacific Economic Review, 1996, 1(3):181-190 doi: 10.1111/per.1996.1.issue-3 |
| [25] | ANDERSEN M A, ALSTON J M, PARDEY P G. Capital services in U.S. agriculture:Concepts, comparisons, and the treatment of interest rates[J]. American Journal of Agricultural Economics, 2011, 93(3):718-738 doi: 10.1093/ajae/aar010 |
| [26] | 黄少安, 孙圣民, 宫明波.中国土地产权制度对农业经济增长的影响——对1949-1978年中国大陆农业生产效率的实证分析[J].中国社会科学, 2005, (3):38-47 doi: 10.1007-s11064-010-0207-2/ HUANG S A, SUN S M, GONG M B. The impact of land ownership structure on agricultural economic growth:An empirical analysis on agricultural production efficiency on the Chinese Mainland (1949-1978)[J]. Social Sciences in China, 2005, (3):38-47 doi: 10.1007-s11064-010-0207-2/ |
| [27] | IPCC. IPCC guidelines for national greenhouse gas inventories volume 4: Agriculture, forestry and other land use[R]. Geneva, Switzerland: IPCC, 2006 |
| [28] | STEINFELD H, GERBER P, WASSENAAR T D, et al. Livestock's Long Shadow:Environmental Issues and Options[M]. Rome:FAO, 2006:97-110 |
