孙小霞,
苏时鹏,
福建农林大学可持续发展研究所 福州 350002
基金项目: 教育部人文社科项目15YJCZH153
国家水体污染控制与治理科技重大专项计划2012ZX07601003
福建省软科学项目2018R0010
福建省社科规划重大项目FJ2017Z003
详细信息
作者简介:余文梦, 主要从事资源与环境管理研究。E-mail:876204629@qq.com
通讯作者:苏时鹏, 主要从事资源与环境管理研究。E-mail:sushipeng@tsinghua.org.cn
中图分类号:X713计量
文章访问数:735
HTML全文浏览量:22
PDF下载量:682
被引次数:0
出版历程
收稿日期:2018-07-29
录用日期:2018-09-30
刊出日期:2019-03-01
Temporal and spatial changes in pig manure load in agricultural lands in China
YU Wenmeng,SUN Xiaoxia,
SU Shipeng,
Institute of Sustainable Development, Fujian Agriculture and Forestry University, Fuzhou 350002, China
Funds: the Humanities and Social Sciences Project of the Ministry of Education of China15YJCZH153
the Major Special Project of National Water Pollution Control and Governance Science and Technology of China2012ZX07601003
the Soft Science Project of Fujian Province2018R0010
the Social Science Planning Major Project of Fujian ProvinceFJ2017Z003
More Information
Corresponding author:SU Shipeng, E-mail: sushipeng@tsinghua.org.cn
摘要
HTML全文
图
参考文献
相关文章
施引文献
资源附件
访问统计
摘要
摘要:种养循环是解决农业面源污染,促进化肥减量化以及种植业和养殖业可持续发展的重要途径。测算并合理利用农用地粪便承载力是促进区域种养业循环的基础。为了通过种养业循环解决生猪养殖污染问题,本文运用排放系数法测算2007—2016年中国31个省(市、自治区)农用地猪粪负荷强度和承载潜力,并利用ArcGIS空间统计模型分析其时空格局演变特征,运用多元线性回归模型探讨农用地猪粪负荷强度时空分异的主要影响因素。研究结果表明:1)2007—2016年中国农用地猪粪负荷强度总体上并不高,平均值为4.148 t·hm-2,但省际差异较大。2)负荷强度总体上呈现先增后降特征,其中,青海和西藏呈现持续上升态势,新疆呈现“降-升-升”态势,宁川黔冀4个省域呈现持续降低态势,上海等12个省域呈现“升-升-降”,重庆等6个省市呈“升-降-降”态势,内蒙古等6个省域呈现“降-升-降”态势。负荷强度整体上表现出显著的空间自相关性,自相关性呈现先减弱后增强变动态势。热点区域呈向北部、西部转移趋势。3)城乡收入比、上一年成本利润率、人均猪肉消费量、人口密度、区位、人均农作物面积、河网密度和河流截面水质优良比例等因素对农用地猪粪负荷强度产生了显著影响。其主要通过市场规律、供给-需求关系、环境承载力、养殖规制和政府政策影响负荷强度变化。4)提出根据省域负荷强度热点北移西进的态势以及各地承载潜力,制定生猪养殖业区域规划和负面清单政策,引导种养业在一定区域内实现循环耦合等政策建议。
关键词:农用地/
猪粪/
负荷强度/
面源污染
Abstract:Crop-livestock and poultry farming cycle is an important way of solving agricultural non-point source pollution, promoting chemical fertilizers reduction and enhancing sustainable development of agriculture. Rational utilization of manure in agricultural lands is the basis of regional crop-livestock and poultry farming cycle. In order to control the pollution of breeding pigs through crop and pig farming cycle, we used the emission coefficient method to calculate the load intensity and carrying capacity of pig manure in agricultural lands in 31 provinces (municipalities) in China for the period 2007-2016. The spatial statistical model in ArcGIS was used to analyze temporal and spatial patterns of the evolution of pig manure load intensity in farmlands during the investigated decade. Then the multivariate linear regression model was used to explore the main driving factors of temporal and spatial differences in load intensity of pig manure in farmlands. The results showed that the load intensity of pig manure in China's agricultural lands in 2007-2016 was low, which was 4.148 t·hm-2 averagely with obvious inter-provincial variations. The load intensity generally increased first and decreased then. There were five evolution patterns of pig manure load intensity in farmlands in 31 provinces. They were continuous upward trend in Qinghai and Tibet; down-up-up trend in Xinjiang; continuous downward trend in 4 province of Ningxia, Sichuan, Guizhou and Hebei; up-up-down trend in 12 provinces including Shanghai; up-down-down trend in 6 provinces including Chongqing; and down-up-down trend in 6 provinces including Inner Mongolia. The load intensity of pig manure in farmland showed significant spatial autocorrelation on the whole, which initially decreased and then increased during the decade. The hotpot regions of load intensity of pig manure apparently shifted to the north and west from the east and south. The multivariate linear regression analyses showed that urban-rural income ratio, crop area per capita and proportion of sections with excellent water quality had negative effects, while profit rate in the last year, annual pork consumption per capita, population density, river network density had positive effects on pig manure load intensity in farmland. These factors affected load intensity mainly through market rules, supply-demand relationship, environmental carrying capacity, livestock and poultry farming regulations and government policies. Finally, policy recommendations were put forward based on the results, such as formulating regional plans and negative list policies based on provincial shift of load intensity hotspots and carrying capacity of pig manure in farmlands, establishing cycle-coupling industries of crop farming and livestock/poultry in a certain area.
Key words:Farmland/
Pig manure/
Load intensity/
Non-point source pollution
HTML全文
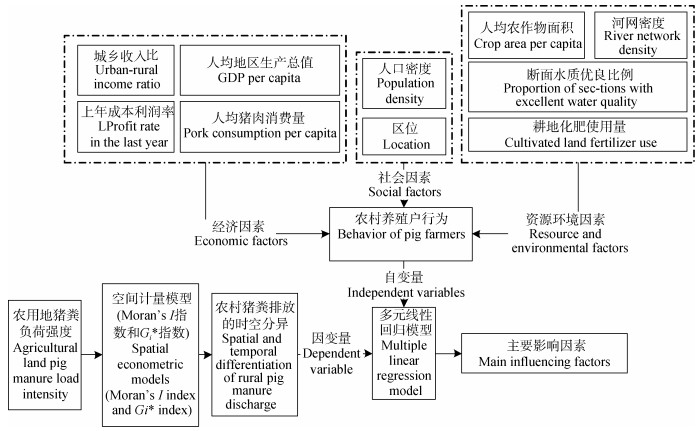
图1农用地猪粪负荷强度时空演变分析框架
Figure1.Analytical framework for spatial and temporal evolution of pig manure load intensity in agricultural land
 下载: 全尺寸图片幻灯片
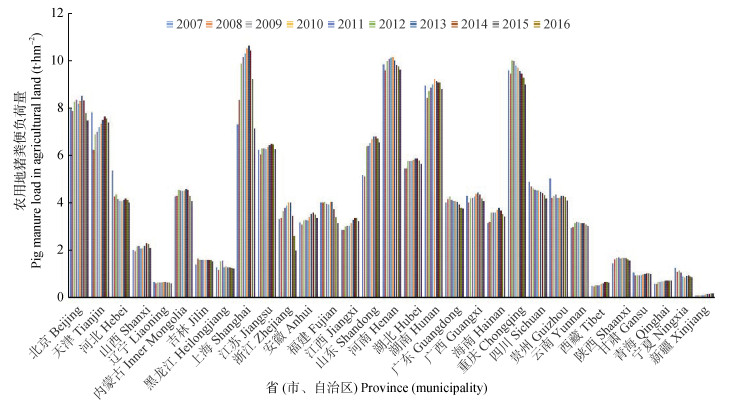
图22007-2016年各省(市、自治区)农用地猪粪负荷强度情况
Figure2.Pig manure load intensities in agricultural land in different provinces (municipalities) of China during 2007-2016
下载: 全尺寸图片幻灯片表1单位猪产品粪便排放系数(e)
Table1.Fecal emission coefficient of unit pig products (e)
| kg·d-1 | |||||||
| 系数值(e) Coefficient value | 5.9 | 10.0 | 5.3 | 4.0 | 5.3 | 5.1 | 5.9 |
| 文献出处 Document source | [7] | [19] | [20] | [21] | [22] | [7] | 本文取均值 Mean value |
下载: 导出CSV表2省域农用地猪粪负荷强度时空演变的变量说明与统计
Table2.Variables and statistics of temporal and spatial changes of pig manure load intensity in agricultural land in provinces of China
| 变量 Variable | 变量解释 Variable interpretation | 均值 Mean | 标准差 Std. dev. | 作用方向预测 Effect prediction | |
| 因变量 Dependent variable | 负荷强度 Load intensity | 各省不同年份单位面积农用地猪粪负荷量 Pig manure load per unit area of agricultural land in different years of each province (t·hm-2) | 4.148 | 2.879 | |
| 自变量 Independent variable | 城乡收入比 Urban-rural income ratio | 城镇居民人均可支配收入/农村居民人均可支配收入 Urban disposable incomes / rural disposable income | 2.936 | 0.563 | - |
| 人均地区生产总值 GDP per capita | 人均地区生产总值 GDP / population ( ·person-1) | 41 171.520 | 22 018.700 | + | |
| 上年利润率 Profit rate in the last year | 上一年生猪养殖利润额/成本×100 Pig farming profit / cost in the last year (%) | 11.940 | 12.914 | + | |
| 年人均猪肉消费量 Annual pork consumption per capita | 猪肉消费量/总人口 Annual pork consumption / total population (kg·person-1) | 14.583 | 7.319 | + | |
| 人口密度 Population density | 总人口/研究区面积 Population / area (persons·km-2) | 438.405 | 657.873 | + | |
| 城镇化率 Urbanization rate | 城镇人口/总人口 Urban population / total population | 52.867 | 14.160 | + | |
| 低保人口率 Rate of lowest living population | 农村低保人口占农村人口比率 Rural subsistence allowance population / rural population | 0.149 | 1.064 | - | |
| 区位 Location | 东部=1, 中部=2, 西部=3 East China = 1, Middle China = 2, West China = 3 | 1.774 | 0.751 | - | |
| 人均农作物面积 Crop area per capita | 农作物播种面积/总人口 Crop planting area / total population (hm2·person-1) | 0.124 | 0.069 | - | |
| 河网密度 River network density | 单位面积内的河流总长度 Total river network length per unit area (km·km-2) | 0.492 | 0.247 | + | |
| 断面水质优良比例 Proportion of sections with excellent water quality | 主要河流断面监测水质优良(Ⅰ~Ⅱ类)比例 Sections with excellent water quality (Class Ⅰ - Class Ⅱ) / total sections number | 0.644 | 0.229 | - | |
下载: 导出CSV表32007-2016年各省(市、自治区)农用地猪粪负荷强度变动情况
Table3.Changes in pig manure load intensities in agricultural land in different provinces (municipalities) of China during 2007-2016
| 省(市、自治区) Province (municipality) | 2007-2010 | 2010-2013 | 2013-2016 | |||||
| 变动值 Change value (t·hm-2) | 变动率 Change rate | 变动值 Change value (t·hm-2) | 变动率 Change rate | 变动值 Change value (t·hm-2) | 变动率 Change rate | |||
| 上海Shanghai | 2.824 | 0.385 | 0.483 | 0.048 | -3.500 | -0.329 | ||
| 山东Shandong | 1.245 | 0.240 | 0.389 | 0.061 | -0.257 | -0.038 | ||
| 浙江Zhejiang | 0.484 | 0.146 | 0.233 | 0.061 | -2.032 | -0.503 | ||
| 海南Hainan | 0.443 | 0.141 | 0.207 | 0.058 | -0.373 | -0.098 | ||
| 重庆Chongqing | 0.414 | 0.043 | -0.429 | -0.043 | -0.572 | -0.060 | ||
| 北京Beijing | 0.389 | 0.049 | 0.154 | 0.018 | -1.034 | -0.121 | ||
| 湖北Hubei | 0.320 | 0.059 | 0.100 | 0.017 | -0.207 | -0.035 | ||
| 黑龙江Heilongjiang | 0.283 | 0.218 | -0.275 | -0.175 | -0.070 | -0.054 | ||
| 辽宁Liaoning | 0.263 | 0.061 | 0.062 | 0.014 | -0.505 | -0.110 | ||
| 云南Yunnan | 0.249 | 0.084 | -0.050 | -0.016 | -0.126 | -0.040 | ||
| 陕西Shaanxi | 0.241 | 0.164 | -0.006 | -0.004 | -0.117 | -0.069 | ||
| 河南Henan | 0.235 | 0.024 | -0.069 | -0.007 | -0.393 | -0.039 | ||
| 吉林Jilin | 0.212 | 0.151 | 0.007 | 0.004 | -0.066 | -0.041 | ||
| 江西Jiangxi | 0.175 | 0.061 | 0.239 | 0.078 | -0.043 | -0.013 | ||
| 山西Shanxi | 0.163 | 0.080 | 0.005 | 0.002 | -0.091 | -0.041 | ||
| 广东Guangdong | 0.117 | 0.029 | -0.095 | -0.023 | -0.292 | -0.072 | ||
| 安徽Anhui | 0.104 | 0.033 | 0.272 | 0.083 | -0.179 | -0.050 | ||
| 青海Qinghai | 0.088 | 0.147 | 0.044 | 0.065 | 0.014 | 0.019 | ||
| 江苏Jiangsu | 0.075 | 0.012 | 0.134 | 0.021 | -0.166 | -0.026 | ||
| 西藏Tibet | 0.022 | 0.045 | 0.097 | 0.188 | 0.040 | 0.064 | ||
| 新疆Xinjiang | -0.009 | -0.075 | 0.057 | 0.533 | 0.016 | 0.096 | ||
| 内蒙古Inner Mongolia | -0.009 | -0.013 | 0.005 | 0.007 | -0.045 | -0.067 | ||
| 福建Fujian | -0.059 | -0.015 | 0.075 | 0.019 | -0.900 | -0.223 | ||
| 湖南Hunan | -0.081 | -0.009 | 0.291 | 0.033 | -0.359 | -0.039 | ||
| 广西Guangxi | -0.095 | -0.022 | 0.236 | 0.056 | -0.377 | -0.085 | ||
| 甘肃Gansu | -0.114 | -0.106 | 0.054 | 0.056 | -0.016 | -0.016 | ||
| 宁夏Ningxia | -0.222 | -0.174 | -0.131 | -0.125 | -0.066 | -0.071 | ||
| 四川Sichuan | -0.342 | -0.070 | -0.063 | -0.014 | -0.285 | -0.064 | ||
| 贵州Guizhou | -0.687 | -0.136 | -0.035 | -0.008 | -0.203 | -0.047 | ||
| 天津Tianjin | -0.811 | -0.104 | 0.511 | 0.073 | -0.137 | -0.018 | ||
| 河北Hebei | -1.201 | -0.224 | -0.037 | -0.009 | -0.105 | -0.025 | ||
| 均值Mean | 0.152 | 0.040 | 0.080 | 0.035 | -0.402 | -0.072 | ||
下载: 导出CSV表42007-2016年各省(市、自治区)农用地猪粪负荷强度Global Moran’s I指数值
Table4.Global Moran's I indexes of pig manure load intensities in agricultural land in different provinces (municipalities) of China during 2007-2016
| 年份Year | Moran’s I指数Moran’s I index | 预期指Expectations index | 方差Variance | Z得分Z score | P值P value |
| 2007 | 0.259 | -0.030 | 0.007 | 3.557 | 0.000 |
| 2008 | 0.220 | -0.030 | 0.007 | 3.082 | 0.002 |
| 2009 | 0.220 | -0.030 | 0.007 | 3.087 | 0.002 |
| 2010 | 0.219 | -0.030 | 0.007 | 3.072 | 0.002 |
| 2011 | 0.219 | -0.030 | 0.007 | 3.071 | 0.002 |
| 2012 | 0.222 | -0.030 | 0.007 | 3.105 | 0.002 |
| 2013 | 0.230 | -0.030 | 0.007 | 3.213 | 0.001 |
| 2014 | 0.238 | -0.030 | 0.007 | 3.311 | 0.001 |
| 2015 | 0.240 | -0.030 | 0.007 | 3.325 | 0.001 |
| 2016 | 0.242 | -0.030 | 0.007 | 3.348 | 0.001 |
下载: 导出CSV表52007-2016年各省(市、自治区)农用地猪粪负荷强度局部空间格局
Table5.Spatial distribution of pig manure load intensities in agricultural land in different provinces (municipalities) of China during 2007-2016
| 省(市、自治区) Province (municipality) | 热(冷)点置信度Hot (cold) point confidence coefficient | |||
| 2007 | 2010 | 2013 | 2016 | |
| 上海Shanghai | 99% | 99% | 99% | 99% |
| 湖北Hubei | 99% | 99% | 99% | 99% |
| 陕西Shaanxi | 99% | 95% | 95% | 99% |
| 安徽Anhui | 99% | 99% | 99% | 99% |
| 江苏Jiangsu | 99% | 99% | 99% | 99% |
| 湖南Hunan | 99% | 99% | 99% | 99% |
| 山西Shanxi | 90% | 90% | 不显著No significant | 95% |
| 山东Shandong | 不显著No significant | 不显著No significant | 90% | 不显著No significant |
| 浙江Zhejiang | 不显著No significant | 不显著No significant | 不显著No significant | 不显著No significant |
| 海南Hainan | 不显著No significant | 不显著No significant | 不显著No significant | 不显著No significant |
| 重庆Chongqing | 不显著No significant | 不显著No significant | 不显著No significant | 不显著No significant |
| 北京Beijing | 不显著No significant | 90% | 90% | 90% |
| 黑龙江Heilongjiang | 不显著No significant | 不显著No significant | 不显著No significant | 不显著No significant |
| 辽宁Liaoning | 不显著No significant | 不显著No significant | 不显著No significant | 不显著No significant |
| 云南Yunnan | 不显著No significant | 不显著No significant | 不显著No significant | 不显著No significant |
| 河南Henan | 不显著No significant | 不显著No significant | 不显著No significant | 不显著Not significant |
| 吉林Jilin | 不显著No significant | 不显著No significant | 不显著No significant | 不显著No significant |
| 江西Jiangxi | 不显著No significant | 不显著No significant | 90% | 90% |
| 广东Guangdong | 不显著No significant | 不显著No significant | 不显著No significant | 不显著No significant |
| 内蒙古Inner Mongolia | 不显著No significant | 不显著No significant | 不显著No significant | 不显著No significant |
| 福建Fujian | 不显著No significant | 不显著No significant | 不显著No significant | 不显著No significant |
| 广西Guangxi | 不显著No significant | 不显著No significant | 不显著No significant | 不显著No significant |
| 甘肃Gansu | 不显著No significant | 不显著No significant | 不显著No significant | 不显著No significant |
| 宁夏Ningxia | 不显著No significant | 不显著No significant | 不显著No significant | 不显著No significant |
| 四川Sichuan | 不显著No significant | 不显著No significant | 不显著No significant | 不显著No significant |
| 贵州Guizhou | 不显著No significant | 不显著No significant | 不显著No significant | 不显著No significant |
| 天津Tianjin | 不显著No significant | 90% | 90% | 90% |
| 河北Hebei | 不显著No significant | 90% | 90% | 90% |
| 青海Qinghai | -90% | -90% | -90% | -90% |
| 新疆Xinjiang | -90% | -90% | 不显著No significant | 不显著No significant |
| 西藏Tibet | -95% | -95% | -95% | -90% |
| 99%、95%、90%分别表示在1%、5%、10%水平上热点显著, -99%、-95%、-90%分别表示在1%、5%、10%水平上冷点显著。99%, 95% and 90% mean significant hot point at 1%, 5% and 10% levels, respectively. -99%, -95% and -90% mean significant cold point at 1%, 5% and 10% levels, respectively. | ||||
下载: 导出CSV表62007-2016年各省(市、自治区)农用地猪粪负荷强度潜力值
Table6.Potential values of pig manure load intensities in agricultural land intensity in different provinces (municipalities) of China during 2007-2016
| t·hm-2 | |||||||
| 2007 | 2010 | 2013 | 2016 | ||||
| 新疆Xinjiang | 10.079 | 新疆Xinjiang | 10.088 | 新疆Xinjiang | 10.030 | 新疆Xinjiang | 10.015 |
| 西藏Tibet | 9.699 | 西藏Tibet | 9.677 | 西藏Tibet | 9.579 | 内蒙古Inner Mongolia | 9.580 |
| 青海Qinghai | 9.600 | 内蒙古Inner Mongolia | 9.540 | 内蒙古Inner Mongolia | 9.535 | 西藏Tibet | 9.540 |
| 内蒙古Inner Mongolia | 9.531 | 青海Qinghai | 9.513 | 青海Qinghai | 9.468 | 青海Qinghai | 9.454 |
| 甘肃Gansu | 9.119 | 甘肃Gansu | 9.233 | 宁夏Ningxia | 9.272 | 宁夏Ningxia | 9.338 |
| 宁夏Ningxia | 8.919 | 宁夏Ningxia | 9.141 | 甘肃Gansu | 9.179 | 甘肃Gansu | 9.195 |
| 黑龙江Heilongjiang | 8.900 | 黑龙江Heilongjiang | 8.617 | 黑龙江Heilongjiang | 8.893 | 黑龙江Heilongjiang | 8.963 |
| 吉林Jilin | 8.798 | 吉林Jilin | 8.587 | 吉林Jilin | 8.580 | 吉林Jilin | 8.646 |
| 陕西Shaanxi | 8.732 | 陕西Shaanxi | 8.491 | 陕西Shaanxi | 8.497 | 陕西Shaanxi | 8.615 |
| 山西Shanxi | 8.156 | 山西Shanxi | 7.993 | 山西Shanxi | 7.987 | 浙江Zhejiang | 8.191 |
| 江西Jiangxi | 7.322 | 江西Jiangxi | 7.147 | 云南Yunnan | 7.040 | 山西Shanxi | 8.079 |
| 云南Yunnan | 7.239 | 云南Yunnan | 6.990 | 江西Jiangxi | 6.908 | 云南Yunnan | 7.166 |
| 海南Hainan | 7.051 | 安徽Anhui | 6.912 | 安徽Anhui | 6.640 | 福建Fujian | 7.056 |
| 安徽Anhui | 7.016 | 海南Hainan | 6.609 | 海南Hainan | 6.401 | 江西Jiangxi | 6.950 |
| 浙江Zhejiang | 6.876 | 浙江Zhejiang | 6.392 | 浙江Zhejiang | 6.159 | 安徽Anhui | 6.819 |
| 福建Fujian | 6.171 | 福建Fujian | 6.230 | 福建Fujian | 6.156 | 海南Hainan | 6.774 |
| 广东Guangdong | 6.160 | 广东Guangdong | 6.043 | 广东Guangdong | 6.138 | 广东Guangdong | 6.431 |
| 辽宁Liaoning | 5.922 | 河北Hebei | 6.028 | 河北Hebei | 6.065 | 河北Hebei | 6.170 |
| 广西Guangxi | 5.882 | 广西Guangxi | 5.978 | 贵州Guizhou | 5.875 | 广西Guangxi | 6.119 |
| 四川Sichuan | 5.304 | 贵州Guizhou | 5.839 | 广西Guangxi | 5.742 | 辽宁Liaoning | 6.102 |
| 贵州Guizhou | 5.153 | 辽宁Liaoning | 5.659 | 四川Sichuan | 5.710 | 贵州Guizhou | 6.078 |
| 山东Shandong | 5.014 | 四川Sichuan | 5.646 | 辽宁Liaoning | 5.598 | 四川Sichuan | 5.995 |
| 河北Hebei | 4.827 | 湖北Hubei | 4.419 | 湖北Hubei | 4.319 | 湖北Hubei | 4.526 |
| 湖北Hubei | 4.738 | 江苏Jiangsu | 3.882 | 江苏Jiangsu | 3.748 | 江苏Jiangsu | 3.914 |
| 江苏Jiangsu | 3.957 | 山东Shandong | 3.769 | 山东Shandong | 3.380 | 山东Shandong | 3.637 |
| 上海Shanghai | 2.861 | 天津Tianjin | 3.179 | 天津Tianjin | 2.668 | 上海Shanghai | 3.054 |
| 天津Tianjin | 2.368 | 北京Beijing | 1.830 | 北京Beijing | 1.676 | 天津Tianjin | 2.805 |
| 北京Beijing | 2.219 | 湖南Hunan | 1.322 | 湖南Hunan | 1.031 | 北京Beijing | 2.710 |
| 湖南Hunan | 1.240 | 重庆Chongqing | 0.185 | 重庆Chongqing | 0.614 | 湖南Hunan | 1.389 |
| 重庆Chongqing | 0.599 | 河南Henan | 0.107 | 河南Henan | 0.176 | 重庆Chongqing | 1.186 |
| 河南Henan | 0.343 | 上海Shanghai | 0.036 | 上海Shanghai | -0.447 | 河南Henan | 0.570 |
| 均值Mean | 6.122 | 均值Mean | 5.970 | 均值Mean | 5.891 | 均值Mean | 6.292 |
下载: 导出CSV表7省域农用地猪粪负荷强度时空差异影响因素的多元线性回归模型估计结果
Table7.Estimation results of multiple linear regression models for influencing factors of the temporal and spatial differences of pig manure load intensity in provincial agricultural land
| 变量 Variable | 系数 Coefficient | 标准差 Standard deviation | t检验值 t test | P值 P > |t| | 预测方向 Direction prediction | 检验结果 Result |
| 城乡收入比Urban-rural income ratio | -1.368*** | 0.305 | -4.480 | 0.000 | - | - |
| 人均地区生产总值GDP per capita | 0.000 | 0.000 | -0.360 | 0.720 | + | 不显著No significant |
| 上年利润率Profit rate in the last year | 0.018* | 0.010 | 1.770 | 0.077 | + | + |
| 年人均猪肉消费量Annual pork consumption per capita | 0.119*** | 0.018 | 6.610 | 0.000 | + | + |
| 人口密度Population density | 0.001*** | 0.000 | 4.250 | 0.000 | + | + |
| 城镇化率Urbanization rate | -0.008 | 0.022 | -0.370 | 0.713 | + | 不显著No significant |
| 低保人口率Rate of lowest living population | 0.121 | 0.107 | 1.130 | 0.258 | - | 不显著No significant |
| 区位Location | 1.136*** | 0.182 | 6.240 | 0.000 | + | + |
| 人均农作物面积Crop area per capita | -10.839*** | 2.072 | -5.230 | 0.000 | - | - |
| 河网密度River network density | 1.331** | 0.673 | 1.980 | 0.049 | + | + |
| 断面水质优良比例Proportion of sections with excellent water quality | -1.697** | 0.639 | -2.660 | 0.008 | - | - |
| 常数Constant | 5.964** | 1.837 | 3.250 | 0.001 | ||
| ***、**和*分别表示在1%、5%、10%水平显著。***, ** and * mean significant effects of the variables at 1%, 5% and 10% levels, respectively. | ||||||
下载: 导出CSV参考文献
| [1] | 金书秦, 沈贵银, 魏珣, 等.论农业面源污染的产生和应对[J].农业经济问题, 2013, 34(11):97-102 http://d.old.wanfangdata.com.cn/Periodical/nyjjwt201311015 JIN S Q, SHEN G Y, WEI X, et al. On the emergence and response of agricultural non-point source pollution[J]. Issues in Agricultural Economy, 2013, 34(11):97-102 http://d.old.wanfangdata.com.cn/Periodical/nyjjwt201311015 |
| [2] | 武深树, 谭美英, 黄璜, 等.湖南洞庭湖区农地畜禽粪便承载量估算及其风险评价[J].中国生态农业学报, 2009, 17(6):1245-1251 http://www.ecoagri.ac.cn/zgstny/ch/reader/view_abstract.aspx?file_no=2009636&flag=1 WU S S, TAN M Y, HUANG H, et al. Loading capacity estimation and risk assessment of livestock manure in cultivated lands around Dongting Lake[J]. Chinese Journal of Eco-Agriculture, 2009, 17(6):1245-1251 http://www.ecoagri.ac.cn/zgstny/ch/reader/view_abstract.aspx?file_no=2009636&flag=1 |
| [3] | 张田, 卜美东, 耿维.中国畜禽粪便污染现状及产沼气潜力[J].生态学杂志, 2012, 31(5):1241-1249 http://d.old.wanfangdata.com.cn/Periodical/stxzz201205030 ZHANG T, BU M D, GENG W. Pollution status and biogas-producing potential of livestock and poultry excrements in China[J]. Chinese Journal of Ecology, 2012, 31(5):1241-1249 http://d.old.wanfangdata.com.cn/Periodical/stxzz201205030 |
| [4] | 仇焕广, 莫海霞, 白军飞, 等.中国农村畜禽粪便处理方式及其影响因素——基于五省调查数据的实证分析[J].中国农村经济, 2012, (3):78-87 http://www.wanfangdata.com.cn/details/detail.do?_type=perio&id=QK201203357946 QIU H G, MO H X, BAI J F, et al. Treatment of livestock manure in rural China and its influencing factors:An empirical analysis based on survey data from five provinces[J]. Chinese Rural Economy, 2012, (3):78-87 http://www.wanfangdata.com.cn/details/detail.do?_type=perio&id=QK201203357946 |
| [5] | 仇焕广, 严健标, 蔡亚庆, 等.我国专业畜禽养殖的污染排放与治理对策分析——基于五省调查的实证研究[J].农业技术经济, 2012, (5):29-35 http://www.wanfangdata.com.cn/details/detail.do?_type=perio&id=QK201201683295 QIU H G, YAN J B, CAI Y Q, et al. Analysis of pollution emissions and countermeasures of specialized livestock and poultry breeding in China:An empirical study based on five provincial surveys[J]. Agrotechnical Economics, 2012, (5):29-35 http://www.wanfangdata.com.cn/details/detail.do?_type=perio&id=QK201201683295 |
| [6] | 夏晓平, 李秉龙, 隋艳颖.中国畜牧业生产结构的区域差异分析——基于资源禀赋与粮食安全视角[J].资源科学, 2010, 32(8):1592-1600 http://www.wanfangdata.com.cn/details/detail.do?_type=perio&id=zykx201008023 XIA X P, LI B L, SUI Y Y. Analysis of regional differentiation of animal husbandry production structure in China from the perspectives of resources endowment and food security[J]. Resources Science, 2010, 32(8):1592-1600 http://www.wanfangdata.com.cn/details/detail.do?_type=perio&id=zykx201008023 |
| [7] | 仇焕广, 廖绍攀, 井月, 等.我国畜禽粪便污染的区域差异与发展趋势分析[J].环境科学, 2013, 34(7):2766-2774 http://d.old.wanfangdata.com.cn/Periodical/hjkx201307038 QIU H G, LIAO S P, JING Y, et al. Regional differences and development tendency of livestock manure pollution in China[J]. Environmental Science, 2013, 34(7):2766-2774 http://d.old.wanfangdata.com.cn/Periodical/hjkx201307038 |
| [8] | 王军霞, 徐菲, 刘瑞民, 等.我国畜禽养殖总量空间热点分析及主要污染物核算[J].农业环境科学学报, 2017, 36(7):1316-1322 http://d.old.wanfangdata.com.cn/Periodical/nyhjbh201707013 WANG J X, XU F, LIU R M, et al. Hotspot analysis and estimation of the main pollutants from livestock in China[J]. Journal of Agro-Environment Science, 2017, 36(7):1316-1322 http://d.old.wanfangdata.com.cn/Periodical/nyhjbh201707013 |
| [9] | 张绪美, 董元华, 王辉, 等.中国畜禽养殖结构及其粪便N污染负荷特征分析[J].环境科学, 2007, 38(6):1311-1318 doi: 10.3321/j.issn:0250-3301.2007.06.026 ZHANG X M, DONG Y H, WANG H, et al. Structure of livestock and variation of fecal nitrogen pollution load in China[J]. Environmental Science, 2007, 38(6):1311-1318 doi: 10.3321/j.issn:0250-3301.2007.06.026 |
| [10] | 王爽, 孙磊, 金梁, 等.黑龙江省畜禽养殖量时空分布特征及耕地污染负荷分析[J].东北农业大学学报, 2016, 47(12):38-47 doi: 10.3969/j.issn.1005-9369.2016.12.006 WANG S, SUN L, JIN L, et al. Spatial and temporal distribution features of livestock and poultry production and pollution load of cultivated land in Heilongjiang Province[J]. Journal of Northeast Agricultural University, 2016, 47(12):38-47 doi: 10.3969/j.issn.1005-9369.2016.12.006 |
| [11] | 阎波杰, 赵春江, 潘瑜春, 等.规模化养殖畜禽粪便量估算及环境影响研究[J].中国环境科学, 2009, 29(7):733-737 doi: 10.3321/j.issn:1000-6923.2009.07.012 YAN B J, ZHAO C J, PAN Y C, et al. Estimation of the amount of livestock manure and its environmental influence of large-scaled culture based on spatial information[J]. China Environmental Science, 2009, 29(7):733-737 doi: 10.3321/j.issn:1000-6923.2009.07.012 |
| [12] | FRANKLIN R S, RUTH M. Growing up and cleaning up:The environmental Kuznets curve redux[J]. Applied Geography, 2012, 32(1):29-39 http://europepmc.org/abstract/MED/25214678 |
| [13] | YORK R, ROSA E A, DIETZ T. STIRPAT, IPAT and ImPACT:Analytic tools for unpacking the driving forces of environmental impacts[J]. Ecological Economics, 2003, 46(3):351-365 doi: 10.1016/S0921-8009(03)00188-5 |
| [14] | TORRAS M, BOYCE J K. Income, inequality, and pollution:A reassessment of the environmental Kuznets curve[J]. Ecological Economics, 1998, 25(2):147-160 doi: 10.1016/S0921-8009(97)00177-8 |
| [15] | ANDREONI J, LEVINSON A. The simple analytics of the environmental Kuznets curve[J]. Journal of Public Economics, 2001, 80(2):269-286 doi: 10.1016-S0047-2727(00)00110-9/ |
| [16] | HE J, WANG H. Economic structure, development policy and environmental quality:An empirical analysis of environmental Kuznets curves with Chinese municipal data[J]. Ecological Economics, 2012, 76:49-59 doi: 10.1016/j.ecolecon.2012.01.014 |
| [17] | 杨飞, 杨世琦, 诸云强, 等.中国近30年畜禽养殖量及其耕地氮污染负荷分析[J].农业工程学报, 2013, 29(5):1-11 http://d.old.wanfangdata.com.cn/Periodical/nygcxb201305003 YANG F, YANG S Q, ZHU Y Q, et al. Analysis on livestock and poultry production and nitrogen pollution load of cultivated land during last 30 years in China[J]. Transactions of the CSAE, 2013, 29(5):1-11 http://d.old.wanfangdata.com.cn/Periodical/nygcxb201305003 |
| [18] | 潘丹.基于农户偏好的牲畜粪便污染治理政策选择——以生猪养殖为例[J].中国农村观察, 2016, (2):68-83 http://www.wanfangdata.com.cn/details/detail.do?_type=perio&id=668569836 PAN D. Farmers' preferences for manure pollution control policies:The case of pig breeding[J]. China Rural Survey, 2016, (2):68-83 http://www.wanfangdata.com.cn/details/detail.do?_type=perio&id=668569836 |
| [19] | 彭里, 王定勇.重庆市畜禽粪便年排放量的估算研究[J].农业工程学报, 2004, 20(1):288-292 doi: 10.3321/j.issn:1002-6819.2004.01.069 PENG L, WANG D Y. Estimation of annual quantity of total excretion from livestock and poultry in Chongqing Municipality[J]. Transactions of the CSAE, 2004, 20(1):288-292 doi: 10.3321/j.issn:1002-6819.2004.01.069 |
| [20] | 王方浩, 马文奇, 窦争霞, 等.中国畜禽粪便产生量估算及环境效应[J].中国环境科学, 2006, 26(5):614-617 doi: 10.3321/j.issn:1000-6923.2006.05.024 WANG F H, MA W Q, DOU Z X, et al. The estimation of the production amount of animal manure and its environmental effect in China[J]. China Environmental Science, 2006, 26(5):614-617 doi: 10.3321/j.issn:1000-6923.2006.05.024 |
| [21] | 苏丁丁, 曾建国, 伍小松, 等.湖南省畜禽养殖污染年排放量调查分析[J].农业现代化研究, 2011, 32(1):125-128 doi: 10.3969/j.issn.1000-0275.2011.01.028 SU D D, ZENG J G, WU X S, et al. Investigation and analysis on present condition of livestock excrement and urine pollution in Hunan Province[J]. Research of Agricultural Modernization, 2011, 32(1):125-128 doi: 10.3969/j.issn.1000-0275.2011.01.028 |
| [22] | 刘刚, 沈镭.中国生物质能源的定量评价及其地理分布[J].自然资源学报, 2007, 22(1):9-19 doi: 10.3321/j.issn:1000-3037.2007.01.002 LIU G, SHEN L. Quantitive appraisal of biomass energy and its geographical distribution in China[J]. Journal of Natural Resources, 2007, 22(1):9-19 doi: 10.3321/j.issn:1000-3037.2007.01.002 |
| [23] | 付强, 诸云强, 孙九林, 等.中国畜禽养殖的空间格局与重心曲线特征分析[J].地理学报, 2012, 67(10):1383-1398 doi: 10.11821/xb201210009 FU Q, ZHU Y Q, SUN J L, et al. Spatial patterns and gravity centers curve of livestock and poultry breeding in China[J]. Acta Geographica Sinica, 2012, 67(10):1383-1398 doi: 10.11821/xb201210009 |
| [24] | 杨世琦, 韩瑞芸, 刘晨峰.省域尺度下畜禽粪便的农田消纳量及承载负荷研究[J].中国农业大学学报, 2016, 21(7):142-151 http://d.old.wanfangdata.com.cn/Periodical/zgnydxxb201607018 YANG S Q, HAN R Y, LIU C F. Study on the given amount per unit field and load capacity of livestock and poultry manure at provincial scale[J]. Journal of China Agricultural University, 2016, 21(7):142-151 http://d.old.wanfangdata.com.cn/Periodical/zgnydxxb201607018 |
| [25] | 张立新, 朱道林, 杜挺, 等.基于DEA模型的城市建设用地利用效率时空格局演变及驱动因素[J].资源科学, 2017, 39(3):418-429 http://d.old.wanfangdata.com.cn/Periodical/zykx201703004 ZHANG L X, ZHU D L, DU T, et al. Spatiotemporal pattern evolvement and driving factors of urban construction land use efficiency using data envelopment analysis[J]. Resources Science, 2017, 39(3):418-429 http://d.old.wanfangdata.com.cn/Periodical/zykx201703004 |
| [26] | 畜禽粪污土地承载力测算技术指南[J].甘肃畜牧兽医, 2018, 48(1): 18-20 http://www.cnki.com.cn/Article/CJFDTotal-GXMS201801007.htm Technical guide for calculating land carrying capacity of livestock and poultry manure[J]. Gansu Animal and Veterinary Sciences, 2018, 48(1): 18-20 http://www.cnki.com.cn/Article/CJFDTotal-GXMS201801007.htm |
| [27] | 金书秦, 沈贵银.中国农业面源污染的困境摆脱与绿色转型[J].改革, 2013, (5):79-87 http://www.wanfangdata.com.cn/details/detail.do?_type=perio&id=QKC20132013062700096785 JIN S Q, SHEN G Y. The dilemma of agricultural non-point source pollution in China and its transformation from green transformation[J]. Reform, 2013, (5):79-87 http://www.wanfangdata.com.cn/details/detail.do?_type=perio&id=QKC20132013062700096785 |
| [28] | 郑黄山, 陈淑凤, 孙小霞, 等.为什么"污染者付费原则"在农村难以执行?——南平养猪污染第三方治理中养猪户付费行为研究[J].中国生态农业学报, 2017, 25(7):1081-1089 http://www.ecoagri.ac.cn/zgstny/ch/reader/view_abstract.aspx?file_no=20170716&flag=1 ZHENG H S, CHEN S F, SUN X X, et al. Why polluter-pays principle is difficult to implement in rural areas?-A case study of pig-farmer paying behavior under the third party governance of pig-farming pollution in Nanping[J]. Chinese Journal of Eco-Agriculture, 2017, 25(7):1081-1089 http://www.ecoagri.ac.cn/zgstny/ch/reader/view_abstract.aspx?file_no=20170716&flag=1 |
| [29] | 刘晓永, 王秀斌, 李书田.中国农田畜禽粪尿氮负荷量及其还田潜力[J].环境科学, 2018, 39(12):5723-5739 http://www.cnki.com.cn/Article/CJFDTotal-HJKZ201812052.htm LIU X Y, WANG X B, LI S T. Livestock and poultry faeces nitrogen loading rate and its potential return to farmland in China[J]. Environmental Science, 2018, 39(12):5723-5739 http://www.cnki.com.cn/Article/CJFDTotal-HJKZ201812052.htm |
| [30] | 杜焱强, 刘平养, 包存宽, 等.社会资本视阈下的农村环境治理研究——以欠发达地区J村养殖污染为个案[J].公共管理学报, 2016, (4):101-112 http://www.cqvip.com/QK/87267X/201604/670372896.html DU Y Q, LIU P Y, BAO C K, et al. A study on rural environmental governance through the lens of social capital-A case of livestock farming pollution in the undeveloped region[J]. Journal of Public Management, 2016, (4):101-112 http://www.cqvip.com/QK/87267X/201604/670372896.html |
| [31] | 林丽梅, 刘振滨, 杜焱强, 等.生猪规模养殖户污染防治行为的心理认知及环境规制影响效应[J].中国生态农业学报, 2018, 26(1):156-166 http://www.ecoagri.ac.cn/zgstny/ch/reader/view_abstract.aspx?file_no=20180117&flag=1 LIN L M, LIU Z B, DU Y Q, et al. Psychological cognition of pollution prevention of family-oriented scale pig breeders and environmental regulation influence effects[J]. Chinese Journal of Eco-Agriculture, 2018, 26(1):156-166 http://www.ecoagri.ac.cn/zgstny/ch/reader/view_abstract.aspx?file_no=20180117&flag=1 |
