张荣霞1,
叶玉珍3,
吴仁烨1,
王松良1,,
1.福建农林大学作物科学学院/福建省农业生态过程与安全监控重点实验室 福州 350002
2.福建省金梭椤生态文明研究所 福州 350002
3.福建省明溪县城郊农业技术推广站 明溪 365200
基金项目: 福建省社科规划项目FJ2018B070
福建农林大学国际科技合作与交流项目KXb16017A
福建农林大学科技创新专项基金项目KFA17163A
详细信息
作者简介:康智明, 主要研究方向为农田面源污染评价、重金属污染评价。E-mail:kangzhiming56@163.com
通讯作者:王松良, 主要研究方向为农业生态学、农业生态系统管理。E-mail:wsoloedu07@126.com
中图分类号:X820.4计量
文章访问数:691
HTML全文浏览量:1
PDF下载量:499
被引次数:0
出版历程
收稿日期:2018-01-25
录用日期:2018-07-20
刊出日期:2018-12-01
GIS-based pollution risk assessment of nitrogen and phosphorus loss in surface runoff in farmlands in Fujian Province
KANG Zhiming1, 2,,ZHANG Rongxia1,
YE Yuzhen3,
WU Renye1,
WANG Songliang1,,
1. College of Crop Science, Fujian Agriculture and Forestry University/Fujian Provincial Key Laboratory of Agroecological Processing and Safety Monitoring, Fuzhou 350002, China
2. Fujian Thoreau Institute of Ecological Civilization, Fuzhou 350002, China
3. Agricultural Technology Extension Station of Chengjiao Town, Mingxi County, Mingxi 365200, China
Funds: the Social Science Planning Project of Fujian ProvinceFJ2018B070
the International Sci-tech Collaboration & Communication Project of Fujian Agriculture and Forestry UniversityKXb16017A
the Sci-tech Innovation Fund Project of Fujian Agriculture and Forestry UniversityKFA17163A
More Information
Corresponding author:WANG Songliang, E-mail:wsoloedu07@126.com
摘要
HTML全文
图
参考文献
相关文章
施引文献
资源附件
访问统计
摘要
摘要:为了掌握福建省农田氮磷地表径流流失特征,以福建省的9个地级市为研究边界,通过对其辖区1985—2016年间农田氮、磷化肥施用量的调查,计算农田化肥氮磷的地表径流流失量,并在耦合农田化肥地表径流流失量、降雨和河网密度3个因素的基础上,分析福建省各地级行政区域农田化肥氮磷的污染风险等级,应用地理信息系统(GIS)分析其氮、磷污染的空间分布。结果表明:32年间福建省化肥施用量由4.911×10⁵ t增加到1.239×10⁶t,年均增长3.03%;漳州市氮肥和磷肥的施用强度最大,分别达880.40 kg·hm-2和429.21 kg·hm-2;氮磷地表流失量较高的区域主要集中在漳州市,其氮、磷地表流失强度分别达8.71 kg·hm-2和1.99 kg·hm-2。从氮、磷污染风险等级看,南平市氮、磷肥的流失风险值均最高,分别达63.19%和63.37%,属于高氮磷污染风险区域;厦门市氮、磷肥的流失风险值均最低,分别为0.53%和0.53%,属于低污染风险区域;其他市处于两者之间。可见,漳州市农业发展中应注重氮、磷肥的减量化;南平市则注重对农田氮、磷地表径流流失的风险防范;全省应加大力度发展生态农业,以助力福建省生态文明先行示范区、生态文明试验区的建设。
关键词:福建/
氮磷化肥施用量/
农业面源污染/
氮磷地表径流/
氮磷污染风险
Abstract:Nitrogen and phosphorus loss in surface runoff from farmlands has been the main cause of water eutrophication.Fujian Province is one of the regions with the highest intensity of fertilizer application per unit area of land in China.The subtropical monsoon climate zone and hilly region with heavy summer and autumn rains on steep hill-slope farmlands in Fujian increase the risk potential for pollution.Thus to analyze current conditions and characteristics of nitrogen and phosphorus loss in surface runoff from farmland in Fujian Province, we selected nine prefectural level cities in Fujian Province as the study areas to estimate the loss of nitrogen and phosphorus in surface runoff in farmlands based on investigated data of fertilizer use in the cities for the period from 1985 to 2016.By integrating the three factors of pollution risk (fertilizer loss, rainfall and drainage intensity), we evaluated nitrogen and phosphorus pollution risk from farmland fertilizer to determine critical areas of primary concern.We used the ArcGIS platform to make thematic maps for visualizing the spatial distribution of contaminated areas by nitrogen and phosphorus.The results showed that fertilizer application in Fujian Province increased during the 30-year period from 4.911×10⁵ t to 1.239×10⁶ t, with an annual average rate of increase of 3.03%.The amount of fertilizer use in Fujian Province was highest (1.243×10⁶ t) in 1999, accounting for 3.01% of total fertilizer use in China.The intensities of nitrogenous and phosphate fertilizer use in Zhangzhou City were largest, with respective values of 880.40 kg·hm-2 and 429.21 kg·hm-2.The high nitrogen and phosphorus surface runoff were concentrated in Zhangzhou City, which were respectively 1.571×10⁶ t and 3.590×10⁵ t, with nitrogen and phosphorus loss intensities of 8.71 kg·hm-2 and 1.99 kg·hm-2.However, pollution risk values of nitrogen and phosphate fertilizer were highest in Nanping City, reaching respectively 63.19% and 63.37%-a high risk of nitrogen and phosphorus pollution.Xiamen City had the lowest risk values, respectively 0.53% and 0.53%.The others were in between and in the following decreasing order:Ningde City (57.22% and 54.48%) > Sanming City (53.34% and 53.34%) > Longyan City (51.38% and 51.20%) > Zhangzhou City (46.73% and 46.73%) > Quanzhou City (45.49% and 40.25%) > Fuzhou City (34.35% and 33.80%) > Putian City (18.59% and 16.93%).By using cluster analysis, these nine cities were divided into three groups-heavy to moderate pollution risk (Sanming City, Longyan City, Ningde City and Nanping City), moderate to light pollution risk (Quanzhou City, Zhangzhou City and Fuzhou City) and low pollution risk (Xiamen City and Putian City).We concluded that Zhangzhou City needed to emphasize on reducing nitrogen and phosphorus fertilizer use in agriculture.Nanping City needed to hammer at risk control of nitrogen and phosphorus loss in farmlands.The others cities needed to strengthen the development of ecological agriculture to facilitate the construction of Fujian Experimented Region of Ecological Civilization and the promotion and optimization of control measures of nitrogen and phosphorus loss in surface runoff.
Key words:Fujian Province/
Nitrogen and phosphorus fertilizers application rates/
Non-point source pollution/
Nitrogen and phosphorus surface runoff/
Nitrogen and phosphorus pollution risk
HTML全文
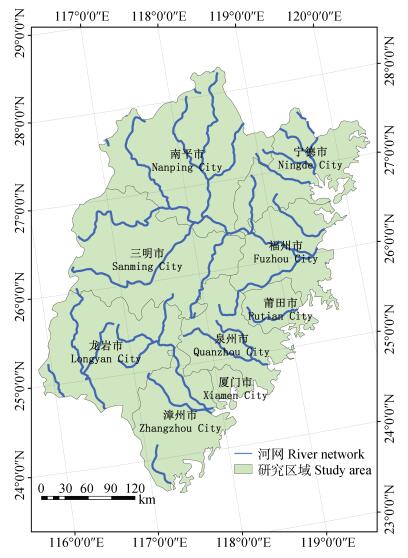
图1研究区域与河网地理位置
Figure1.Location of the study area and its river network
 下载: 全尺寸图片幻灯片
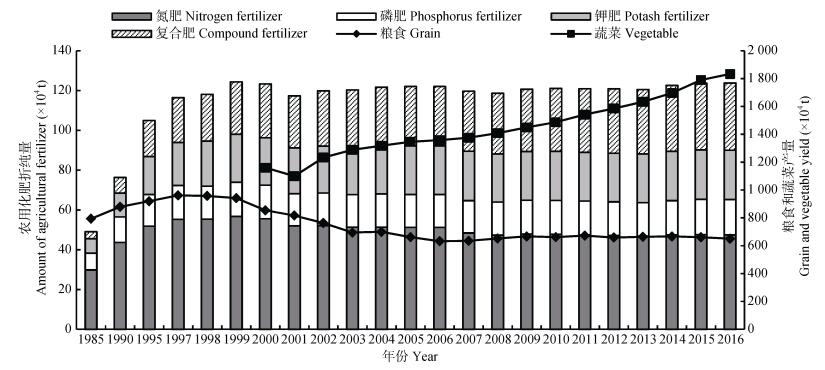
图21985—2016年福建省化肥施用量及粮食、蔬菜产量变化
Figure2.Changes of fertilizer application quantity and grain and vegetable yields in Fujian Province from 1985 to 2016
下载: 全尺寸图片幻灯片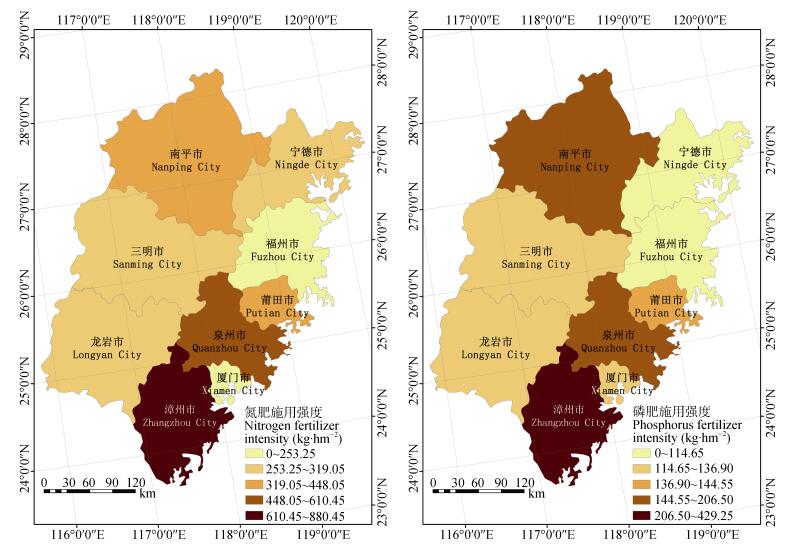
图32015年福建省农田氮磷肥施用强度空间分布
Figure3.Spatial distribution of nitrogen and phosphorus fertilizers intensities in Fujian Province in 2015
下载: 全尺寸图片幻灯片
图42015年福建省农田氮磷地表径流流失量的空间分布
Figure4.Spatial distribution of amounts of nitrogen and phosphorus surface runoff loss in Fujian Province in 2015
下载: 全尺寸图片幻灯片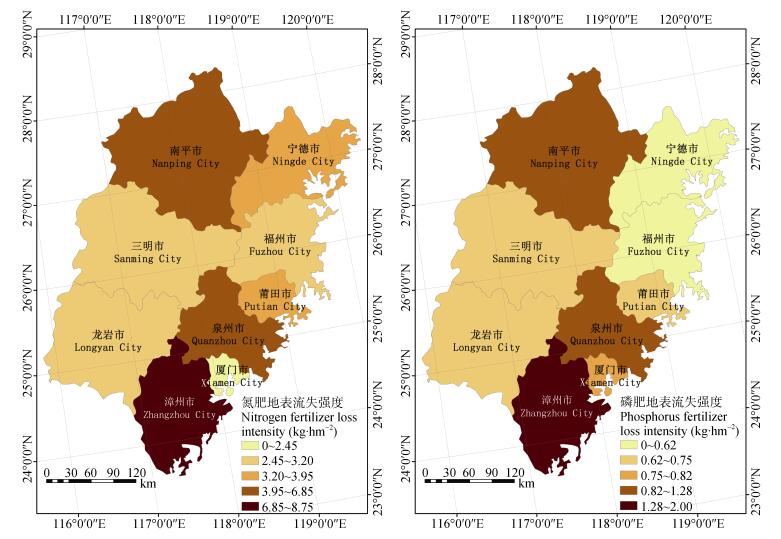
图52015年福建省农田地表氮磷地表径流流失强度空间分布
Figure5.Spatial distribution of nitrogen and phosphorus fertilizer surface runoff loss intensities in Fujian Province in 2015
下载: 全尺寸图片幻灯片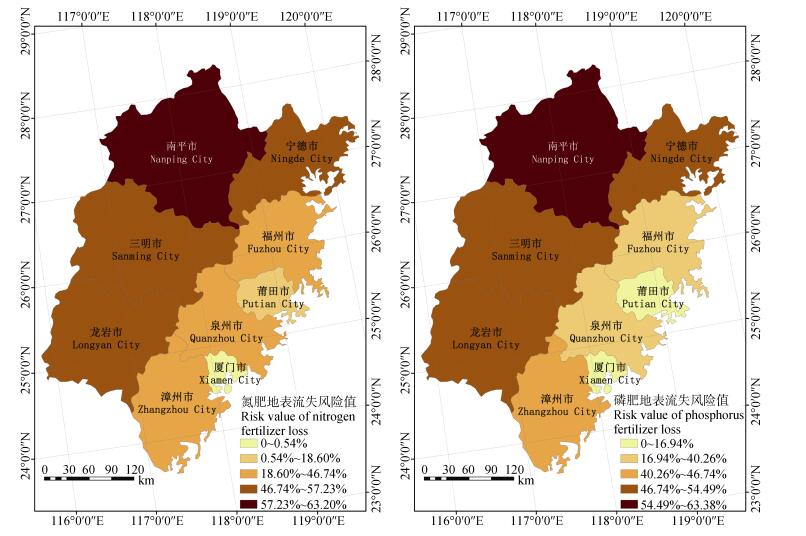
图62015年福建省农田氮磷地表径流流失污染风险值
Figure6.Risk values of surface runoff losses of nitrogen and phosphorus fertilizers in Fujian Province in 2015
下载: 全尺寸图片幻灯片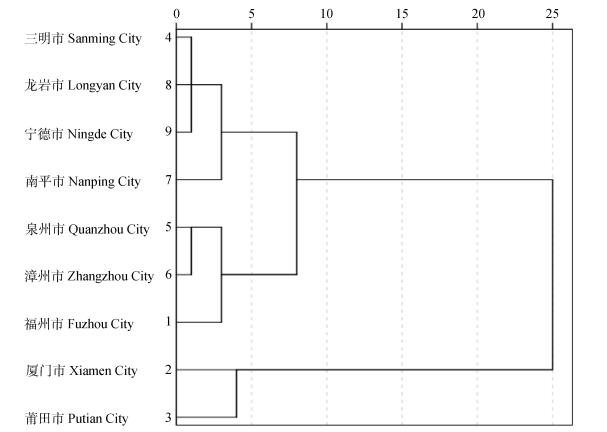
图7福建省氮磷地表流失风险等级聚类分析
Figure7.Cluster analysis of risk level of surface runoff loss of nitrogen and phosphorus fertilizers in cities of Fujian Province in 2015
下载: 全尺寸图片幻灯片表1研究基础数据的类型及其来源
Table1.Data used in the study and their sources
| 数据类型Data type | 来源Sources | 主要数据Main data |
| 农作物播种面积 Crop sowing area | 各市级行政区《统计年鉴》 Statistical Yearbook of the cities | 主要农作物播种面积 Sowing area of the main crops |
| 农田氮磷流失系数 Loss coefficients of nitrogen and phosphorus in farmland | 《全国农业面源污染流失系数手册》 Handbook of Farmland Non-point Source Pollution Emission Coefficient in China | 地表径流流失系数[15] Loss coefficient of surface runoff[15] |
| 流失系数分区数据 Partition data of loss coefficient | 中国科学院资源环境科学数据中心 Data Center for Resource and Environmental Sciences in Chinese Academy of Sciences | 坡度、农区、水旱田[12] Slope, agricultural area, and farmland |
| 降雨数据 Rainfall | 各市级行政区《统计年鉴》 Statistical Yearbook of the cities | 年平均降雨量数据 Annual average rainfall data |
| 河网数据 River net | 中国科学院资源环境科学数据中心 Data Center for Resource and Environmental Sciences in Chinese Academy of Sciences | 河网长度[16] River network length[16] |
| 市级化肥施用数据 Fertilizer application in city level | 各市级行政区《统计年鉴》 Statistical Yearbook of the cities | 化肥施用折纯总量 Total amount of fertilizer application |
| 省级化肥施用数据 Fertilizer application in provincial level | 福建省统计年鉴 Statistical Yearbook of Fujian Province | 化肥施用折纯总量 Total amount of fertilizer application |
下载: 导出CSV表2农田氮磷污染风险分级方案
Table2.Risk classification scheme for farmland nitrogen and phosphorus pollution
| 风险等级 Risk class | 低 Lower | 较低 Low | 中 Moderate | 较高 High | 高 Higher |
| 风险值 Risk value (%) | 0~20 | 20~40 | 40~60 | 60~80 | 80~100 |
下载: 导出CSV表3福建省三大区域的氮磷地表流失风险值
Table3.Risk values of nitrogen/phosphorus surface runoff losses in three areas of Fujian Province in 2015
| 中度偏高区 Moderate to high risk area | 中度偏低区 Moderate to low risk area | 低风险区 Low risk area | |
| 氮地表径流流失 Nitrogen surface runoff loss | 0.56±0.05 | 0.42±0.07 | 0.10±0.13 |
| 磷地表径流流失 Phosphorus surface runoff loss | 0.56±0.05 | 0.40±0.06 | 0.09±0.12 |
下载: 导出CSV参考文献
| [1] | 王建兵, 程磊.农业面源污染现状分析[J].江西农业大学学报:社会科学版, 2008, 7(3):35-39 http://d.old.wanfangdata.com.cn/Periodical/jxnydxxb-shkxb200803008 WANG J B, CHENG L. Analysis on the present situation of agricultural non-point source solution[J]. Journal of Jiangxi Agricultural University:Social Sciences Edition, 2008, 7(3):35-39 http://d.old.wanfangdata.com.cn/Periodical/jxnydxxb-shkxb200803008 |
| [2] | 王国重, 李中原, 左其亭, 等.丹江口水库水源区农业面源污染物流失量估算[J].环境科学研究, 2017, 30(3):415-422 http://d.old.wanfangdata.com.cn/Periodical/hjkxyj201703010 WANG G Z, LI Z Y, ZUO Q T, et al. Estimation of agricultural non-point source pollutant loss in catchment areas of Danjiangkou Reservoir[J]. Research of Environmental Sciences, 2017, 30(3):415-422 http://d.old.wanfangdata.com.cn/Periodical/hjkxyj201703010 |
| [3] | 孙铖, 周华真, 陈磊, 等.农田化肥氮磷地表径流污染风险评估[J].农业环境科学学报, 2017, 36(7):1266-1273 http://d.old.wanfangdata.com.cn/Periodical/nyhjbh201707007 SUN C, ZHOU H Z, CHEN L, et al. The pollution risk assessment of nitrogen and phosphorus loss in surface runoff from farmland fertilizer[J]. Journal of Agro-Environment Science, 2017, 36(7):1266-1273 http://d.old.wanfangdata.com.cn/Periodical/nyhjbh201707007 |
| [4] | 刘钦普.江苏氮磷钾化肥使用地域分异及环境风险评价[J].应用生态学报, 2015, 26(5):1477-1483 http://d.old.wanfangdata.com.cn/Periodical/yystxb201505026 LIU Q P. Regional difference of NPK fertilizers application and environmental risk assessment in Jiangsu Province, China[J]. Chinese Journal of Applied Ecology, 2015, 26(5):1477-1483 http://d.old.wanfangdata.com.cn/Periodical/yystxb201505026 |
| [5] | 吴义根, 冯开文, 李谷成.我国农业面源污染的时空分异与动态演进[J].中国农业大学学报, 2017, 22(7):186-199 http://www.wanfangdata.com.cn/details/detail.do?_type=perio&id=zgnydxxb201707021 WU Y G, FENG K W, LI G C. Spatial-temporal pattern and dynamic evolution of agricultural non-point source pollution in China[J]. Journal of China Agricultural University, 2017, 22(7):186-199 http://www.wanfangdata.com.cn/details/detail.do?_type=perio&id=zgnydxxb201707021 |
| [6] | WANG A, TANG L H, YANG D W, et al. Spatio-temporal variation of net anthropogenic nitrogen inputs in the upper Yangtze River basin from 1990 to 2012[J]. Science China Earth Sciences, 2016, 59(11):2189-2201 doi: 10.1007/s11430-016-0014-6 |
| [7] | 李佳韵, 童菊秀, 夏传安, 等.降雨条件下农田氮素地表径流流失特征研究[J].灌溉排水学报, 2016, 35(7):8-15 http://d.old.wanfangdata.com.cn/Periodical/ggps201607002 LI J Y, TONG J X, XIA C A, et al. Experiments study on farmland nitrogen loss to surface runoff under rainfall condition[J]. Journal of Irrigation and Drainage, 2016, 35(7):8-15 http://d.old.wanfangdata.com.cn/Periodical/ggps201607002 |
| [8] | 周晓琴, 杨乐, 杨令飞.新疆农业面源污染物排放量估算及分析[J].农业环境科学学报, 2017, 36(7):1300-1307 http://d.old.wanfangdata.com.cn/Periodical/nyhjbh201707011 ZHOU X Q, YANG L, YANG L F. Estimation and analysis of emissions from agricultural non-point source pollution in Xinjiang[J]. Journal of Agro-Environment Science, 2017, 36(7):1300-1307 http://d.old.wanfangdata.com.cn/Periodical/nyhjbh201707011 |
| [9] | 卢少勇, 张萍, 潘成荣, 等.洞庭湖农业面源污染排放特征及控制对策研究[J].中国环境科学, 2017, 37(6):2278-2286 doi: 10.3969/j.issn.1000-6923.2017.06.036 LU S Y, ZHANG P, PAN C R, et al. Agricultural non-point source pollution discharge characteristic and its control measures of Dongtinghu Lake[J]. China Environmental Science, 2017, 37(6):2278-2286 doi: 10.3969/j.issn.1000-6923.2017.06.036 |
| [10] | 杨宪龙, 同延安, 路永莉, 等.农田氮肥利用率计算方法研究进展[J].应用生态学报, 2015, 26(7):2203-2212 http://d.old.wanfangdata.com.cn/Periodical/yystxb201507038 YANG X L, TONG Y A, LU Y L, et al. Research advances in the calculating method of nitrogen use efficiency (NUE) in cultivated lands[J]. Chinese Journal of Applied Ecology, 2015, 26(7):2203-2212 http://d.old.wanfangdata.com.cn/Periodical/yystxb201507038 |
| [11] | 吕玉娟, 彭新华, 高磊, 等.红壤丘陵岗地区坡地地表径流氮磷流失特征研究[J].土壤, 2015, 47(2):297-304 http://kns.cnki.net/KCMS/detail/detail.aspx?filename=TURA201502016&dbname=CJFD&dbcode=CJFQ LYU Y J, PENG X H, GAO L, et al. Characteristics of nitrogen and phosphorus losses through surface runoff on sloping land, red soil hilly region[J]. Soils, 2015, 47(2):297-304 http://kns.cnki.net/KCMS/detail/detail.aspx?filename=TURA201502016&dbname=CJFD&dbcode=CJFQ |
| [12] | 陈颖, 赵磊, 杨勇, 等.海河流域水稻田氮磷地表径流流失特征初探[J].农业环境科学学报, 2011, 30(2):328-333 http://d.old.wanfangdata.com.cn/Periodical/nyhjbh201102018 CHEN Y, ZHAO L, YANG Y, et al. Preliminary study on characteristics of nitrogen and phosphorus runoff losses from rice fields in Hai River Basin, China[J]. Journal of Agro-Environment Science, 2011, 30(2):328-333 http://d.old.wanfangdata.com.cn/Periodical/nyhjbh201102018 |
| [13] | 向速林, 王逢武, 陶术平, 等.赣江下游水稻田地表径流氮磷流失分析[J].江苏农业科学, 2015, 43(1):315-317 http://d.old.wanfangdata.com.cn/Periodical/jsnykx201501106 XIANG S L, WANG F W, TAO S P, et al. Study on characteristics of nitrogen and phosphorus runoff losses from rice fields in the Ganjiang River downstream[J]. Jiangsu Agricultural Sciences, 2015, 43(1):315-317 http://d.old.wanfangdata.com.cn/Periodical/jsnykx201501106 |
| [14] | 陈翠蓉, 刘伟平.福建省农业面源污染现状和治理对策研究[J].山西农业大学学报:社会科学版, 2016, 15(5):353-357 http://d.old.wanfangdata.com.cn/Periodical/sxnydxxb-shkx201605009 CHEN C R, LIU W P. On agricultural non-point source pollution in Fujian Province[J]. Journal of Shanxi Agricultural University:Social Science Edition, 2016, 15(5):353-357 http://d.old.wanfangdata.com.cn/Periodical/sxnydxxb-shkx201605009 |
| [15] | 任天志, 刘宏斌, 范先鹏, 等.全国农田面源污染排放系数手册[M].北京:中国农业出版社, 2015 REN T Z, LIU H B, FAN X P, et al. Handbook of Farmland Non-Point Source Pollution Emission Coefficient in China[M]. Beijing:China Agriculture Press, 2015 |
| [16] | 中国科学院地理科学与资源研究所, 中国科学院资源环境科学数据中心.资源环境数据云平台[DB/OL]. http:www.resdc.cn Institute of Geographic Sciences and Natural Resources Research, Chinese Academy of Sciences; Data Center for Resource and Environmental Sciences, Chinese Academy of Sciences. Resource and Environment Data Cloud Platform[DB/OL]. http:www.resdc.cn |
| [17] | ZHANG B L, CUI B H, ZHANG S M, et al. Source apportionment of nitrogen and phosphorus from non-point source pollution in Nansi Lake Basin, China[J]. Environmental Science and Pollution Research, 2018, 25(19):19101-19113 doi: 10.1007/s11356-018-1956-8 |
| [18] | LU H, XIE H L. Impact of changes in labor resources and transfers of land use rights on agricultural non-point source pollution in Jiangsu Province, China[J]. Journal of Environmental Management, 2018, 207:134-140 http://www.wanfangdata.com.cn/details/detail.do?_type=perio&id=cd98c018d7485a755b886d84fad384be |
| [19] | 刘钦普.国内农田氮磷面源污染风险控制研究进展[J].江苏农业科学, 2018, 46(1):1-5 http://d.old.wanfangdata.com.cn/Periodical/jsnykx201801001 LIU Q P. Research progress of environmental risk control of N and P non-point source pollution in domestic farmland[J]. Jiangsu Agricultural Sciences, 2018, 46(1):1-5 http://d.old.wanfangdata.com.cn/Periodical/jsnykx201801001 |
| [20] | 王丹, 王延华, 杨浩, 等.太湖流域农田生产-畜禽养殖系统氮素流动特征[J].环境科学研究, 2016, 29(3):457-464 http://d.old.wanfangdata.com.cn/Periodical/hjkxyj201603019 WANG D, WANG Y H, YANG H, et al. Nitrogen flow features of crop-livestock breeding system in Taihu Lake Basin[J]. Research of Environmental Science, 2016, 29(3):457-464 http://d.old.wanfangdata.com.cn/Periodical/hjkxyj201603019 |
| [21] | 程磊磊, 尹昌斌, 胡万里, 等.云南省洱海北部地区农田面源污染现状及控制的补偿政策[J].农业现代化研究, 2010, 31(4):471-474 doi: 10.3969/j.issn.1000-0275.2010.04.020 CHENG L L, YIN C B, HU W L, et al. Subsidy policy for agricultural nonpoint pollution control in northern area of Erhai Lake of Yunnan Province[J]. Research of Agricultural Modernization, 2010, 31(4):471-474 doi: 10.3969/j.issn.1000-0275.2010.04.020 |
| [22] | 耿飙, 罗良国.农户减少化肥用量和采用有机肥的意愿研究——基于洱海流域上游面源污染防控的视角[J].中国农业资源与区划, 2018, 39(4):74-82 http://www.wanfangdata.com.cn/details/detail.do?_type=perio&id=zgnyzyyqh201804011 GENG B, LUO L G. farmers' willingness to reduce fertilizer input and adopt organic fertilizer-Based on the perspective of non-point source pollution prevention and control in the upper reaches of Erhai watershed[J]. Chinese Journal of Agricultural Resources and Regional Planning, 2018, 39(4):74-82 http://www.wanfangdata.com.cn/details/detail.do?_type=perio&id=zgnyzyyqh201804011 |
| [23] | 林施泉, 邵晓阳, 姜丹, 等.福建省木兰溪流域浮游植物群落结构特征[J].湿地科学, 2013, 11(1):48-53 http://www.wanfangdata.com.cn/details/detail.do?_type=perio&id=shidkx201301008 LIN S Q, SHAO X Y, JIANG D, et al. Community structure characteristics of phytoplankton in Drainage area of Mulan River, Fujian Province[J]. Wetland Science, 2013, 11(1):48-53 http://www.wanfangdata.com.cn/details/detail.do?_type=perio&id=shidkx201301008 |
| [24] | 徐福祥.基于GIS技术的福建省耕地土壤酸化研究[D].福州: 福建农林大学, 2015 XU F X. Study on the acidification of cropland soil in Fujian by GIS technology[D]. Fuzhou: Fujian Agriculture and Forestry University, 2015 |
| [25] | 张瑜.基于平衡施肥的福建省耕地化肥资源优化配置研究[D].福州: 福建农林大学, 2015 ZHANG Y. Study on the fertilizer resources optimal allocation of Fujian Province cultivated land based on the balanced fertilization[D]. Fuzhou: Fujian Agriculture and Forestry University, 2015 |
| [26] | 杨洪春.福建统计年鉴[M].北京:中国统计出版社, 2017 YANG H C. Statistical Yearbook of Fujian Province[M]. Beijing:China Statistics Press, 2017 |
| [27] | 漳州市统计局.漳州市统计年鉴[M].北京:中国统计出版社, 2017 Zhangzhou Bureau of Statistics. Statistical Yearbook of Zhangzhou City[M]. Beijing:China Statistics Press, 2017 |
| [28] | 宋太平, 左强, 刘本生, 等.农业面源污染中氮排放时空变化及其健康风险评价研究——以淮河流域为例[J].农业环境科学学报, 2018, 37(6):1219-1231 http://www.wanfangdata.com.cn/details/detail.do?_type=perio&id=nyhjbh201806023 SONG T P, ZUO Q, LIU B S, et al. Estimation of spatio-temporal variability and health risks of nitrogen emissions from agricultural non-point source pollution:A case study of the Huaihe River Basin, China[J]. Journal of Agro-Environment Science, 2018, 37(6):1219-1231 http://www.wanfangdata.com.cn/details/detail.do?_type=perio&id=nyhjbh201806023 |
