曹凑贵,
马建勇,
李成芳,
蔡明历,
汪金平,
孙自川,
江洋,
华中农业大学植物科学技术学院 武汉 430070
基金项目: 国家重点研发计划专项2017YFD0301400
详细信息
作者简介:邹凤亮, 主要研究方向为稻田温室气体排放。E-mail:1359793413@qq.com
通讯作者:江洋, 主要研究方向为稻田生态。E-mail:jiangyang@mail.hzau.edu.cn
中图分类号:X511计量
文章访问数:971
HTML全文浏览量:0
PDF下载量:1136
被引次数:0
出版历程
收稿日期:2018-07-05
录用日期:2018-07-20
刊出日期:2018-09-01
Greenhouse gases emission under different cropping systems in the Jianghan Plain based on DNDC model
ZOU Fengliang,CAO Cougui,
MA Jianyong,
LI Chengfang,
CAI Mingli,
WANG Jinping,
SUN Zichuan,
JIANG Yang,
College of Plant Science and Technology, Huazhong Agricultural University, Wuhan 430070, China
Funds: the National Key Research and Development Project of China2017YFD0301400
More Information
Corresponding author:JIANG Yang, E-mail:jiangyang@mail.hzau.edu.cn
摘要
HTML全文
图
参考文献
相关文章
施引文献
资源附件
访问统计
摘要
摘要:稻田被认为是温室气体CH4和N2O的主要排放源之一。湖北省江汉平原地区水稻常年种植面积约8×10⁵ hm2,占湖北省水稻种植面积的40%左右。研究江汉平原地区稻田温室气体排放特征,对于评估区域稻田温室气体排放以及稻田温室气体减排具有重要意义。目前,DNDC模型已被广泛应用于模拟和估算田间尺度的温室气体排放,DNDC模型与地理信息系统(ArcGIS)结合,可进行区域尺度的温室气体排放模拟与估算。本研究以湖北省典型稻作区江汉平原为研究区域,运用DNDC模型模拟和估算江汉平原稻田区域尺度的温室气体排放。设置大田定点观测试验,监测中稻-小麦(RW)、中稻-油菜(RR)、中稻-冬闲(RF)3种种植模式下稻田温室气体CH4和N2O的周年排放特征。通过田间观测值与DNDC模拟值的比较进行模型验证,并利用获取DNDC模型所需的气象、土壤、作物及田间管理等区域数据,模拟江汉平原稻田不同种植模式下温室气体CH4和N2O的排放量。田间试验表明,江汉平原稻田RW、RR和RF模型的CH4排放通量为-2.80~39.78 mg·m-2·h-1、-1.74~42.51 mg·m-2·h-1和-1.57~55.64 mg·m-2·h-1,N2O周年排放通量范围分别为0~1.90 mg·m-2·h-1、0~1.76 mg·m-2·h-1和0~1.49 mg·m-2·h-1;CH4排放量RW和RR模式显著高于RF模式,N2O排放量为RF显著低于RW和RR模式。模型验证结果表明,不同种植模式温室气体排放实测值与模拟值比较的决定系数(R2)为0.85~0.98,相对误差绝对值(RAE)为8.29%~16.42%。根据DNDC模型模拟和估算的结果,江汉平原区域稻田CH4周年的排放量为0.292 9 Tg C,N2O周年的排放量为0.009 2 Tg N,不同种植模式稻田CH4排放量表现为RW > RR > RF,N2O排放量表现为RW > RF > RR,增温潜势(GWP)表现为RW > RR > RF。不同地区稻田CH4排放量表现为监利县>荆门市>公安县>天门市>仙桃市>洪湖市>松滋市>汉川市>潜江市>石首市>荆州市>江陵县>赤壁市>嘉鱼县,N2O排放量表现为监利县>荆门市>公安县>洪湖市>仙桃市>天门市>汉川市>潜江市>松滋市>荆州市>江陵县>赤壁市>石首市>嘉鱼县。本研究结果表明DNDC模型能较好地应用于模拟江汉平原稻田温室气体排放,RR和RF模式相比RW模式可有效减少温室气体CH4和N2O的排放。
关键词:稻田/
种植模式/
甲烷/
氧化亚氮/
DNDC模型/
增温潜势
Abstract:Increased greenhouse gases emission contributes to global warming. Paddy field is considered to be one of the main sources of greenhouse gas CH4 and N2O emissions. The rice planting area in the Jianghan Plain is about 8×10⁵ hm2, accounting for about 40% of the total rice planting area in Hubei Province. Studies on characteristics of greenhouse gases emission in the Jianghan Plain are important for evaluation and reduction of regional greenhouse gases emission. So far, several models, such as DNDC model, have been used for simulating the greenhouse gases emission, which in conjunction with ArcGIS may be used for simulating the regional greenhouse gas emission. In this study, we used DNDC model to simulate the greenhouse gases emission in the Jianghan Plain. The field experiment was carried out for investigating the characteristics of CH4 and N2O emissions under rice-wheat (RW), rice-rape (RR) and rice-fallow (RF) cropping systems. Meteorologic, soil, crop and field management data were obtained for DNDC-stimulating CH4 and N2O emissions under different cropping systems in the Jianghan Plain. The results of field experiment showed that the CH4 fluxes were from -2.80 mg·m-2·h-1 to 55.64 mg·m-2·h-1, and the N2O fluxes were from 0 to 1.90 mg·m-2·h-1 in the Jianghan Plain. CH4 emission was mainly concentrated in rice season, and the peaks occurred at rice heading and tillering stages. N2O emission in rice season was higher than in non-rice season. And the peaks occurred after wheat or rape sowing in non-rice season and during field drying period in rice season. CH4 emission under RW and RR systems were significantly higher than that under RF system, while N2O emission was significantly higher under RF system than under RW and RR systems. The DNDC model stimulating results were verified by comparing the observed values with the stimulated values. The R2 and RAE between the observed and the stimulated values under different cropping systems were form 0.85 to 0.98 and from 8.29% to 16.42%, respectively. The high R2 and the low RAE suggested that the stimulated values of CH4 and N2O emissions with DNDC model were in good agreement with the observed values. According to the simulation results, the annual emissions of CH4 and N2O were 0.292 9 Tg C and 0.009 2 Tg N in the Jianghan Plain from 2010 to 2016, respectively. For different crop systems, CH4 and N2O emissions were presented as RW > RR > RF and RW > RF > RR, respectively, and the global warming potential (GWP) was RW > RR > RF. The CH4 and N2O emissions were also different for different regions. The annual average CH4 emission from 2010 to 2016 was in the order of Jianli > Jingmen > Gong'an > Tianmen > Xiantao > Honghu > Songzi > Hanchuan > Qianjiang > Shishou > Jingzhou > Jiangling > Chibi > Jiayu. And the annual average N2O emission from 2010 to 2016 was in the order of Jianli > Jingmen > Gong'an > Honghu > Xiantao > Tianmen > Hanchuan > Qianjiang > Songzi > Jingzhou > Jiangling > Chibi > Shishou > Jiayu. The results of our study indicated that the DNDC model could preferably stimulate the greenhouse gases emissions in the Jianghan Plain. And RR and RF could reduce CH4 and N2O emissions compared with RW.
Key words:Rice field/
Cropping system/
CH4/
N2O/
DNDC model/
Global warming potential
HTML全文
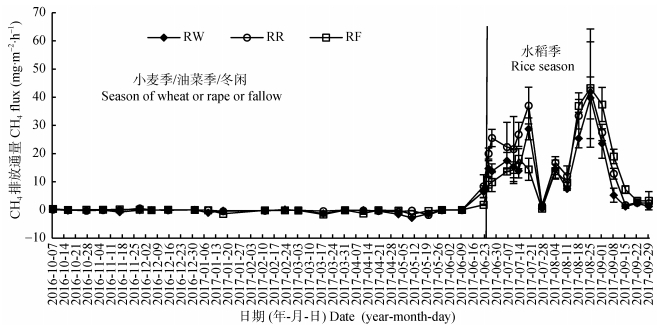
图1不同种植模式下水稻田CH4排放通量的季节性变化
RW:水稻-小麦模式; RR:水稻-油菜模式; RF:水稻-冬闲模式。
Figure1.Seasonal changes in CH4 fluxes of paddy fields under different cropping systems
RW: rice-wheat cropping system; RR: rice-rape cropping system; RF: rice-fallow cropping system.
 下载: 全尺寸图片幻灯片
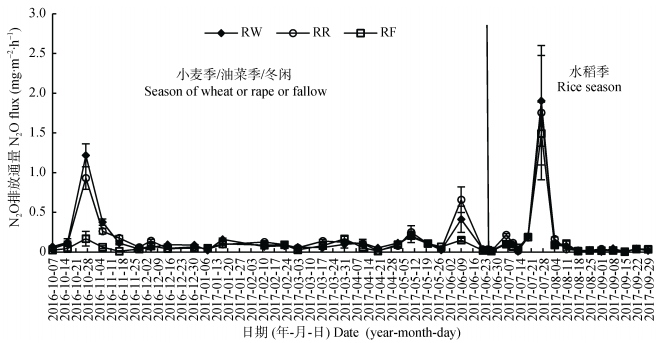
图2不同种植模式下水稻田N2O排放通量的季节性变化
RW:水稻-小麦模式; RR:水稻-油菜模式; RF:水稻-冬闲模式。
Figure2.Seasonal changes in N2O fluxes of paddy fields under different cropping systems
RW: rice-wheat cropping system; RR: rice-rape cropping system; RF: rice-fallow cropping system.
下载: 全尺寸图片幻灯片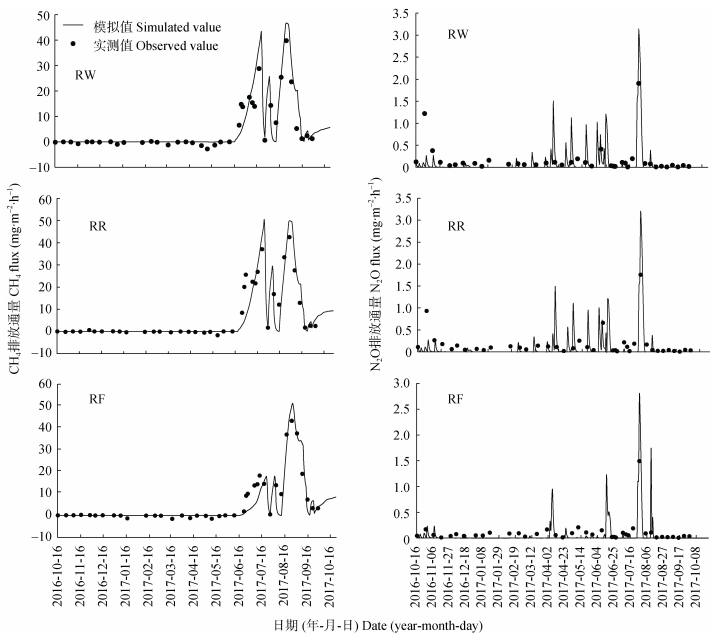
图3不同种植模式稻田CH4和N2O实测值与DNDC模型模拟值的比较
RW:水稻-小麦模式; RR:水稻-油菜模式; RF:水稻-冬闲模式。
Figure3.Comparison of DNDC simulated and observed CH4 and N2O fluxes of paddy fields under different cropping systems
RW: rice-wheat cropping system; RR: rice-rape cropping system; RF: rice-fallow cropping system.
下载: 全尺寸图片幻灯片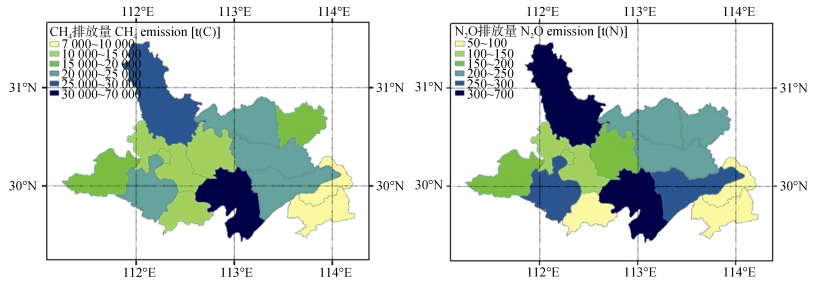
图42010—2016年江汉平原稻田温室气体排放量区域分布图
Figure4.Distribution of greenhouse gases emissions in paddy fields of the Jianghan Plain
下载: 全尺寸图片幻灯片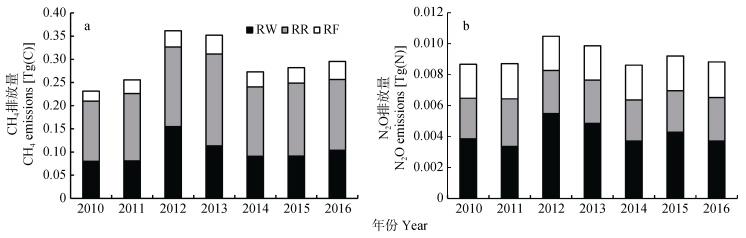
图5江汉平原不同种植模式下稻田CH4(a)和N2O(b)年均排放总量
RW:水稻-小麦模式; RR:水稻-油菜模式; RF:水稻-冬闲模式。
Figure5.Annual total CH4 (a) and N2O (b) emissions of paddy fields under different cropping systems in the Jianghan Plain
RW: rice-wheat cropping system; RR: rice-rape cropping system; RF: rice-fallow cropping system.
下载: 全尺寸图片幻灯片表1江汉平原各地区土壤属性表
Table1.Soil properties of various areas in the Jianghan Plain
| 地区 Region | 有机质含量 Organic matter content (g·kg-1) | 黏粒含量 Clay content (%) | pH | 容重 Bulk density (g·cm-3) |
| 荆门市Jingmen | 10.2 | 22 | 7.2 | 1.38 |
| 汉川市Hanchuan | 8.9 | 20 | 7.7 | 1.39 |
| 荆州市Jingzhou | 8.8 | 20 | 7.5 | 1.38 |
| 公安县Gong’an | 9.4 | 20 | 7.7 | 1.39 |
| 监利县Jianli | 9.3 | 22 | 7.7 | 1.38 |
| 江陵县Jiangling | 9.7 | 20 | 7.7 | 1.40 |
| 石首市Shishou | 9.3 | 20 | 7.8 | 1.40 |
| 洪湖市Honghu | 9.4 | 21 | 7.4 | 1.38 |
| 松滋市Songzi | 9.2 | 25 | 6.8 | 1.35 |
| 嘉鱼县Jiayu | 9.1 | 22 | 6.9 | 1.36 |
| 赤壁市Chibi | 11.6 | 29 | 6.2 | 1.33 |
| 仙桃市Xiantao | 9.1 | 21 | 7.7 | 1.39 |
| 潜江市Qianjiang | 8.9 | 21 | 7.7 | 1.39 |
| 天门市Tianmen | 8.2 | 18 | 7.7 | 1.38 |
| 表中所列数值为相应地区的平均值。The values in the table are the averages of the region. | ||||
下载: 导出CSV表22010—2016年江汉平原不同种植模式下不同地区稻田年均温室气体排放量和增温潜势
Table2.Annual emissions of greenhouse gases and GWP of paddy fields in different regions under different cropping systems in the Jianghan Plain from 2010 to 2016
| 地区Region | CH4排放量CH4 emission [kg(C)?hm-2] | N2O排放量N2O emission [kg(N)?hm-2] | GWP [t(CO2 eq)?hm-2] | ||||||||
| RW | RR | RF | RW | RR | RF | RW | RR | RF | |||
| 荆门市Jingmen | 315.5 | 307.4 | 281.4 | 9.70 | 2.56 | 3.05 | 16.71 | 13.38 | 12.54 | ||
| 汉川市Hanchuan | 398.3 | 392.6 | 348.5 | 7.58 | 1.77 | 2.35 | 19.12 | 16.45 | 14.93 | ||
| 荆州市Jingzhou | 374.0 | 362.5 | 325.8 | 7.48 | 1.62 | 2.21 | 18.11 | 15.18 | 13.97 | ||
| 公安县Gong’an | 382.6 | 375.7 | 338.1 | 8.24 | 1.77 | 2.37 | 18.78 | 15.77 | 14.52 | ||
| 监利县Jianli | 399.0 | 396.0 | 353.0 | 9.07 | 1.68 | 2.22 | 19.78 | 16.55 | 15.06 | ||
| 江陵县Jiangling | 376.6 | 366.5 | 330.1 | 8.12 | 1.65 | 2.27 | 18.48 | 15.35 | 14.16 | ||
| 石首市Shishou | 389.6 | 386.5 | 344.2 | 8.44 | 1.70 | 2.20 | 19.14 | 16.18 | 14.69 | ||
| 洪湖市Honghu | 387.5 | 384.9 | 341.2 | 8.03 | 1.81 | 2.26 | 18.88 | 16.16 | 14.60 | ||
| 松滋市Songzi | 381.9 | 374.1 | 339.6 | 7.75 | 1.94 | 2.52 | 18.54 | 15.78 | 14.65 | ||
| 嘉鱼县Jiayu | 380.8 | 379.5 | 336.9 | 9.47 | 2.09 | 2.45 | 19.22 | 16.06 | 14.51 | ||
| 赤壁市Chibi | 287.8 | 289.1 | 249.2 | 7.05 | 2.51 | 3.40 | 14.48 | 12.62 | 11.40 | ||
| 仙桃市Xiantao | 382.6 | 376.9 | 336.7 | 7.57 | 1.64 | 2.13 | 18.49 | 15.76 | 14.37 | ||
| 潜江市Qianjiang | 382.4 | 375.2 | 335.6 | 8.18 | 1.69 | 2.32 | 18.74 | 15.72 | 14.40 | ||
| 天门市Tianmen | 413.8 | 402.7 | 368.7 | 6.83 | 0.89 | 0.94 | 19.43 | 16.48 | 15.15 | ||
| RW:水稻-小麦模式; RR:水稻-油菜模式; RF:水稻-冬闲模式。RW: rice-wheat cropping system; RR: rice-rape cropping system; RF: rice-fallow cropping system. | |||||||||||
下载: 导出CSV表32010—2016年江汉平原不同地区不同种植模式稻田年均温室气体排放量
Table3.Average annual emissions of CH4 and N2O of paddy fields under different cropping systems in different regions of the Jianghan Plain from 2010 to 2016
| 地区 Region | CH4年均排放量 Annual average CH4 emission [t(C)] | N2O年均排放量 Annual average N2O emission [t(N)] | ||||||
| RW | RR | RF | RW | RR | RF | |||
| 荆门市Jingmen | 10 491 | 16 907 | — | 325 | 141 | — | ||
| 汉川市Hanchuan | 10 371 | 5 715 | — | 196 | 26 | — | ||
| 荆州市Jingzhou | 5 907 | 5 661 | — | 117 | 25 | — | ||
| 公安县Gong’an | 9 088 | 14 170 | 1 486 | 195 | 66 | 10 | ||
| 监利县Jianli | 15 734 | 29 933 | 20 209 | 365 | 127 | 127 | ||
| 江陵县Jiangling | 4 570 | 6 633 | — | 98 | 30 | — | ||
| 石首市Shishou | 1 415 | 10 824 | 538 | 31 | 47 | 4 | ||
| 洪湖市Honghu | 9 155 | 11 688 | 1 766 | 189 | 55 | 11 | ||
| 松滋市Songzi | 4 951 | 11 776 | — | 100 | 61 | — | ||
| 嘉鱼县Jiayu | 1 709 | 2 416 | 3 117 | 43 | 13 | 23 | ||
| 赤壁市Chibi | 149 | 5 001 | 3 841 | 4 | 43 | 53 | ||
| 仙桃市Xiantao | 8 097 | 15 642 | — | 163 | 68 | — | ||
| 潜江市Qianjiang | 6 489 | 7 006 | — | 139 | 31 | — | ||
| 天门市Tianmen | 11 975 | 12 455 | — | 198 | 27 | — | ||
| RW:水稻-小麦模式; RR:水稻-油菜模式; RF:水稻-冬闲模式。RF模式在“—”相应的区域面积很小, 忽略不计。RW: rice-wheat cropping system; RR: rice-rape cropping system; RF: rice-fallow cropping system. Areas of RF systems in the regions marked with — is very small, the greenhouse gases emissions are negligible. | ||||||||
下载: 导出CSV参考文献
| [1] | US Environmental Protection Agency. Global anthropogenic non-CO2 greenhouse gas emissions:1990-2030[M]. Washington, U. S.:Environmental Protection Agency Press, 2012:56-57 |
| [2] | 邵美红, 孙加焱, 阮关海.稻田温室气体排放与减排研究综述[J].浙江农业学报, 2011, 23(1):181-187 doi: 10.3969/j.issn.1004-1524.2011.01.037 SHAO M H, SUN J Y, RUAN G H. Review on greenhouse gases emission and the reduction technology in rice fields[J]. Acta Agriculturae Zhejiangensis, 2011, 23(1):181-187 doi: 10.3969/j.issn.1004-1524.2011.01.037 |
| [3] | 朱德峰, 程式华, 张玉屏, 等.全球水稻生产现状与制约因素分析[J].中国农业科学, 2010, 43(3):474-479 doi: 10.3864/j.issn.0578-1752.2010.03.005 ZHU D F, CHENG S H, ZHANG Y P, et al. Analysis of status and constraints of rice production in the world[J]. Scientia Agricultura Sinica, 2010, 43(3):474-479 doi: 10.3864/j.issn.0578-1752.2010.03.005 |
| [4] | 中稻宣. 2015年全国及各省(市、区)粮食及水稻播种面积和产量[J].中国稻米, 2017, 23(6):110 http://d.old.wanfangdata.com.cn/Periodical/zgdm201706027 Zhong Dao Xuan. Cereals and rice sowing area and yield in different regions of China in 2015[J]. China Rice, 2017, 23(6):110 http://d.old.wanfangdata.com.cn/Periodical/zgdm201706027 |
| [5] | 陈柏槐.湖北省优质水稻现状与发展思路[J].中国稻米, 2004, 10(5):12-15 doi: 10.3969/j.issn.1006-8082.2004.05.004 CHEN B H. Status and development of high-quality rice in Hubei Province[J]. China Rice, 2004, 10(5):12-15 doi: 10.3969/j.issn.1006-8082.2004.05.004 |
| [6] | 谢海宽, 江雨倩, 李虎, 等. DNDC模型在中国的改进及其应用进展[J].应用生态学报, 2017, 28(8):2760-2770 http://d.old.wanfangdata.com.cn/Periodical/yystxb201708041 XIE H K, JIANG Y Q, LI H, et al. Modification and application of the DNDC model in China[J]. Chinese Journal of Applied Ecology, 2017, 28(8):2760-2770 http://d.old.wanfangdata.com.cn/Periodical/yystxb201708041 |
| [7] | ZHANG Y, NIU H. The development of the DNDC plant growth sub-model and the application of DNDC in agriculture:A review[J]. Agriculture Ecosystems & Environment, 2016, 230:271-282 http://cn.bing.com/academic/profile?id=7dddcd90204f3d0c6eb3f7097297fcb3&encoded=0&v=paper_preview&mkt=zh-cn |
| [8] | LI H, WANG L, LI J, et al. The development of China-DNDC and review of its applications for sustaining Chinese agriculture[J]. Ecological Modelling, 2017, 348:1-13 doi: 10.1016/j.ecolmodel.2017.01.003 |
| [9] | CHENG H, YU C, LI C, et al. Modeling the impacts of water and fertilizer management on the ecosystem service of rice rotated cropping systems in China[J]. Agriculture Ecosystems & Environment, 2016, 219(2):49-57 http://cn.bing.com/academic/profile?id=192647c034ad8b0247178e9e5cf73751&encoded=0&v=paper_preview&mkt=zh-cn |
| [10] | 陆俊, 黄进良, 王立辉, 等.基于时空数据融合的江汉平原水稻种植信息提取[J].长江流域资源与环境, 2017, 26(6):874-881 doi: 10.11870/cjlyzyyhj201706010 LU J, HUANG J L, WANG L H, et al. Paddy rice planting information extraction based on spatial and temporal data fusion approach in Jianghan Plain[J]. Resources and Environment in the Yangtze Basin, 2017, 26(6):874-881 doi: 10.11870/cjlyzyyhj201706010 |
| [11] | 李成芳, 寇志奎, 张枝盛, 等.秸秆还田对免耕稻田温室气体排放及土壤有机碳固定的影响[J].农业环境科学学报, 2011, 30(11):2362-2367 http://d.old.wanfangdata.com.cn/Periodical/nyhjbh201111035 LI C F, KOU Z K, ZHANG Z S, et al. Effects of rape residue mulch on greenhouse gas emissions and carbon sequestration from no-tillage rice fields[J]. Journal of Agro-Environment Science, 2011, 30(11):2362-2367 http://d.old.wanfangdata.com.cn/Periodical/nyhjbh201111035 |
| [12] | 夏文建, 周卫, 梁国庆, 等.稻麦轮作农田氮素循环的DNDC模型分析[J].植物营养与肥料学报, 2012, 20(1):77-88 http://www.wanfangdata.com.cn/details/detail.do?_type=perio&id=QK201200109865 XIA W J, ZHOU W, LIANG G Q, et al. Evaluating the validity and sensitivity of the DNDC model to estimate nitrogen cycling in rice-wheat rotation system[J]. Plant Nutrition and Fertilizer Science, 2012, 20(1):77-88 http://www.wanfangdata.com.cn/details/detail.do?_type=perio&id=QK201200109865 |
| [13] | IPCC. Climate Change 2007[C]/The physical science basis contribution of working group Ⅰ to the fourth assessment report of the intergovernmental panel on climate change. Cambridge: Cambridge University Press, 2014: 750-752 |
| [14] | 曹卫星.作物学通论[M].北京:高等教育出版社, 2001:168-169 CAO W X. General Crop Theory[M]. Beijing:Higher Education Press, 2001:168-169 |
| [15] | 刘巽浩.耕作学[M].北京:中国农业出版社, 1994:53-55 LIU X H. Cultivation Science[M]. Beijing:China Agriculture Press, 1994:53-55 |
| [16] | YANG S S, CHANG H L. Effect of environmental conditions on methane production and emission from paddy soil[J]. Agriculture Ecosystems & Environment, 1998, 69(1):69-80 http://cn.bing.com/academic/profile?id=cc0a5c5e6c26cbc228b9769174b36d5e&encoded=0&v=paper_preview&mkt=zh-cn |
| [17] | 齐玉春, 董云社, 章申.农业微环境对土壤温室气体排放的影响[J].中国生态农业学报, 2000, 8(1):45-48 http://www.ecoagri.ac.cn/zgstny/ch/reader/view_abstract.aspx?file_no=2000113&flag=1 QI Y C, DONG Y S, ZHANG S. Influence of agricultural micro-environment factors on greenhouse gases emission from the soil[J]. Chinese Journal of Eco-Agriculture, 2000, 8(1):45-48 http://www.ecoagri.ac.cn/zgstny/ch/reader/view_abstract.aspx?file_no=2000113&flag=1 |
| [18] | ZOU J, LIU S, QIN Y, et al. Sewage irrigation increased methane and nitrous oxide emissions from rice paddies in southeast China[J]. Agriculture Ecosystems & Environment, 2009, 129(4):516-522 http://www.wanfangdata.com.cn/details/detail.do?_type=perio&id=JJ025656206 |
| [19] | 蔡祖聪, 沈光裕, 颜晓元, 等.土壤质地、温度和Eh对稻田甲烷排放的影响[J].土壤学报, 1998, 35(2):145-154 doi: 10.3321/j.issn:0564-3929.1998.02.001 CAI Z C, SHENG G Y, YAN X Y, et al. Effects of soil texture, soil temperature and Eh on methane emissions from rice paddy fields[J]. Acta Pedologica Sinica, 1998, 35(2):145-154 doi: 10.3321/j.issn:0564-3929.1998.02.001 |
| [20] | 田光明, 何云峰, 李勇先.水肥管理对稻田土壤甲烷和氧化亚氮排放的影响[J].生态环境学报, 2002, 11(3):294-298 doi: 10.3969/j.issn.1674-5906.2002.03.018 TIAN G M, HE Y F, LI Y X. Effect of water and fertilization management on emission of CH4 and N2O in paddy soil[J]. Ecology and Environmental Sciences, 2002, 11(3):294-298 doi: 10.3969/j.issn.1674-5906.2002.03.018 |
| [21] | LENSI R. Absorption of nitrous oxide by shoots of maize[J]. Plant & Soil, 1981, 12(3):58-67 doi: 10.1007-BF02183595/ |
| [22] | DAVIDSON E A. Nitrous oxide emission controls and inorganic nitrogen dynamics in fertilized tropical agricultural soils[J]. Soil Science Society of America Journal, 1996, 60(4):1145-1152 doi: 10.2136/sssaj1996.03615995006000040027x |
| [23] | YAO H, CONRAD R, WASSMANN R, et al. Effect of soil characteristics on sequential reduction and methane production in sixteen rice paddy soils from China, the Philippines, and Italy[J]. Biogeochemistry, 1999, 47(3):269-295 doi: 10.1007/BF00992910 |
| [24] | 张庆国, 李鹏飞, 徐丽, 等.皖中沿江平原水稻田CH4和N2O排放估算及其影响因素分析[J].土壤通报, 2012, 43(1):212-218 http://d.old.wanfangdata.com.cn/Periodical/trtb201201041 ZHANG Q G, LI P F, XU L, et al. Estimation of CH4 and N2O emissions from the paddy fields in Wanzhong-Yanjiang Plain and analysis of their influence factors[J]. Chinese Journal of Soil Science, 2012, 43(1):212-218 http://d.old.wanfangdata.com.cn/Periodical/trtb201201041 |
| [25] | 谢军飞, 李玉娥.农田土壤温室气体排放机理与影响因素研究进展[J].中国农业气象, 2002, 23(4):47-52 doi: 10.3969/j.issn.1000-6362.2002.04.013 XIE J F, LI Y E. A review of studies on mechanism of greenhouse gas (GHG) emission and its affecting factors in arable soils[J]. Chinese Journal of Agrometeorology, 2002, 23(4):47-52 doi: 10.3969/j.issn.1000-6362.2002.04.013 |
| [26] | SASS R L, FISHER F M, LEWIS S T, et al. Methane emissions from rice fields:Effect of soil properties[J]. Global Biogeochemical Cycles, 1994, 8(2):135-140 doi: 10.1029/94GB00588 |
| [27] | NEUE H U, ROGER P A. Rice Agriculture: Factors controlling emissions[R]. Berlin: Springer-Verlag, 2000 |
| [28] | 黄国宏, 韩冰.土壤含水量与N2O产生途径研究[J].应用生态学报, 1999, 10(1):53-56 doi: 10.3321/j.issn:1001-9332.1999.01.014 HUANG G H, HAN B. Relationships between soil water content and N2O production[J]. Chinese Journal of Applied Ecology, 1999, 10(1):53-56 doi: 10.3321/j.issn:1001-9332.1999.01.014 |
| [29] | 李海防, 夏汉平, 熊燕梅, 等.土壤温室气体产生与排放影响因素研究进展[J].生态环境, 2007, 16(6):1781-1788 doi: 10.3969/j.issn.1674-5906.2007.06.039 LI H F, XIA H P, XIONG Y M, et al. Mechanism of greenhouse gases fluxes from soil and its controlling factors:A review[J]. Ecology and Environment, 2007, 16(6):1781-1788 doi: 10.3969/j.issn.1674-5906.2007.06.039 |
| [30] | 胡安永, 孙星, 刘勤.太湖地区不同轮作模式对稻田温室气体(CH4和N2O)排放的影响[J].应用生态学报, 2016, 27(1):99-106 http://d.old.wanfangdata.com.cn/Periodical/yystxb201601013 HU A Y, SUN X, LIU Q. Effects of different rotation systems on greenhouse gases (CH4 and N2O) emissions in the Taihu Lake Region, China[J]. Chinese Journal of Applied Ecology, 2016, 27(1):99-106 http://d.old.wanfangdata.com.cn/Periodical/yystxb201601013 |
| [31] | 申源源, 陈宏.秸秆还田对土壤改良的研究进展[J].中国农学通报, 2009, 25(19):291-294 http://d.old.wanfangdata.com.cn/Periodical/zgnxtb200919068 SHEN Y Y, CHEN H. Effect of straw returning on soil improvement and crop growth:Research progress[J]. Chinese Agricultural Science Bulletin, 2009, 25(19):291-294 http://d.old.wanfangdata.com.cn/Periodical/zgnxtb200919068 |
| [32] | 李长生, 肖向明, Frolking S, 等.中国农田的温室气体排放[J].第四纪研究, 2003, 23(5):493-503 doi: 10.3321/j.issn:1001-7410.2003.05.004 LI C S, XIAO X M, FROLKING S, et al. Greenhouse gas emissions from croplands of China[J]. Quaternary Sciences, 2003, 23(5):493-503 doi: 10.3321/j.issn:1001-7410.2003.05.004 |
| [33] | 吴兑.温室气体与温室效应[M].北京:气象出版社, 2003:231-233 WU D. Greenhouse Gases and Greenhouse Effects[M]. Beijing:China Meteorological Press, 2003:231-233 |
| [34] | 王平. 基于模型和GIS技术估算1955-2005年中国稻田甲烷排放[D]. 南京: 南京农业大学, 2009: 58-62 WANG P. Estimates of CH4 emission from Chinese rice fields during 1955-2005 based on model and GIS technology[D]. Nanjing: Nanjing Agricultural University, 2009: 58-62 |
| [35] | 杨俊. 长江中下游地区农田生态系统N2O排放[D]. 重庆: 西南大学, 2009: 32-33 YANG J. N2O emission from agricultural ecosystem in middle-lower reaches of the Yangtze River Region[D]. Chongqing: Southwest University, 2009: 32-33 |
