 ,1,*
,1,*Responses of green-up dates of grasslands in China and woody plants in Europe to air temperature and precipitation: Empirical evidences based on survival analysis
ZHOU Tong1, CAO Ru-Yin2, WANG Shao-Peng1, CHEN Jin3, TANG Yan-Hong,1,*通讯作者: tangyh@pku.edu.cn
编委: 陈吉泉
责任编辑: 王葳
收稿日期:2017-11-21修回日期:2018-02-11网络出版日期:2018-05-20
| 基金资助: |
Received:2017-11-21Revised:2018-02-11Online:2018-05-20
| Fund supported: |

摘要
长期以来, 气候与植物物候关系的研究大多基于线性模型, 但植被物候对气候变化的响应可能是非线性的。该文利用非线性模型——生存分析模型来分析时间序列中过去事件(气候因子)对目的变量(物候)的作用: 用生存分析模型分析了春季气温和降水量对内蒙古草地、青藏高原草甸和欧洲地区木本植物返青期的影响。其中, 内蒙古与青藏高原的物候信息来自遥感数据, 欧洲地区物候信息为实测数据。蒙特卡洛方法用于拟合模型参数。结果表明: 生存分析模型适合对上述不同研究对象的物候影响因素进行分析, 并能模拟非线性效应; 在内蒙古草地, 春季气温和降水对春季返青有很大的影响, 而青藏高原草甸和欧洲地区木本植物返青期对春季降水响应较小, 对春季气温变化的响应随Holdridge干燥度指数上升而下降; 在预测返青期时发现: 春季平均气温提高1 ℃会导致上述地区返青期提前1-6天; 而春季气温与降水的增加会导致返青期发生明显的非线性变化, 这种非线性效应无法基于线性模型模拟出来。结果说明生存分析模型既能用于分析不同尺度下植物物候与气候的关系, 也能用于模型预测, 尤其适合探讨大幅度气候变化对物候的非线性影响。
关键词:
Abstract
Keywords:
PDF (4677KB)元数据多维度评价相关文章导出EndNote|Ris|Bibtex收藏本文
本文引用格式
周彤, 曹入尹, 王少鹏, 陈晋, 唐艳鸿. 中国草地和欧洲木本植物返青期对气温和降水变化的响应: 基于生存分析的研究. 植物生态学报[J], 2018, 42(5): 526-538 DOI:10.17521/cjpe.2017.0305
ZHOU Tong, CAO Ru-Yin, WANG Shao-Peng, CHEN Jin, TANG Yan-Hong.
近100多年来, 气候变暖已对全球生态系统产生了巨大影响, 成为当前学科研究和社会舆论共同关注的热点问题。近年的研究结果表明, 植物物候与气候变暖有非常密切的关系, 许多研究探讨了各种气候要素对植物物候的影响, 如: 有研究发现, 欧洲植物的返青期受12月到2月平均气温的影响, 气温每上升1 ℃, 返青期就会提前3天左右(Jochner et al., 2016); 而温带和寒带森林返青期的年际波动与趋势则受可利用水分的影响(Forkel et al., 2015); 亚马孙植物物候周期则由辐射和降水共同控制(Bradley et al., 2011)。
但是, 这些物候影响因素分析普遍存在两个问题。首先, 分析通常基于线性模型, 如简单偏相关分析(Shen et al., 2015a)或偏最小二乘等(Yu et al., 2010), 这两种方法忽略了一个事实: 植物物候与气候因素之间并不一定满足线性假设, 如有研究表明青藏高原植物对升温与对降温的响应不一样(Wang et al., 2014)。其次, 线性模型对气候变量所在时间段的取值范围十分敏感, 如果数据具有非线性, 不同时间段取值范围得到的分析结果就不一样。如过去在探讨温度敏感性时, 有的研究利用季前最大相关气温期间的气温(Shen et al., 2014), 有的使用固定时间段的气温(Vitasse et al., 2013), 不同方法导致不同研究得到的“气温敏感性”之间不具有可比性。因此, 线性模型在用于植物物候与气候因素关系研究时存在很大的局限。为了更好地描述和预测物候, 非常有必要应用非线性模型(Iler et al., 2013; Sadras & Moran, 2013; Wang et al., 2014)。目前, 基于非线性模型进行物候气候因素探究的研究仍处于起步阶段。
本文尝试利用生存分析模型来探讨植物物候与气候因子的关系。生存分析模型最初用于医学研究, 是针对事件不同时效的统计学模型(Allen et al., 2014), 例如分析从病人接触治疗至出现某种结果(治愈、复发、失败或死亡等)所经历的时间, 从而了解该危险因素对疾病发病的影响(陈文和俞顺章, 1997)。类似地, 在物候研究中, 返青期前一段时间内的气温和降水会影响“返青”这一事件的发生。生存分析模型还可以考察多种气候变量在不同时段对物候的影响, 在此基础上估算出逐日的物候事件发生概率, 以精确地理解各气候因子对物候期的影响强度(Diez et al., 2014)。目前, 针对物候与气候因子之间关系的研究很少利用生存分析方法, 仅有两个尝试性研究, 分别以单一的森林植被(Xie et al., 2015)和单一物种作为研究材料(Diez et al., 2014)。因此目前针对生存分析能否有效地用于探索植物物候的尝试显然不足, 还需要从更多的角度或利用更多样的研究对象进行探讨。本文基于如下原因选择了我国草地生态系统和欧洲地区木本植物作为研究材料: 首先, 草地生态系统占全球陆地面积1/4或更多, 但还没有针对该类生态系统利用生存分析法进行物候与气候关系的研究; 其次, 相比于森林生态系统, 草地植被的物候似乎更容易受气候因素特别是降水的影响(李夏子等, 2013), 因此选用草地植被有利于考察模型的敏感程度; 而中国草原生态系统气候条件多样, 植被类型丰富, 更是考察多样条件下非线性模型的合适研究对象; 此外, 过去有很多利用线性模型对中国草原生态系统的物候研究(Shen et al., 2011, 2015b; Ding et al., 2013), 这些积累可用于比较对照。在数据选择方面, 由于目前还没有在类似气候条件下对大量的不同种类的单一物种进行生存分析的尝试, 而利用物种水平上的方法尝试和考察生存分析法的适用性又是不可或缺的, 因此我们选取广泛使用的PEP725物候数据集用于检验生存分析模型的适用性(Fu et al., 2015; Jochner et al., 2016)。
本文利用上述研究材料进行生存分析, 通过描述并预测植物物候对气候因子的响应, 以探讨生存分析模型在实例中的应用。
1 材料和方法
1.1 研究区概况
内蒙古草原和青藏高原草甸总面积广阔, 气候多样。内蒙古自治区属温带大陆性气候, 由东北向西南, 水分表现为递减趋势, 热量则为递增趋势(牛建明, 2001)。青藏高原范围更加辽阔, 海拔跨度大(100-8 846 m), 该区域气候从东南部暖湿气候转变为西北部冷干气候, 形成了独特的自然环境格局与丰富多样的植被类型(孙鸿烈等, 2012)。欧洲地区气候普遍比较湿润, 年降水量为550-1β200 mm, 年平均气温为5-12 ℃, 植被类型则以森林为主(Richard 等, 2011)。1.2 欧洲地区木本植物物候与气候数据
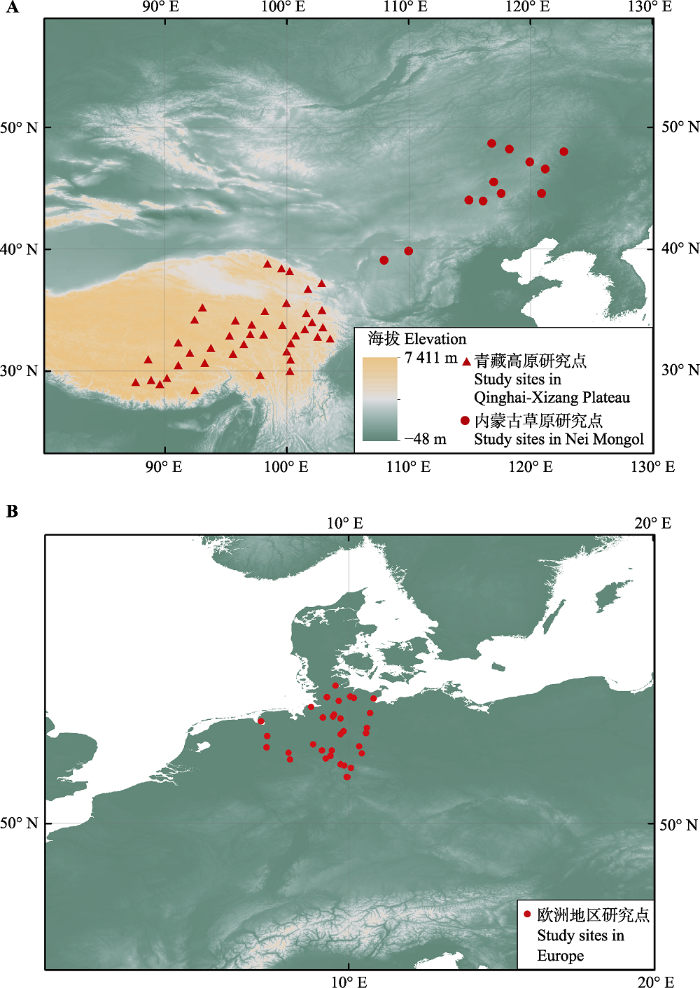
欧洲地区的物候数据取自PEP725数据集(http:// www.pep725.eu/), 选取时间为1950-2009年。根据该数据, 返青期定义为第一个叶柄出现的日期。该地区的气象数据为日均格网数据, 来自European Climate Assessment & Dataset项目中的E-OBS数据集(http://eca.knmi.nl/)。该数据集包含了1950年以来, 25°-75° N, 40° W -75° E范围内0.25° × 0.25°的日平均气温与降水量数据(Haylock et al., 2008)。我们依据PEP725实测物候站点所在的地理坐标, 程序搜索到该植株所处的格网位置, 从而获取气温与降水量数据。在挑选欧洲地区的数据点时, 我们选择了物候记录时间长度大于50年、气象数据完整、且2009年存在物候记录的107株植株(表1), 分布于德国境内的33个点(图1)。Table 1
表1
表1欧洲研究区木本植物物种
Table 1
| 属 Genus | 物种 Species | 植株数 Plant No. |
|---|---|---|
| 七叶树属 Aesculus | 欧洲七叶树 Aesculus hippocastanum | 31 |
| 桤木属 Alnus | Alnus glutinosa | 4 |
| 桦木属 Betula | 垂枝桦 Betula pendula | 19 |
| 山毛榉属 Fagus | Fagus sylvatica | 16 |
| 栎属 Quercus | 夏栎 Quercus robur | 16 |
| 梣属 Fraxinus | 欧梣 Fraxinus excelsior | 9 |
| 茶藨子属 Ribes | Ribes grossularia | 12 |
新窗口打开|下载CSV
图1
 新窗口打开|下载原图ZIP|生成PPT
图1中国与欧洲的研究点分布。 A图中三角形表示位于青藏高原的气象站点, 圆点表示位于内蒙古的气象站点。B图中圆点表示欧洲地区木本植物物候观测点。
Fig. 1Spatial distribution of study sites in China (A) and Europe (B). The triangles/dots in (A) are the distributions of meteorological stations in Qinghai-Xizang Plateau and in Nei Mongol, respectively. The points in (B) indicate the locations of phenological observation sites for woody plants in Europe.
1.3 内蒙古与青藏高原的物候与气候数据
由于全球普遍缺乏草原植物物候的长期观测数据, 本研究利用了1982-2009年的GIMMS (Global Inventory Monitoring and Modeling Studies)归一化差分植被指数(NDVI)时间序列数据反演得到草原植被的返青期。基于NOAA-AVHRR卫星观测, GIMMS生成了15天最大NDVI值合成的8 km × 8 km NDVI数据。我们首先对该数据进行了雪盖数据识别和去除(Wang et al., 2017), 由于冬季NDVI最大值应为土壤NDVI, 我们将冬季(12月至次年2月)的NDVI值统一用冬季最大值代替, 以消除融雪对返青期数据提取带来的影响。第二步采用已经在时间数据处理中广泛应用的迭代Savitzky-Golay滤波对NDVI进行了去噪处理(Chen et al., 2004)。第3步是用样条差值法得到每日NDVI值, 再利用20%阈值法求取每个地点的多年平均物候时间(White et al., 2009), 目前阈值法已经成为提取物候信息的典型方法。最后, 我们用CCSM-P方法提取了每年的物候信息, CCSM-P方法已经在内蒙古锡林郭勒盟地区得到了较好验证(Chen et al., 2016)。草原与草甸的划分则依据中国西部环境与生态科学数据中心发布的1:100万中国植被图(中国科学院中国植被图编辑委员会, 2001)。内蒙古与青藏高原的气象数据来自中国气象科学数据共享服务网, 数据来源于各省、市、自治区气候资料处理部门逐月上报的《地面气象记录月报表》的信息化资料。数据集包括1982-2009年各个气象站点的每日气温与降水量, 然后依据植被类型挑选位于内蒙古草原、青藏高原草甸地区的气象站点, 并剔除气象数据有所缺失的站点。我们采用了站点的每日气温与降水量数据用于下一步分析。最终本研究利用了内蒙古地区的12个站点以及青藏高原草甸地区41个站点的数据资料(图1)。
1.4 数据分析
为了分析返青期与季前气候变量的关系, 我们首先需要构建生存分析模型, 然后利用生存分析模型表达二者的关系。生存分析模型中包括以下几个重要概念:1)生存时间, 它指从某起点开始到被观测对象出现终点事件为止所经历的时间, 研究中为春季开始日(模型中采用3月1日)至返青期的时间, 记为T。
2)生存函数: 又称累积生存率, 记作S(t)。
S(t) = p(T > t) 其中T为生存时间, S(t)指个体生存时间(模型中为返青时间)长于t的概率。也可以表达为:
3)风险函数(Hazard function): 记作h(t), 用于测量一定年龄的个体是否容易死亡(模型中为返青)。
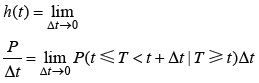
其中, P为年龄是t的个体在区间(t, t + Δt)中死亡(返青)。
4)生存函数与风险函数的关系: 生存函数可以用风险函数来表达, 个体生存时间长于t的生存函数形式为:
其中, h(u)为风险函数。
由于在我们的研究中气温与降水量每天都在发生变化, 不能用传统的生存分析模型推导出模型中的各个参数, 而是要结合蒙特卡洛方法, 通过大量抽样过程获得相应参数的拟合值(Diez et al., 2014)。由于物候过程可以利用非齐次泊松过程来模拟, 我们将物候发生的概率与返青期前气温与降水影响因子结合起来, 重新构建了生存分析中的风险函数$h(t)$。
物候事件发生过程可满足非齐次泊松过程的定义, 定义如下:
计数过程{X(t), t≥0}为具有强度函数λ(t)非齐次泊松过程, 若它满足下列条件:
(1) X(0) = 0;
(2) X(t)是独立增量过程;
(3) X(t)满足下列两式:
则为非齐次泊松过程。其中, 计数过程N(t)在(t, t + s)内(s > 0), 事件A发生的次数N(t + s) - N(t)不仅与时间差有关, 而且与时间段的起始时间有关。其中λ(t)称作强度函数。
根据非齐次泊松过程强度函数λ(t), 可得到在(0, s)内, 非齐次泊松过程平均值为:
在返青期前, 物候事件始终未发生, 那么依据非齐次泊松过程, 物候事件在(0, t)内发生0次的概率P0为
可以看到, 公式(7)中的概率P0与公式(4)中生存函数S(t)形式一致, 即在生存分析中风险函数h(t)可看作物候发生过程所满足的泊松分布中的强度函数λ(t)。
为了构建包含气温与降水因子的风险函数, 我们借鉴了随时间变化的COX比例风险模型。COX比例风险模型用于不知道生存时间的函数分布类型, 又要分析多个相关因素对生存时间的影响时, 比例风险模型的基本结构(Cox, 1972)为:
其中, ${{h}_{0}}(t)$被称为基准风险率, 即在时点t, 协变量取值全为0时的风险率, 是仅与时间t有关的任意非负函数。在本文中, 规定基准风险函数为逻辑斯蒂函数。植被物候的返青过程中, 未知的生物、非生物要素对返青概率的影响可以用逻辑斯蒂曲线来描述, 其过程呈S形: 包括指数增长时期的迅速返青, 随后逐渐增加变慢, 达到全面返青后增长速度趋于0。所以基准风险函数形式为:
式中, p1为函数的渐近线(最大值), p2为控制曲线的转折点位置, p3为量化曲线增长速度的参数。
g(t)为危险率, 在研究中采用了线性函数形式, 即:
其中, $Precip(t)$为春季每日的累计降水量, $Temp(t)$为春季每日平均气温。P为降水量的影响系数, T为气温的影响系数。我们利用OpenBUGS (v3.2.3)软件进行蒙特卡洛过程的模型构建与数值模拟。
研究中, 为了研究各生态系统可利用水的情况, 我们使用了Holdridge干燥度指数(HAI)作为考察植物可利用水的指标之一(周广胜和张新时, 1996; 孟猛等, 2004), 定义为环境温度与年降水量的比值, 即可能蒸散量与年降水量的比率, 计算公式如下:
式中, temperature为日平均气温, 时间范围为全年。日平均气温小于0 ℃的不予计算, 大于30 ℃的按30 ℃计算, P为年降水量(mm)。
2 结果
2.1 春季气温和降水对返青期的影响
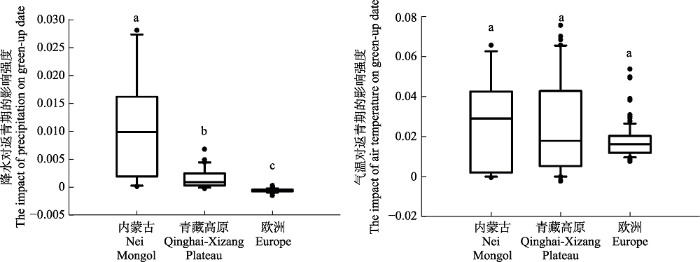
我们首先利用生存分析法考察了各个研究点中气候因子与返青期年际变化的关系。其中, P用于描述其他条件不变情况下, 春季降水对返青期的影响程度, T描述春季气温对返青期的影响程度, P和T的绝对值越高说明降水或气温的影响越大, 正值代表增加气温或降水将使返青期提前, 负值则代表会造成返青期的延后。春季降水对返青期的影响程度P的统计分布在3个地区之间存在显著差异(图2)。整体而言, 内蒙古草原的P值最高(平均值: 0.011, 标准偏差: 0.009), 青藏高原草甸次之(0.001β5 ± 0.002β0), 欧洲地区木本植物则最低(-0.000β62 ± 0.000β3), 甚至部分木本植物个体的P出现负值, 即降水增加会导致返青期的延迟。P在3个典型生态系统内的空间变异性也存在差异, 内蒙古草原的空间差异最大, 各研究点之间P的差别即标准差也最大, 青藏高原草甸内部差异相对而言较小, 而不同地理位置的欧洲树木之间的空间差异就更小。
图2
 新窗口打开|下载原图ZIP|生成PPT
图2春季降水与气温对内蒙古草原、青藏高原草甸和欧洲地区木本植物返青期的影响。每一方框的上下横线分别表示样本统计量的四分位值即75%和25%的位点, 框内中央横线是中位数, 上下端短横线分别是统计量的90%和10%的位点, 圆点表示统计分布的特异最大或最小值。
Fig. 2The changes in model coefficients of green-up date with spring precipitation and air temperature for the grasslands in Nei Mongol, meadows in Qinghai-Xizang Plateau, and woody plants in Europe. In these boxplots, the top and bottom values of the bars indicate the 25th and 75th percentiles, respectively; the black line within the box indicates the median; whiskers below and above the box indicate the 10th and 90th percentiles; and points indicate outliers. Letters on top of the whiskers are the results of an analysis of variance: different letters indicate statistically significant difference between the mean values (p < 0.01, t-test).
春季气温对返青期的影响程度T在3个生态系统之间的差异相对较小, 尤其青藏高原草甸和内蒙古草原二者很接近(内蒙古: 0.027 ± 0.022, 青藏高原: 0.026 ± 0.024), 但气温对草原生态系统返青期的影响有较大的空间异质性。在欧洲, 除了少数植株外, T值比上述草原和草甸要低得多(0.018 ± 0.008)。
一般而言, 较之湿润生态系统, 干旱生态系统的降水对返青期有更强的影响, 但是植物可利用水并不只是由降水量决定, 还受一些其他要素, 尤其是气温的影响(孟猛等, 2004)。所以, 考察降水对返青期的影响时, 有必要考虑植物可利用水而不仅仅是降水的情况。
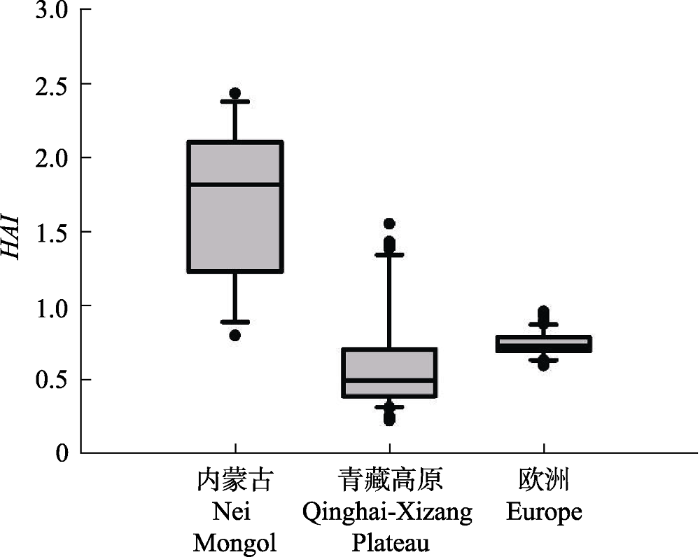
图3展示了3个生态系统HAI值的统计分布。内蒙古草原HAI值最高, 并且具有较大的空间变异性 (1.72 ± 0.26)。青藏草原草甸仅有部分数据点具有较高的HAI值(0.610 ± 0.118), 大部分区域HAI值低, 即气候较为湿润。欧洲地区的HAI值普遍较低, 并且内部变化范围较小(0.740β0 ± 0.007β5)。
图3
 新窗口打开|下载原图ZIP|生成PPT
图3内蒙古草原、青藏高原草甸和欧洲地区木本植物的Holdridge干燥度指数(HAI)的分布统计特征。统计变量的说明参见
Fig. 3Boxplots of the Holdridge aridity index (HAI) for the grasslands of Nei Mongol, meadows in Qinghai-Xizang Plateau, and woody plants in Europe. See
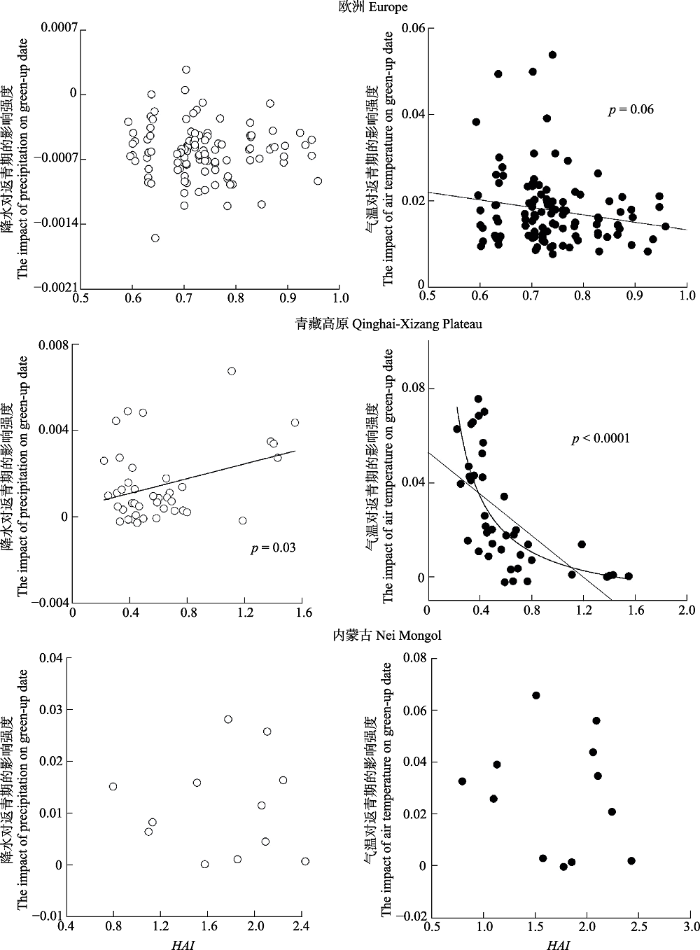
为探讨不同干燥条件下降水和气温影响返青期的情况, 我们考察了降水和温度对返青期的影响因子(P和T)与HAI值的相关关系(图4)。
图4
 新窗口打开|下载原图ZIP|生成PPT
图4内蒙古草原、青藏高原草甸和欧洲地区木本植物降水与气温对返青期的影响强度与Holdridge干燥度指数(HAI)的关系。
Fig. 4The changes in the model coefficient of precipitation and temperature with the Holdridge aridity index (HAI) for the grasslands of Nei Mongol,meadows in Qinghai-Xizang Plateau, and woody plants in Europe.
根据温度对返青期的影响因子T我们发现, 气温的影响程度与HAI值的关系更密切。随环境条件趋于干旱, 欧洲地区木本植物和青藏高原草旬的返青期对气温的响应程度都逐渐降低。但在青藏高原草甸, 达到一定干燥程度后, 气温影响随干燥度的变化逐渐平缓。通过图4可见, 在青藏高原草甸, 当HAI值高于1时, 气温对返青期的影响基本不再随降水量发生变化, 即在干旱度达到一定条件时, 气温可能对返青期基本没有影响, 此时返青期可能主要依赖降水调控。青藏高原草甸HAI > 1的站点春季(3月1日-6月1日)平均降水量为33.1 mm (所有地区春季平均降水量为(82.4 ± 43.5) mm), 因此可以推测在青藏高原草甸, 当春季降水量小于33 mm时, 返青时间将更加依赖于降水, 而气温几乎不起作用。在青藏高原草甸, 我们利用非线性模型对二者关系进行了拟合, 拟合满足p < 0.000β1, 拟合公式为:
返青期对降水的响应(P)在青藏高原草甸与HAI有较好的相关关系, 即在HAI值更高、更加干旱的研究样点, 降水对返青期影响程度也越高。
2.2 利用生存分析模型预测返青期
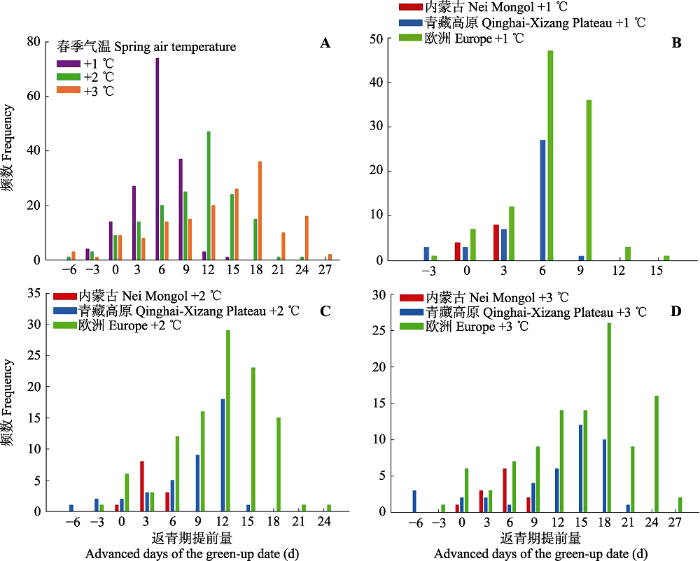
生存分析法的特点之一在于: 因变量和自变量可以是非线性关系, 因为物候与气温、降水等环境要素的关系不一定是直线的, 这种非线性特征有利于对物候变化做出更精准的预测。在2009年气候条件的基础上, 我们预测了不同升温、水分增加情景下返青期的变化。其中, 升温为在研究时间段(3月1日起至返青期)内每天平均气温均上升同样幅度, 降水增加则为研究时段第一天增加一场降水, 之后春季降水累计值均在原基础上增加同样幅度。针对气温上升的情况, 本研究利用基于生存分析法获得的返青期描述模型对假设的3种情景进行了模拟, 即升温1 ℃、2 ℃、3 ℃的情景(图5)。3种情景下, 春季气温的上升在3个生态系统的大部分空间点上都带来了返青期的提前。在同样增温幅度下, 欧洲地区木本植物返青期提前量更多(+1 ℃: 提前(5.66 ± 2.68) d; +2 ℃: 提前(10.50 ± 5.01) d; +3 ℃: 提前(14.06 ± 6.78) d)。在内蒙古草原, 3种增温情景下返青期的提前量都是最少的(+1 ℃: 提前(0.92 ± 1.08) d; +2 ℃: 提前(2.33 ± 1.92) d; +3 ℃: 提前(4.17 ± 2.69) d)。青藏高原草甸在增温情况下返青期提前量在二者之间(+1 ℃: 提前(3.56 ± 2.67) d; +2 ℃: 提前(7.29 ± 5.08) d; +3 ℃: 提前(10.88 ± 7.30) d)。
图5
 新窗口打开|下载原图ZIP|生成PPT
图5在春季气温上升的3种情境下(+1、+2、+3 ℃)所研究生态系统返青期的变化。负值为返青期延后, 正值为返青期提前。A, 升温1、2和3 ℃情况下所有研究点返青期变化量的频数。B、C、D分别为升温1、2 和3 ℃时各个生态系统返青期变化量的频数。
Fig. 5Predicted changes of green-up date under the three scenarios of elevated spring-temperature at 1, 2 and 3 °C for the target areas. Negative and positive dates indicate the delayed and advanced days of the green-up date, respectively. A, Predicted changes under all the three temperature scenarios. B, C, D, Predicted changes for each target area with the temperature increase of 1, 2 and 3 °C, respectively.
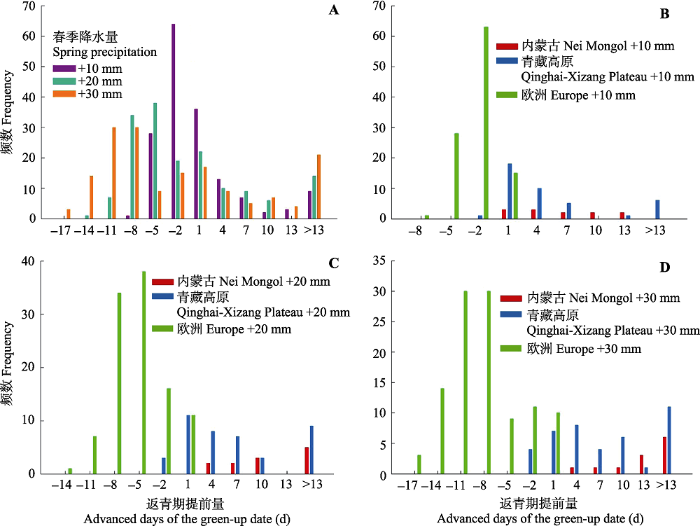
我们拟合了各个站点在研究时间内的降水量变化情况, 在3个地区均有70%以上的站点降水量在近几十年逐渐增加。对于降水增加的站点, 在内蒙古、青藏高原和欧洲地区多年降水增加量分别是(14.7 ± 9.1) mm (28年)、(26.8 ± 15.3) mm (28年)和(17.1 ± 8.7) mm (约55年)。因此, 为模拟在各个地区未来数十年内的降水变动以观测降水量变化可能带来的影响, 我们模拟了增加10、20 和30 mm春季降水情况下返青期的变化(图6)。结果显示, 在降水增加时, 大部分空间点的返青期提前了, 但也有部分空间点出现了返青期延后的现象, 这些点基本都位于欧洲。总体上, 欧洲地区木本植物返青期会因为降水增加而推迟(+10 mm: 推迟(3.59 ± 1.68) d; +20 mm: 推迟(6.55 ± 3.18) d; +30 mm: 推迟(9.26 ± 4.54) d)。而青藏和内蒙古草原都会因降水增加使返青期大幅度提前, 其中内蒙古草原返青期提前量比较均一(+10 mm: 提前(5.83 ± 4.61) d; +20 mm: 提前(11.67 ± 7.43) d; +30 mm: 提前(15.92 ± 8.43) d), 而青藏高原草甸返青期提前量差别较大(+10 mm: 提前(7.95 ± 16.14) d; +20 mm: 提前(11.63 ± 20.08) d; +30 mm: 提前(13.95 ± 21.57) d)。
图6
 新窗口打开|下载原图ZIP|生成PPT
图6在3种春季降水增加的情景下(+10、+20、+30 mm)所研究生态系统返青期的变化情况。负值表示返青期延后, 正值表示返青期提前。A, 增水10、20和30 mm情况下所有研究点返青期变化量的频数。B、C、D分别为增水10、20和30 mm时各个生态系统返青期变化量的频数。
Fig. 6Predicted changes of green-up date under the three scenarios of elevated spring-precipitation at 10, 20 and 30 mm among each target area. Negative and positive dates indicate the delayed and advanced days of the green-up date, respectively. A, Predicted changes for all the three precipitation scenarios. B, C, D, Predicted changes for each target area with the precipitation increase at 10, 20 and 30 mm, respectively.
2.3 简单线性模型与生存分析模型的比较分析
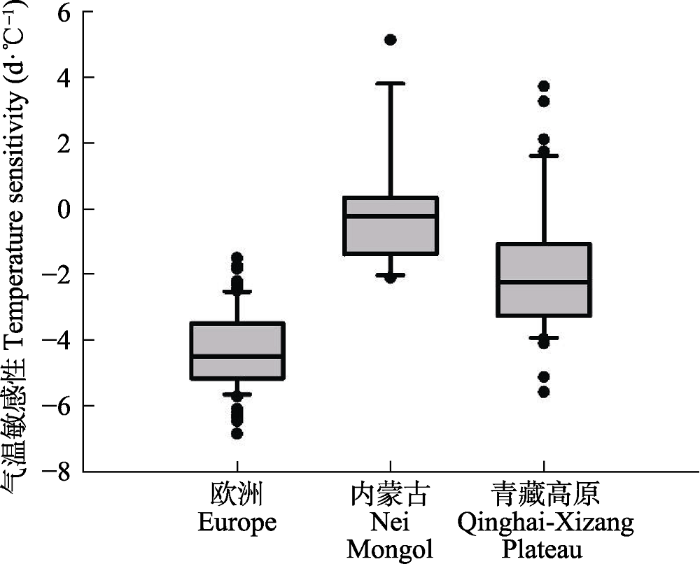
过去有很多研究指出, 在中纬度地区, 植物的春季物候主要受气温控制, 因而在探究物候与环境要素的关系时, 常常采用线性模型分析物候与气温之间的相关关系。如利用返青期与一定时间内的气温之间的线性关系求取气温敏感性。而要利用线性模型, 首先需要对气候变量进行定义。目前, 对气候变量的定义方式主要有以下两种, 以气温为例: (1)指定物候期前1-3个月作为有效气候区间, 区间内的平均气温为气温变量(Menzel et al., 2006; Vitasse et al., 2013); (2)求返青期与返青期前不同时间段内平均气温的相关性, 相关性最高的时间段内的平均气温为气温变量(Fu et al., 2015)。本研究将利用第二种方法计算气温敏感性。为计算气温敏感性, 我们首先计算了每个站点返青期前28-119天的平均气温(以7天为步长), 然后利用线性相关法求与返青期相关系数绝对值最大的一段时间, 将该时间段作为当地的季前时间段。在季前时间段内, 线性回归法中返青期与平均气温的回归系数即为气温敏感性。
与生存分析法的结果类似, 欧洲地区的气温敏感性最强((-4.40 ± 1.14) d?℃-1), 其次是青藏高原((-1.87 ± 2.12) d?℃-1), 内蒙古地区最弱((-0.13 ± 1.89) d?℃-1)。青藏高原内部也具有较大的差异, 而欧洲相对比较均一(图7)。
图7
 新窗口打开|下载原图ZIP|生成PPT
图7利用线性回归模型计算的3个地区返青期气温敏感性。统计变量的说明参见
Fig. 7Boxplots of temperature sensitivity of green-up date from linear regression models for the three cases of the study. See
与线性模型相比, 生存分析法具有非线性的特征, 即当气候变量发生变化时, 返青期并不会随之发生线性改变。由表2可见, 升温时, 线性模型计算得到的返青期提前天数会线性变化。但生存分析法中, 返青期提前量与升温幅度并不是线性的, 例如在内蒙古地区, 季前气温提高1 ℃时返青期平均提前0.92 d, 但升温2 ℃时返青期提前2.33 d, 即从提升1 ℃到提升2 ℃时, 平均返青期实际上提前了约1.41 d, 大于升温1 ℃时提前的0.92 d。
Table 2
表2
表2升温1 、2 和3 ℃下内蒙古、青藏高原和欧洲地区返青期提前天数的平均值(从3月1日起每天比2009年升温1、2和3 ℃)
Table 2
| 升温情景 Warming scenarios (℃) | 内蒙古 Nei Mongol | 青藏高原 Qinghai-Xizang Plateau | 欧洲 Europe | ||||||
|---|---|---|---|---|---|---|---|---|---|
| 生存分析法 Survival analysis | 线性回归法 Linear analysis | p | 生存分析法 Survival analysis | 线性回归法 Linear analysis | p | 生存分析法 Survival analysis | 线性回归法 Linear analysis | p | |
| + 1 | 0.92 | 0.13 | 0.04 | 3.56 | 1.87 | < 0.001 | 5.66 | 4.47 | < 0.001 |
| + 2 | 2.33 | 0.26 | 0.01 | 7.29 | 3.74 | < 0.001 | 10.5 | 8.94 | < 0.001 |
| + 3 | 4.17 | 0.39 | < 0.01 | 10.88 | 5.61 | < 0.001 | 14.06 | 13.41 | < 0.001 |
新窗口打开|下载CSV
3 讨论和结论
3.1 不同生态系统的返青期对气候因子的响应
本文利用生存分析法针对不同来源的返青期物候信息(时间序列遥感影像提取的植被物候信息、实际观测物候信息)与气候之间的关系进行了研究, 并且模拟了不同的升温和增水情境下返青期的可能变化。我们发现, 在内蒙古草原与青藏高原草甸, 降水增加都对返青期有明显的提前作用。气温对返青期的控制在欧洲地区和青藏高原草甸均比较明显, 但二者在降水变化下的响应有很大差别, 降水对欧洲地区木本植物的返青期影响较小。
尽管气温对返青期的作用在欧洲更为明显, 研究中也发现降水增加在欧洲可能会造成返青期的推迟。可能的原因是: 木本植物的根际系统相比于草本植物更深, 因而可以获得土壤深处的水分, 因而降水对欧洲地区木本植物返青期影响较小(Sarmiento & Monasterio, 1983)。另外, 降水增加推迟欧洲地区木本植物返青期可能是由于降水的间接作用。例如, 降水较少的年份可能会有更多的晴天, 因此提高了日间的辐射和日间与夜间的气温, 从而影响返青期; 此外, 晴天增加会进一步提高冠层气温, 从而提高分生组织的温度。研究表明, 返青期过程与分生组织的关系更密切(Grace et al., 1989)。因此在欧洲地区, 降水增加有可能通过间接作用导致返青期的推迟。
我们在内蒙古草原和青藏高原草甸的物候数据来自于遥感估算。遥感物候定义并不与实地观测物候完全一致, 尽管遥感物候已经广泛应用于全球物候研究中, 但遥感物候与实测物候之间的一致性还需要验证。最近在北美收集的物候观测站点的数码照片数据(https://phenocam.sr.unh.edu/webcam/)可能有助于这一问题的进一步解决。
3.2 线性模型与生存分析模型的方法比较
与线性模型相比, 生存分析法用于研究物候变化时具有以下优点。1)在2.3中我们指出, 利用线性模型进行返青期与季前气温的模拟时, 若指定有效气候区间, 则会忽略不同地区之间的差异。实际上, 位于不同气候区域的不同植被类型, 对返青期有效的季前区间存在较大的差异。相同区间的气温可能并不对所有植物都有效, 也不能反映出真实的气温敏感性。因而, 目前在线性回归模型中, 研究者通常采取与物候时间序列相关性最强的一段平均气温区间作为季前区间(Mazer et al., 2013; Fu et al., 2015)。但最近有研究指出, 季前区间的范围极有可能影响气温敏感性(Güsewell et al., 2017)。因此, 在对比不同地区的植被气温敏感性时, 不同的季前区间会导致气温敏感性计算过程中所采用的时间范围不同, 对不同时间范围内返青期对气温的响应程度在直接比较时会出现问题。
相比之下, 生存分析法则无需指定季前气温区间。在模型中由于基准风险函数的存在, 在对返青期影响较小的时间区域, 气候对返青期发生概率的影响很小。并且, 生存分析法中表达气温对返青期影响的参数(T)可以在不同地区直接进行对比, 不需要考虑存在不同时间段的问题。
2)由表1可见, 生存分析模型中, 返青期对升温情景的响应是非线性的, 并且生存分析中包含了一个逻辑斯蒂形式的基准风险函数(公式(9)), 它模拟了随时间变化的其他未知变量对返青期的影响。基准风险函数可以视为线性回归的截距, 但线性回归的截距仅为一个常数, 而逻辑斯蒂函数是刻画生物体生长和种群增长的一个经典模型(练健生和江海声, 1995)。因此本文使用的生存分析模型比线性模型具有更合理的生物学基础。
3)生存分析法的另一优点在于, 它是一个逐日的模型(Diez et al., 2014), 因而不同时间点上发生的升温和降水情况对物候的影响有所不同。在现实情况下, 返青期前不同时间段的气候变化对返青期的影响存在差异, 但在线性模型中, 由于采用的是返青期与平均气温的回归, 季前区间内每一天气温变化的效果是同质的, 这与返青期的生理学过程并不一致。尤其对春季降水而言, 距离返青期越近的降水事件对返青期的影响会更大。
生存分析法可用于进一步模拟每天气候变量对返青期的影响。比如, 相同幅度春季降水量的增加可能对应着不同情景, 如在刚进入春季时增加降水, 或在更晚的时候增加降水, 或者增加多场较弱的降水。这些情景对于线性模型是无差异的(因为总春季降水量变化相同), 但生存分析法可针对不同情形做出不同的预测。
最后需要说明的是, 与传统统计学方法不同, 利用蒙特卡洛方法模拟得到的生存分析法模型需要用方差信息准则评估模型绩效, 无法与线性回归模型常用的拟合优度检验值进行直接对比。因此, 要进一步探讨生存分析模型拟合的结果, 仍需更深入的探究。
3.3 结论
本研究结果表明, 作为一种非线性模型, 生存分析法可用于分析植物物候与气候因子的关系, 同时能很好地体现植物返青期随气温、降水的非线性变化。例如在内蒙古地区的研究点, 利用生存分析法得到升温1 ℃的情况下返青期约提前0.92 d, 而从升温1 ℃增加到升温2 ℃时, 返青期约提前1.41 d。我们发现生存分析法对于遥感反演返青期、实测返青期、格网气候数据和实测气候数据都有较好的适用性, 而且便于在不同生态系统之间进行比较。
致谢
北京大学“985工程” (2010-2020年)建设项目(7101100143)支持本研究; PEP725项目提供物候数据; EU-FP6的ENSEMBLES项目(http://ensembles-?eu.??metoffice.com)和ECA&D项目(http://www.?ecad.eu)提供相关数据, 一并致谢。参考文献 原文顺序
文献年度倒序
文中引用次数倒序
被引期刊影响因子
DOIURLPMID [本文引用: 1]

Understanding the drivers of phenological events is vital for forecasting species responses to climate change. We developed flexible Bayesian survival regression models to assess a 29-year, individual-level time series of flowering phenology from four taxa of Japanese cherry trees (Prunus spachiana, Prunus yedoensis, Prunus jamasakura, and Prunus lannesiana), from the Tama Forest Cherry Preservation Garden in Hachioji, Japan. Our modeling framework used time-varying (chill and heat units) and time-invariant (slope, aspect, and elevation) factors. We found limited differences among taxa in sensitivity to chill, but earlier flowering taxa, such as P. spachiana, were more sensitive to heat than later flowering taxa, such as P. lannesiana. Using an ensemble of three downscaled regional climate models under the A1B emissions scenario, we projected shifts in flowering timing by 2100. Projections suggest that each taxa will flower about 30 days earlier on average by 2100 with 2 6 days greater uncertainty around the species mean flowering date. Dramatic shifts in the flowering times of cherry trees may have implications for economically important cultural festivals in Japan and East Asia. The survival models used here provide a mechanistic modeling approach and are broadly applicable to any time-to-event phenological data, such as plant leafing, bird arrival time, and insect emergence. The ability to explicitly quantify uncertainty, examine phenological responses on a fine time scale, and incorporate conditions leading up to an event may provide future insight into phenologically driven changes in carbon balance and ecological mismatches of plants and pollinators in natural populations and horticultural crops.
DOIURL [本文引用: 1]
Abstract In tropical areas, Dynamic Global Vegetation Models (DGVMs) still have deficiencies in simulating the timing of vegetation phenology. To start addressing this problem, standard Fourier-based methods are applied to aerosol screened monthly remotely sensed phenology time series (Enhanced Vegetation Index, EVI) and two major driving factors of phenology: solar radiation and precipitation (for March 2000 through December 2006 over northern South America). At 1 × 1km scale using, power (or variance) spectra on good quality aerosol screened time series, annual cycles in EVI are detected across 58.24% of the study area, the strongest (largest amplitude) occurring in the savanna. Terra Firme forest have weak but significant annual cycles in comparison with savannas because of the heterogeneity of vegetation and nonsynchronous phenological events within 1 × 1km scale pixels. Significant annual cycles for radiation and precipitation account for 86% and 90% of the region, respectively, with different spatial patterns to phenology. Cross-spectral analysis was used to compare separately radiation with phenology/EVI, precipitation with phenology/EVI and radiation with precipitation. Overall the majority of the Terra Firme forest appears to have radiation as the driver of phenology (either radiation is in phase or leading phenology/EVI at the annual scale). These results are in agreement with previous research, although in Acre , central and eastern Peru and northern Bolivia there is a coexistence of ‘in phase’ precipitation over Terra Firme forest. In contrast in most areas of savanna precipitation appears to be a driver and savanna areas experiencing an inverse (antiphase) relationship between radiation and phenology is consistent with inhibited grassland growth due to soil moisture limitation. The resulting maps provide a better spatial understanding of phenology–driver relationships offering a bench mark to parameterize ecological models.
DOIURL [本文引用: 1]
Although the Normalized Difference Vegetation Index (NDVI) time-series data, derived from NOAA/AVHRR, SPOT/VEGETATION, TERRA or AQUA/MODIS, has been successfully used in research regarding global environmental change, residual noise in the NDVI time-series data, even after applying strict pre-processing, impedes further analysis and risks generating erroneous results. Based on the assumptions that NDVI time-series follow annual cycles of growth and decline of vegetation, and that clouds or poor atmospheric conditions usually depress NDVI values, we have developed in the present study a simple but robust method based on the Savitzky olay filter to smooth out noise in NDVI time-series, specifically that caused primarily by cloud contamination and atmospheric variability. Our method was developed to make data approach the upper NDVI envelope and to reflect the changes in NDVI patterns via an iteration process. From the results obtained by applying the newly developed method to a 10-day MVC SPOT VGT-S product, we provide optimized parameters for the new method and compare this technique with the BISE algorithm and Fourier-based fitting method. Our results indicate that the new method is more effective in obtaining high-quality NDVI time-series.
DOIURL [本文引用: 1]
Remote sensing is a valuable way to retrieve spatially continuous information on vegetation phenological changes, which are widely used as an indicator of climate change. We propose a simple method called weighted cross-correlogram spectral matching-phenology (CCSM-P), which combines CCSM and a weighted correlation system, for detecting vegetation phenological changes by using multiyear vegetation index (VI) time series. In experiments with simulated enhanced VI (EVI) for various scenarios, CCSM-P exhibited high accuracy and robustness to noise and the potential to capture long-term phenological change trends. For a temperate grassland in northern China, CCSM-P retrieved more reasonable vegetation spring phenology from Moderate Resolution Imaging Spectroradiometer (MODIS) EVI images than the MODIS phenology product (MCD12Q2). When validated against field phenological observations in five of the AmeriFlux Network sites in the U.S. (four deciduous broadleaf forest sites and a closed shrublands site), and a cropland site in China, CCSM-P exhibited mean absolute differences (MADs) ranging from 2 to 10 days (median: 4.2 days), whereas MAD of non-CCSM methods showed larger variations, ranging from 5 to 58 days (median: 21.3 days). This is because CCSM-P integrates field phenological observations. Compared with non-CCSM methods, which are widely used to identify phenological events, CCSM-P is more accurate and less dependent on prior knowledge (thresholds or predefined functions), which indicates its effectiveness and applicability for detecting year-to-year variations and long-term change trends in phenology, and should facilitate more reliable assessments of phenological changes in climate change studies.
[本文引用: 1]
[本文引用: 1]
DOIURL [本文引用: 1]
The analysis of censored failure times is considered. It is assumed that on each individual arc available values of one or more explanatory variables. The hazard function (age-specific failure rate) is taken to be a function of the explanatory variables and unknown regression coefficients multiplied by an arbitrary and unknown function of time. A conditional likelihood is obtained, leading to inferences about the unknown regression coefficients. Some generalizations are outlined.
DOIURLPMID [本文引用: 4]
Abstract Phenological events, such as the timing of flowering or insect emergence, are influenced by a complex combination of climatic and non-climatic factors. Although temperature is generally considered most important, other weather events such as frosts and precipitation events can also influence many species' phenology. Non-climatic variables such as photoperiod and site-specific habitat characteristics can also have important effects on phenology. Forecasting phenological shifts due to climate change requires understanding and quantifying how these multiple factors combine to affect phenology. However, current approaches to analyzing phenological data have a limited ability for quantifying multiple drivers simultaneously. Here, we use a novel statistical approach to estimate the combined effects of multiple variables, including local weather events, on the phenology of several taxa (a tree, an insect, and a fungus). We found that thermal forcing had a significant positive effect on each species, frost events delayed the phenology of the tree and butterfly, and precipitation had a positive effect on fungal fruiting. Using data from sites across latitudinal gradients, we found that these effects are remarkably consistent across sites once latitude and other site effects are accounted for. This consistency suggests an underlying biological response to these variables that is not commonly estimated using data from field observations. This approach's flexibility will be useful for forecasting ongoing phenological responses to changes in climate variability in addition to seasonal trends.
DOIURL [本文引用: 1]
Plant phenology is the most salient and sensitive indicator of terrestrial ecosystem response to climate change.Studying its change is significantly important in understanding and predicting impressively changes in terrestrial ecosystem.Based on NDVI from SPOT VGT,this paper analyzed the spatiotemporal changes in alpine grassland phenology in Qinghai-Tibetan Plateau from 1999 to 2009.The results are enumerated as follows:(1) The spatial distribution of the average alpine grassland phenology from 1999 to 2009 is closely related to water and heat conditions.Accompanying the deterioration in heat and water conditions from southeast to northwest,the start of growth season(SOG) was delayed gradually,the end of growth season(EOG) advanced slowly,and the length of growth season(LOG) shortened gradually.Elevation played an important role in the regional differentiation of phenology,but a dividing line of approximately 3500 m existed.Below this line,the phenology fluctuated irregularly with altitude change,whereas above the line,the phenology is closely related to altitude change.(2) From 1999 to 2009,SOG of the alpine grassland came earlier by six days per decade(R2=0.281,P=0.093),EOG was late by two days per decade(R2=0.031,P=0.605),and LOG lengthened by eight days per decade(R2=0.479,P=0.018).The early SOG,the late EOG,and the extended LOG mainly occurred at the center and east of the Plateau.SOG in most of the Plateau advanced significantly,especially in the eastern Plateau.(3) The inter-annual phenology changes of the alpine grassland in the Qinghai-Tibetan Plateau exhibited significant differentiation at different elevation and natural zones.The inter-annual changes at high altitude were more complicated than that at low altitude.The most significant phenology changes were found in the eastern Qinghai-Qilian montane steppe zone,and non-significant changes occurred in the Southern Tibet montane shrub-steppe zone.
DOIURLPMID [本文引用: 1]
Abstract Identifying the relative importance of climatic and other environmental controls on the interannual variability and trends in global land surface phenology and greenness is challenging. Firstly, quantifications of land surface phenology and greenness dynamics are impaired by differences between satellite data sets and phenology detection methods. Secondly, dynamic global vegetation models (DGVMs) that can be used to diagnose controls still reveal structural limitations and contrasting sensitivities to environmental drivers. Thus, we assessed the performance of a new developed phenology module within the LPJmL (Lund-Potsdam-Jena managed Lands) DGVM with a comprehensive ensemble of three satellite data sets of vegetation greenness and ten phenology detection methods, thereby thoroughly accounting for observational uncertainties. The improved and tested model allows us quantifying the relative importance of environmental controls on interannual variability and trends of land surface phenology and greenness at regional and global scales. We found that start of growing season interannual variability and trends are in addition to cold temperature mainly controlled by incoming radiation and water availability in temperate and boreal forests. Warming-induced prolongations of the growing season in high latitudes are dampened by a limited availability of light. For peak greenness, interannual variability and trends are dominantly controlled by water availability and land-use and land-cover change (LULCC) in all regions. Stronger greening trends in boreal forests of Siberia than in North America are associated with a stronger increase in water availability from melting permafrost soils. Our findings emphasize that in addition to cold temperatures, water availability is a codominant control for start of growing season and peak greenness trends at the global scale. 2015 John Wiley & Sons Ltd.
DOIURLPMID [本文引用: 3]
Abstract Earlier spring leaf unfolding is a frequently observed response of plants to climate warming. Many deciduous tree species require chilling for dormancy release, and warming-related reductions in chilling may counteract the advance of leaf unfolding in response to warming. Empirical evidence for this, however, is limited to saplings or twigs in climate-controlled chambers. Using long-term in situ observations of leaf unfolding for seven dominant European tree species at 1,245 sites, here we show that the apparent response of leaf unfolding to climate warming (ST, expressed in days advance of leaf unfolding per °C warming) has significantly decreased from 1980 to 2013 in all monitored tree species. Averaged across all species and sites, ST decreased by 40% from 4.0 ± 1.8 days °C(-1) during 1980-1994 to 2.3 ± 1.6 days °C(-1) during 1999-2013. The declining ST was also simulated by chilling-based phenology models, albeit with a weaker decline (24-30%) than observed in situ. The reduction in ST is likely to be partly attributable to reduced chilling. Nonetheless, other mechanisms may also have a role, such as 'photoperiod limitation' mechanisms that may become ultimately limiting when leaf unfolding dates occur too early in the season. Our results provide empirical evidence for a declining ST, but also suggest that the predicted strong winter warming in the future may further reduce ST and therefore result in a slowdown in the advance of tree spring phenology.
DOIURL [本文引用: 1]
DOIURLPMID [本文引用: 1]
Abstract The spring phenology of plants in temperate regions strongly responds to spring temperatures. Climate warming has caused substantial phenological advances in the past, but trends to be expected in the future are uncertain. A simple indicator is temperature sensitivity, the phenological advance statistically associated with a 1 C warmer mean temperature during the 'preseason', defined as the most temperature-sensitive period preceding the phenological event. Recent analyses of phenological records have shown a decline in temperature sensitivity of leaf unfolding, but underlying mechanisms were not clear. Here we propose that climate warming can reduce temperature sensitivity simply by reducing the length of the preseason due to faster bud development during this time period, unless the entire preseason shifts forward so that its temperature does not change. We derive these predictions theoretically from the widely used 'thermal time model' for bud development and test them using data for 19 phenological events recorded in 1970-2012 at 108 stations spanning a 1600 m altitudinal range in Switzerland. We consider how temperature sensitivity, preseason start, preseason length and preseason temperature change (1) with altitude, (2) between the periods 1970-1987 and 1995-2012, which differed mainly in spring temperatures, and (3) between two non-consecutive sets of 18 years that differed mainly in winter temperatures. On average, temperature sensitivity increased with altitude (colder climate) and was reduced in years with warmer springs, but not in years with warmer winters. These trends also varied among species. Decreasing temperature sensitivity in warmer springs was associated with a limited forward shift of preseason start, higher temperatures during the preseason and reduced preseason length, but not with reduced winter chilling. Our results imply that declining temperature sensitivity can result directly from spring warming and does not necessarily indicate altered physiological responses or stronger constraints such as reduced winter chilling. This article is protected by copyright. All rights reserved.
DOIURL [本文引用: 1]
DOIURLPMID [本文引用: 1]
Premise of the study: Plants are flowering earlier in response to climate change. However, substantial interannual variation in phenology may make it difficult to discern and compare long-term trends. In addition to providing insight on data requirements for discerning such trends, phenological shifts within subsets of long-term records will provide insight into the mechanisms driving changes in flowering over longer time scales.Methods: To examine variation in flowering shifts among temporal subsets of long-term records, we used two data sets of flowering phenology from snow-dominated habitats: subalpine meadow in Gothic, Colorado, USA (38 yr), and arctic tundra in Zackenberg, Greenland (16 yr). Shifts in flowering time were calculated as 10-yr moving averages for onset, peak, and end of flowering.Key results: Flowering advanced over the course of the entire time series at both sites. Flowering shifts at Gothic were variable, with some 10-yr time frames showing significant delays and others significant advancements. Early-flowering species were more responsive than later-flowering species, while the opposite was true at Zackenberg. Flowering shifts at Zackenberg were less variable, with advanced flowering across all 10-yr time frames. At both sites, long-term advancement seemed to be primarily driven by strong advancements in flowering in the 1990s and early 2000s.Conclusions: Analysis of long-term trends can mask substantial variation in phenological shifts through time. This variation in the direction and magnitude of phenological shifts has implications for the evolution of flowering time and for interspecific interactions with flowering plants and can provide more detailed insights into the dynamics of phenological responses to climate change.
DOIURLPMID [本文引用: 2]
Over a large temperature range, the statistical association between spring phenology and temperature is often regarded and treated as a linear function. There are suggestions that a sigmoidal relation
[本文引用: 1]
[本文引用: 1]
URL [本文引用: 1]
通过分析Logistic模型的推导过程得到了各个参数之间的关系,这些参数包括种群增长率r,环境容纳量K,密度制约系数l,常数项a,拐点时刻rm.并且进一步阐明了参数的生态学意义(定义)与统计学意义(即统计估计所得的参数值)的不一致.表明常用的线性与非线性回归所求得的参数并不能代表其真实的生态学意义.本文以海南南湾野生猕猴的种群增长曲线为例,偿试了一种新的方法通过对捕促猴行为的不同处理引起的Logistic非线性回归曲线的不同反应的分析,并结合参数之间固有关系,得到了不同于回归方法所求得的参数值
URL [本文引用: 1]
通过分析Logistic模型的推导过程得到了各个参数之间的关系,这些参数包括种群增长率r,环境容纳量K,密度制约系数l,常数项a,拐点时刻rm.并且进一步阐明了参数的生态学意义(定义)与统计学意义(即统计估计所得的参数值)的不一致.表明常用的线性与非线性回归所求得的参数并不能代表其真实的生态学意义.本文以海南南湾野生猕猴的种群增长曲线为例,偿试了一种新的方法通过对捕促猴行为的不同处理引起的Logistic非线性回归曲线的不同反应的分析,并结合参数之间固有关系,得到了不同于回归方法所求得的参数值
DOIURLPMID [本文引用: 1]
Premise of the study: Numerous long-term studies in seasonal habitats have tracked interannual variation in first flowering date (FFD) in relation to climate, documenting the effect of warming on the FFD of many species. Despite these efforts, long-term phenological observations are still lacking for many species. If we could forecast responses based on taxonomic affinity, however, then we could leverage existing data to predict the climate-related phenological shifts of many taxa not yet studied.Methods: We examined phenological time series of 1226 species occurrences (1031 unique species in 119 families) across seven sites in North America and England to determine whether family membership (or family mean FFD) predicts the sensitivity of FFD to standardized interannual changes in temperature and precipitation during seasonal periods before flowering and whether families differ significantly in the direction of their phenological shifts.Key results: Patterns observed among species within and across sites are mirrored among family means across sites; early-flowering families advance their FFD in response to warming more than late-flowering families. By contrast, we found no consistent relationships among taxa between mean FFD and sensitivity to precipitation as measured here.Conclusions: Family membership can be used to identify taxa of high and low sensitivity to temperature within the seasonal, temperate zone plant communities analyzed here. The high sensitivity of early-flowering families (and the absence of early-flowering families not sensitive to temperature) may reflect plasticity in flowering time, which may be adaptive in environments where early-season conditions are highly variable among years.
[本文引用: 2]
[本文引用: 2]
DOIURL [本文引用: 1]
DOIURL [本文引用: 1]
本文在划分内蒙古草原生命地带的基础上,研究森林草原、典型草原和荒漠草原对两种气候变化方 案的响应.结果表明,气候变化对内蒙古的草原植被可能产生重要的影响.一方面,草原面积显著减少,南部界限大幅度北移,森林草原退出本区.另一方面,草原 生产力明显下降,荒漠草原的减产最为突出.气候变化的作用在本区的东部和南部表现为草原空间分布的迁移,在西部干旱地区则导致生产力的迅速下降.总之,草 原对温度的升高以及人为干扰均更为敏感.
DOIURL [本文引用: 1]
本文在划分内蒙古草原生命地带的基础上,研究森林草原、典型草原和荒漠草原对两种气候变化方 案的响应.结果表明,气候变化对内蒙古的草原植被可能产生重要的影响.一方面,草原面积显著减少,南部界限大幅度北移,森林草原退出本区.另一方面,草原 生产力明显下降,荒漠草原的减产最为突出.气候变化的作用在本区的东部和南部表现为草原空间分布的迁移,在西部干旱地区则导致生产力的迅速下降.总之,草 原对温度的升高以及人为干扰均更为敏感.
URL [本文引用: 1]
对历史时期欧洲中部地区植被历史的研究表明,人类活动不仅破坏了自然、导致植被的单一化,同时也对植被与景观的丰富度(多样性)产生影响.人类或家畜的干预使得一些半自然、高多样性的生境类型及相应的植被类型得以保持和发展;但过度的干扰势必造成植被的单一化和贫乏化,威胁生物多样性的保存和保护.当今的中欧植被格局总体上是近几个世纪,某些地区甚至是上千年来,人为干扰叠加在气候变化影响之上的综合产物.中欧大部分地区的潜在植被多为森林,如果没有人为活动的强烈影响,除了岩石、水体、海滩、林线以上的高山以及高位沼泽等特定生境的分布区域以外,当今中欧的大部分地区应当仍覆盖着郁闭的阔叶林,而不会表现出今天的多样性景观.因此,自然保护的对象不应当仅仅是"纯自然"植被,保护手段也不仅仅是"清除人为干扰".在保护多样性思想的指导下,各种典型植被类型都是值得保护的,除了高自然度的自然生态系统外,栽培植被也应当被保存和保护,否则,它们会随着特定耕作或管理方式的消失而消失.同时,既应保护い"当前植被",也要恢复"潜在植被",使目前多样的景观类型、植被类型和栖息地类型得以维持和发展.本文结论为解决当前欧洲自然保护中的争议性问题提供了依据,也可以为中国的生物多样性保护战略提供参考.
DOIURL [本文引用: 1]
Phenological shifts are one of the most conspicuous biological effects of global warming; observational data need benchmarking against experimental data. Grapevine phenology was monitored weekly between budswell and maturity in three factorial field experiments during two seasons. Two thermal regimes (heated vs. control) were combined with two irrigation regimes (experiment 1), two source:sink ratios (experiment 2) and four varieties (experiment 3). Open-top chambers were used to elevate temperature. We present evidence of nonlinearity of thermal effects on phenology that is explained by two complementary factors. Firstly, temperature-driven shifts of sensitive events (e.g. onset of sugar accumulation in berries) moved the timing of subsequent events into cooler conditions, hence dampening warming effects. Secondly, thermal effects on phenology seemed to be modulated by the interplay between resource-driven growth and temperature-driven development; an enhanced thermal effect on berry ripening associated with high source:sink ratio supports this proposition. Measured shifts in maturity were smaller than expected from reported time series analysis. During berry ripening towards maturity, the phenological trajectories of heated and control vines largely overlapped on thermal time scales; differences in phenology between treatments were therefore attributed to actual thermal regimes. We thus conclude that thermal sensitivities from time series (6 9d C 1) over-estimate thermal effects on grapevine maturity.
[本文引用: 1]
DOIURL [本文引用: 1]
ABSTRACT The vegetation green-up date (GUD) is widely expected to advance to an earlier date in the year in response to increasing spring temperature. However, although it is well known that climatic warming has been more intensive at higher latitudes than at lower latitudes in the Northern Hemisphere, it is not known whether this greater climatic warming at higher latitudes has led to a greater advance of vegetation GUD during the past few decades. We have first determined GUD from the satellite-derived greenness vegetation index for all the vegetated land between 30 and 75°N from 1982 to 2008, and then investigated the latitudinal pattern of the inter-annual trend of GUD and its relation to pre-season temperature. The results show a generally greater GUD advance in lower latitudes, in spite of the faster increase in pre-season temperature in higher latitudes. We find that 88% of the latitudinal variability in the GUD trend can be explained by the sensitivity of the GUD response to pre-season temperature. The GUD change has also resulted in a northward shift of GUD isolines by 1°–4° between 50 and 65°N during the period. These findings highlight the sensitivity of vegetation response to temperature in shaping the spatial pattern of spring phenological change and suggest that temperate ecosystems may experience greater phenological change if the current latitudinal pattern of climatic warming continues.
DOIURLPMID [本文引用: 1]
Abstract The ongoing changes in vegetation spring phenology in temperate/cold regions are widely attributed to temperature. However, in arid/semiarid ecosystems, the correlation between spring temperature and phenology is much less clear. We test the hypothesis that precipitation plays an important role in the temperature dependency of phenology in arid/semiarid regions. We therefore investigated the influence of preseason precipitation on satellite-derived estimates of starting date of vegetation growing season (SOS) across the Tibetan Plateau (TP). We observed two clear patterns linking precipitation to SOS. First, SOS is more sensitive to interannual variations in preseason precipitation in more arid than in wetter areas. Spatially, an increase in long-term averaged preseason precipitation of 1002mm corresponds to a decrease in the precipitation sensitivity of SOS by about 0.0102day02mm(-1) . Second, SOS is more sensitive to variations in preseason temperature in wetter than in dryer areas of the plateau. A spatial increase in precipitation of 1002mm corresponds to an increase in temperature sensitivity of SOS of 0.2502day02°C(-1) (0.25 day SOS advance per 102°C temperature increase). Those two patterns indicate both direct and indirect impacts of precipitation on SOS on TP. This study suggests a balance between maximizing benefit from the limiting climatic resource and minimizing the risk imposed by other factors. In wetter areas, the lower risk of drought allows greater temperature sensitivity of SOS to maximize the thermal benefit, which is further supported by the weaker interannual partial correlation between growing degree days and preseason precipitation. In more arid areas, maximizing the benefit of water requires greater sensitivity of SOS to precipitation, with reduced sensitivity to temperature. This study highlights the impacts of precipitation on SOS in a large cold and arid/semiarid region and suggests that influences of water should be included in SOS module of terrestrial ecosystem models for drylands. 08 2015 John Wiley & Sons Ltd.
DOIURLPMID [本文引用: 1]
Abstract In recent decades, satellite-derived start of vegetation growing season (SOS) has advanced in many northern temperate and boreal regions. Both the magnitude of temperature increase and the sensitivity of the greenness phenology to temperature-the phenological change per unit temperature-can contribute the advancement. To determine the temperature-sensitivity, we examined the satellite-derived SOS and the potentially effective pre-season temperature (T eff) from 1982 to 2008 for vegetated land between 30 N and 80 N. Earlier season vegetation types, i.e., the vegetation types with earlier SOSmean (mean SOS for 1982-2008), showed greater advancement of SOS during 1982-2008. The advancing rate of SOS against year was also greater in the vegetation with earlier SOSmean even the T eff increase was the same. These results suggest that the spring phenology of vegetation may have high temperature sensitivity in a warmer area. Therefore it is important to consider temperature-sensitivity in assessing broad-scale phenological responses to climatic warming. Further studies are needed to explore the mechanisms and ecological consequences of the temperature-sensitivity of start of growing season in a warming climate.
DOIURL [本文引用: 1]
Spatial variations in phenological responses to temperature have not been reported for grasslands of the Qinghai-Tibetan Plateau. Using satellite-derived normalized difference vegetation index and meteorological records from 1982 to 2006, we characterized the spatial patterns of grassland green-up onset in relation to air temperature and precipitation before the growing season (“preseason” henceforth) in the central and eastern plateau by combining linear programming with correlation analysis. Green-up onset near half of the meteorological stations was significantly correlated (p<0.10) with precipitation and thermal spring onset (TSO) date based on the cumulative temperature less than 6 weeks before the onset. The green-up onset paralleled the advance in TSO in the southwestern, southeastern, eastern, and northeastern parts of the plateau. The TSO and preseason precipitation (PPT) explained part of the inter-annual phenological variations, with r2 varying between 0.05 and 0.55 and averaging 0.28, and did not explain delay of green-up onset in some areas. Increasing preseason temperature tended to advance green-up onset in relatively moist areas. PPT exerted a stronger influence on green-up onset in drier areas. These results indicate spatial differences in the key environmental influences on spring phenology. To improve the ability to predict onset, ground-based community-level phenological studies and spatial scaling-up of the phenology–climate relationship will be necessary.
DOIURL [本文引用: 1]
青藏高原对我国乃至亚洲生态安全具有重要的屏障作用。在全球变化和人类活动的综合影响下,青藏高原呈现出生态系统稳定性降低、资源环境压力增大等问题,突出表现为:冰川退缩显著、土地退化形势严峻、水土流失加剧、生物多样性威胁加大与珍稀生物资源减少、自然灾害增多等。这些问题严重影响了青藏高原区域生态安全屏障功能的发挥。针对当前高原生态安全状况,在总结相关研究成果和生态建设实践经验的基础上,提出了加强青藏高原国家生态安全屏障保护与建设的对策建议:加强气候变化对青藏高原生态屏障作用影响及区域生态安全调控作用的基础研究;系统开展高原生态安全屏障保护和建设关键技术研究与示范推广;部署建设生态屏障功能动态监测体系,加强生态安全屏障保护与建设成效评估,构建评估体系和标准,并凝练经验,以系统提升国家生态安全屏障的总体功能,在应对全球变化中占据主动地位。
[本文引用: 1]
[本文引用: 1]
DOIURL [本文引用: 2]
DOIURL [本文引用: 1]
Vegetative spring green-up date (GUD), an indicator of plants' sensitivity to climate change, exerts an important influence on biogeochemical cycles. Conventionally, large-scale monitoring of spring phenology is primarily detected by satellite-based vegetation indices (VIs), e.g. the Normalized Difference Vegetation Index (NDVI). However, these indices have long been criticized, as the derived GUD can be biased by snowmelt. To minimize the snowmelt effect in monitoring spring phenology, we developed a new index, Normalized Difference Phenology Index (NDPI), which is a 3-band VI, designed to best contrast vegetation from the background (i.e. soil and snow in this study) as well as to minimize the difference among the backgrounds. We examined the rigorousness of NDPI in three ways. First, we conducted mathematical simulations to show that NDPI is mathematically robust and performs superior to NDVI for differentiating vegetation from the background, theoretically justifying NDPI for spring phenology monitoring. Second, we applied NDPI using MODIS land surface reflectance products to real vegetative ecosystems of three in-situ PhenoCam sites. Our results show that, despite large snow cover in the winter and snowmelt process in the spring, the temporal trajectories of NDPI closely track the vegetation green-up events. Finally, we applied NDPI to 11 eddy-covariance tower sites, spanning large gradients in latitude and vegetation types in deciduous ecosystems, using the same MODIS products. Our results suggest that the GUD derived by using NDPI is consistent with daily gross primary production (GPP) derived GUD, with R (Spearman's correlation)02=020.93, Bias02=022.9002days, and RMSE (the root mean square error)02=027.7502days, which outcompetes the snow removed NDVI approach, with R02=020.90, Bias02=027.3402days, and RMSE02=0210.9102days. We concluded that our newly-developed NDPI is robust to snowmelt effect and is a reliable approach for monitoring spring green-up in deciduous ecosystems.
DOIURL [本文引用: 2]
Abstract Understanding how flowering phenology responds to warming and cooling (i.e., symmetric or asymmetric response) is needed to predict the response of flowering phenology to future climate change that will happen with the occurrence of warm and cold years superimposed upon a long-term trend. A three-year reciprocal translocation experiment was performed along an elevation gradient from 3200 m to 3800 m in the Tibetan Plateau for six alpine plants. Transplanting to lower elevation (warming) advanced the first flowering date (FFD) and transplanting to higher elevation (cooling) had the opposite effect. The FFD of early spring flowering plants (ESF) was four times less sensitive to warming than to cooling (by 612.1 d/°C and 8.4 d/°C, respectively), while midsummer flowering plants (MSF) were about twice as sensitive to warming than to cooling (618.0 d/°C and 4.9 d/°C, respectively). Compared with pooled warming and cooling data, warming alone significantly underpredicted 3.1 d/°C for ESF and overestimated 1.7 d/°C for MSF. These results suggest that future empirical and experimental studies should consider nonlinear temperature responses that can cause such warming–cooling asymmetries as well as differing life strategies (ESF vs. MSF) among plant species.
DOIURL [本文引用: 1]
Shifts in the timing of spring phenology are a central feature of global change research. Long-term observations of plant phenology have been used to track vegetation responses to climate variability but are often limited to particular species and locations and may not represent synoptic patterns. Satellite remote sensing is instead used for continental to global monitoring. Although numerous methods exist to extract phenological timing, in particular start-of-spring (SOS), from time series of reflectance data, a comprehensive intercomparison and interpretation of SOS methods has not been conducted. Here, we assess 10 SOS methods for North America between 1982 and 2006. The techniques include consistent inputs from the 8 km Global Inventory Modeling and Mapping Studies Advanced Very High Resolution Radiometer NDVIg dataset, independent data for snow cover, soil thaw, lake ice dynamics, spring streamflow timing, over 16 000 individual measurements of ground-based phenology, and two temperature-driven models of spring phenology. Compared with an ensemble of the 10 SOS methods, we found that individual methods differed in average day-of-year estimates by 60 days and in standard deviation by 20 days. The ability of the satellite methods to retrieve SOS estimates was highest in northern latitudes and lowest in arid, tropical, and Mediterranean ecoregions. The ordinal rank of SOS methods varied geographically, as did the relationships between SOS estimates and the cryospheric/hydrologic metrics. Compared with ground observations, SOS estimates were more related to the first leaf and first flowers expanding phenological stages. We found no evidence for time trends in spring arrival from ground- or model-based data; using an ensemble estimate from two methods that were more closely related to ground observations than other methods, SOS trends could be detected for only 12% of North America and were divided between trends towards both earlier and later spring.
DOIURL [本文引用: 1]
Temporal shifts in phenology are important biotic indicators of climate change. Satellite-derived Land Surface Phenology (LSP) offers data for the study of vegetation phenology at landscape to global spatial scales. However, the mechanisms of plant phenological responses to temperature are rarely considered at broad spatial scales, despite the potential improvements to spatiotemporal predictions. Geographical gradients in community species composition may also affect LSP spatially and temporally. Using a modified survival analysis, we reveal how weather and climate relate to physiological chilling and heating requirements and affect deciduous forest green-up in New England, USA over 902years (2001–2009). While warm daily temperatures lead to earlier green-up of deciduous forests, chilling temperatures had a larger influence on green-up. We also found that the effects of community composition across the landscape were as important as the effects of weather. Greater oak dominance led to later green-up, while sites with more birch tended to have earlier green-up dates. Projection into the future (2046–2065) with statistically downscaled, bias corrected climate model output suggested advanced green-up (8–4802days) driven by higher heating and chilling accumulations, but green-up in coastal areas may be delayed due to reduced chilling accumulation. This study provides an innovative statistical method combining plant physiological mechanisms, topographic spatial heterogeneity, and species composition to predict how LSP responds to climate and weather variation and makes future projections.
DOIURLPMID [本文引用: 1]
Abstract Climate change has caused advances in spring phases of many plant species. Theoretically, however, strong warming in winter could slow the fulfillment of chilling requirements, which may delay spring phenology. This phenomenon should be particularly pronounced in regions that are experiencing rapid temperature increases and are characterized by highly temperature-responsive vegetation. To test this hypothesis, we used the Normalized Difference Vegetation Index ratio method to determine the beginning, end, and length of the growing season of meadow and steppe vegetation of the Tibetan Plateau in Western China between 1982 and 2006. We then correlated observed phenological dates with monthly temperatures for the entire period on record. For both vegetation types, spring phenology initially advanced, but started retreating in the mid-1990s in spite of continued warming. Together with an advancing end of the growing season for steppe vegetation, this led to a shortening of the growing period. Partial least-squares regression indicated that temperatures in both winter and spring had strong effects on spring phenology. Although warm springs led to an advance of the growing season, warm conditions in winter caused a delay of the spring phases. This delay appeared to be related to later fulfillment of chilling requirements. Because most plants from temperate and cold climates experience a period of dormancy in winter, it seems likely that similar effects occur in other environments. Continued warming may strengthen this effect and attenuate or even reverse the advancing trend in spring phenology that has dominated climate-change responses of plants thus far.
[本文引用: 1]
[本文引用: 1]
Modeling daily flowering probabilities: Expected impact of climate change on Japanese cherry phenology
1
2014
... 本文尝试利用生存分析模型来探讨植物物候与气候因子的关系.生存分析模型最初用于医学研究, 是针对事件不同时效的统计学模型(
Relationships between phenology, radiation and precipitation in the Amazon region
1
2011
... 近100多年来, 气候变暖已对全球生态系统产生了巨大影响, 成为当前学科研究和社会舆论共同关注的热点问题.近年的研究结果表明, 植物物候与气候变暖有非常密切的关系, 许多研究探讨了各种气候要素对植物物候的影响, 如: 有研究发现, 欧洲植物的返青期受12月到2月平均气温的影响, 气温每上升1 ℃, 返青期就会提前3天左右(
A simple method for reconstructing a high-quality NDVI time-series data set based on the Savitzky-Golay filter
1
2004
... 由于全球普遍缺乏草原植物物候的长期观测数据, 本研究利用了1982-2009年的GIMMS (Global Inventory Monitoring and Modeling Studies)归一化差分植被指数(NDVI)时间序列数据反演得到草原植被的返青期.基于NOAA-AVHRR卫星观测, GIMMS生成了15天最大NDVI值合成的8 km × 8 km NDVI数据.我们首先对该数据进行了雪盖数据识别和去除(
A simple method for detecting phenological change from time series of vegetation idexindex
1
2016
... 由于全球普遍缺乏草原植物物候的长期观测数据, 本研究利用了1982-2009年的GIMMS (Global Inventory Monitoring and Modeling Studies)归一化差分植被指数(NDVI)时间序列数据反演得到草原植被的返青期.基于NOAA-AVHRR卫星观测, GIMMS生成了15天最大NDVI值合成的8 km × 8 km NDVI数据.我们首先对该数据进行了雪盖数据识别和去除(
Cox回归模型与对数线性回归模型在生存分析中应用的比较
1
1997
... 本文尝试利用生存分析模型来探讨植物物候与气候因子的关系.生存分析模型最初用于医学研究, 是针对事件不同时效的统计学模型(
Cox回归模型与对数线性回归模型在生存分析中应用的比较
1
1997
... 本文尝试利用生存分析模型来探讨植物物候与气候因子的关系.生存分析模型最初用于医学研究, 是针对事件不同时效的统计学模型(
Regression models and life-tables
1
1972
... 为了构建包含气温与降水因子的风险函数, 我们借鉴了随时间变化的COX比例风险模型.COX比例风险模型用于不知道生存时间的函数分布类型, 又要分析多个相关因素对生存时间的影响时, 比例风险模型的基本结构(
Beyond seasonal climate: Statistical estimation of phenological responses to weather
4
2014
... 本文尝试利用生存分析模型来探讨植物物候与气候因子的关系.生存分析模型最初用于医学研究, 是针对事件不同时效的统计学模型(
... )和单一物种作为研究材料(
... 由于在我们的研究中气温与降水量每天都在发生变化, 不能用传统的生存分析模型推导出模型中的各个参数, 而是要结合蒙特卡洛方法, 通过大量抽样过程获得相应参数的拟合值(
... 3)生存分析法的另一优点在于, 它是一个逐日的模型(
Spatiotemporal variation in alpine grassland phenology in the Qinghai-Tibetan Plateau from 1999 to 2009
1
2013
... 本文尝试利用生存分析模型来探讨植物物候与气候因子的关系.生存分析模型最初用于医学研究, 是针对事件不同时效的统计学模型(
Codominant water control on global interannual variability and trends in land surface phenology and greenness
1
2015
... 近100多年来, 气候变暖已对全球生态系统产生了巨大影响, 成为当前学科研究和社会舆论共同关注的热点问题.近年的研究结果表明, 植物物候与气候变暖有非常密切的关系, 许多研究探讨了各种气候要素对植物物候的影响, 如: 有研究发现, 欧洲植物的返青期受12月到2月平均气温的影响, 气温每上升1 ℃, 返青期就会提前3天左右(
Declining global warming effects on the phenology of spring leaf unfolding
3
2015
... 本文尝试利用生存分析模型来探讨植物物候与气候因子的关系.生存分析模型最初用于医学研究, 是针对事件不同时效的统计学模型(
... 过去有很多研究指出, 在中纬度地区, 植物的春季物候主要受气温控制, 因而在探究物候与环境要素的关系时, 常常采用线性模型分析物候与气温之间的相关关系.如利用返青期与一定时间内的气温之间的线性关系求取气温敏感性.而要利用线性模型, 首先需要对气候变量进行定义.目前, 对气候变量的定义方式主要有以下两种, 以气温为例: (1)指定物候期前1-3个月作为有效气候区间, 区间内的平均气温为气温变量(
... 1)在2.3中我们指出, 利用线性模型进行返青期与季前气温的模拟时, 若指定有效气候区间, 则会忽略不同地区之间的差异.实际上, 位于不同气候区域的不同植被类型, 对返青期有效的季前区间存在较大的差异.相同区间的气温可能并不对所有植物都有效, 也不能反映出真实的气温敏感性.因而, 目前在线性回归模型中, 研究者通常采取与物候时间序列相关性最强的一段平均气温区间作为季前区间(
Climate and the meristem temperatures of plant communities near the tree-line
1
1989
... 尽管气温对返青期的作用在欧洲更为明显, 研究中也发现降水增加在欧洲可能会造成返青期的推迟.可能的原因是: 木本植物的根际系统相比于草本植物更深, 因而可以获得土壤深处的水分, 因而降水对欧洲地区木本植物返青期影响较小(
Changes in temperature sensitivity of spring phenology with recent climate warming in Switzerland are related to shifts of the preseason
1
2017
... 1)在2.3中我们指出, 利用线性模型进行返青期与季前气温的模拟时, 若指定有效气候区间, 则会忽略不同地区之间的差异.实际上, 位于不同气候区域的不同植被类型, 对返青期有效的季前区间存在较大的差异.相同区间的气温可能并不对所有植物都有效, 也不能反映出真实的气温敏感性.因而, 目前在线性回归模型中, 研究者通常采取与物候时间序列相关性最强的一段平均气温区间作为季前区间(
A European daily high-resolution gridded data set of surface temperature and precipitation for 1950-2006
1
2008
... 欧洲地区的物候数据取自PEP725数据集(http:// www.pep725.eu/), 选取时间为1950-2009年.根据该数据, 返青期定义为第一个叶柄出现的日期.该地区的气象数据为日均格网数据, 来自European Climate Assessment & Dataset项目中的E-OBS数据集(http://eca.knmi.nl/).该数据集包含了1950年以来, 25°-75° N, 40° W -75° E范围内0.25° × 0.25°的日平均气温与降水量数据(
Long-term trends mask variation in the direction and magnitude of short-term phenological shifts
1
2013
... 但是, 这些物候影响因素分析普遍存在两个问题.首先, 分析通常基于线性模型, 如简单偏相关分析(
Can we detect a nonlinear response to temperature in European plant phenology?
2
2016
... 近100多年来, 气候变暖已对全球生态系统产生了巨大影响, 成为当前学科研究和社会舆论共同关注的热点问题.近年的研究结果表明, 植物物候与气候变暖有非常密切的关系, 许多研究探讨了各种气候要素对植物物候的影响, 如: 有研究发现, 欧洲植物的返青期受12月到2月平均气温的影响, 气温每上升1 ℃, 返青期就会提前3天左右(
... 本文尝试利用生存分析模型来探讨植物物候与气候因子的关系.生存分析模型最初用于医学研究, 是针对事件不同时效的统计学模型(
气候变化对内蒙古中部草原优势牧草生长季的影响
1
2013
... 本文尝试利用生存分析模型来探讨植物物候与气候因子的关系.生存分析模型最初用于医学研究, 是针对事件不同时效的统计学模型(
气候变化对内蒙古中部草原优势牧草生长季的影响
1
2013
... 本文尝试利用生存分析模型来探讨植物物候与气候因子的关系.生存分析模型最初用于医学研究, 是针对事件不同时效的统计学模型(
Logistic种群增长模型参数的生态学意义及其辨识──南湾野生猕猴种群的应用
1
1995
... 2)由
Logistic种群增长模型参数的生态学意义及其辨识──南湾野生猕猴种群的应用
1
1995
... 2)由
Flowering date of taxonomic families predicts phenological sensitivity to temperature: Implications for forecasting the effects of climate change on unstudied taxa
1
2013
... 1)在2.3中我们指出, 利用线性模型进行返青期与季前气温的模拟时, 若指定有效气候区间, 则会忽略不同地区之间的差异.实际上, 位于不同气候区域的不同植被类型, 对返青期有效的季前区间存在较大的差异.相同区间的气温可能并不对所有植物都有效, 也不能反映出真实的气温敏感性.因而, 目前在线性回归模型中, 研究者通常采取与物候时间序列相关性最强的一段平均气温区间作为季前区间(
地理生态学的干燥度指数及其应用评述
2
2004
... 研究中, 为了研究各生态系统可利用水的情况, 我们使用了Holdridge干燥度指数(HAI)作为考察植物可利用水的指标之一(
... 一般而言, 较之湿润生态系统, 干旱生态系统的降水对返青期有更强的影响, 但是植物可利用水并不只是由降水量决定, 还受一些其他要素, 尤其是气温的影响(
地理生态学的干燥度指数及其应用评述
2
2004
... 研究中, 为了研究各生态系统可利用水的情况, 我们使用了Holdridge干燥度指数(HAI)作为考察植物可利用水的指标之一(
... 一般而言, 较之湿润生态系统, 干旱生态系统的降水对返青期有更强的影响, 但是植物可利用水并不只是由降水量决定, 还受一些其他要素, 尤其是气温的影响(
European phenological response to climate change matches the warming pattern
1
2006
... 过去有很多研究指出, 在中纬度地区, 植物的春季物候主要受气温控制, 因而在探究物候与环境要素的关系时, 常常采用线性模型分析物候与气温之间的相关关系.如利用返青期与一定时间内的气温之间的线性关系求取气温敏感性.而要利用线性模型, 首先需要对气候变量进行定义.目前, 对气候变量的定义方式主要有以下两种, 以气温为例: (1)指定物候期前1-3个月作为有效气候区间, 区间内的平均气温为气温变量(
气候变化对内蒙古草原分布和生产力影响的预测研究
1
2001
... 内蒙古草原和青藏高原草甸总面积广阔, 气候多样.内蒙古自治区属温带大陆性气候, 由东北向西南, 水分表现为递减趋势, 热量则为递增趋势(
气候变化对内蒙古草原分布和生产力影响的预测研究
1
2001
... 内蒙古草原和青藏高原草甸总面积广阔, 气候多样.内蒙古自治区属温带大陆性气候, 由东北向西南, 水分表现为递减趋势, 热量则为递增趋势(
人类活动影响下的生物多样性保护: 中欧的植被演化及其启示
1
2011
... 内蒙古草原和青藏高原草甸总面积广阔, 气候多样.内蒙古自治区属温带大陆性气候, 由东北向西南, 水分表现为递减趋势, 热量则为递增趋势(
人类活动影响下的生物多样性保护: 中欧的植被演化及其启示
1
2011
... 内蒙古草原和青藏高原草甸总面积广阔, 气候多样.内蒙古自治区属温带大陆性气候, 由东北向西南, 水分表现为递减趋势, 热量则为递增趋势(
Nonlinear effects of elevated temperature on grapevine phenology
1
2013
... 但是, 这些物候影响因素分析普遍存在两个问题.首先, 分析通常基于线性模型, 如简单偏相关分析(
Life Forms and Phenology: Tropical Savannas
1
1983
... 尽管气温对返青期的作用在欧洲更为明显, 研究中也发现降水增加在欧洲可能会造成返青期的推迟.可能的原因是: 木本植物的根际系统相比于草本植物更深, 因而可以获得土壤深处的水分, 因而降水对欧洲地区木本植物返青期影响较小(
Temperature sensitivity as an explanation of the latitudinal pattern of green-up date trend in Northern Hemisphere vegetation during 1982-2008
1
2015
... 但是, 这些物候影响因素分析普遍存在两个问题.首先, 分析通常基于线性模型, 如简单偏相关分析(
Precipitation impacts on vegetation spring phenology on the Tibetan Plateau
1
2015
... 本文尝试利用生存分析模型来探讨植物物候与气候因子的关系.生存分析模型最初用于医学研究, 是针对事件不同时效的统计学模型(
Earlier-?season vegetation has greater temperature sensitivity of spring phenology in Northern Hemisphere
1
2014
... 但是, 这些物候影响因素分析普遍存在两个问题.首先, 分析通常基于线性模型, 如简单偏相关分析(
Influences of temperature and precipitation before the growing season on spring phenology in grasslands of the central and eastern Qinghai-Tibetan Plateau
1
2011
... 本文尝试利用生存分析模型来探讨植物物候与气候因子的关系.生存分析模型最初用于医学研究, 是针对事件不同时效的统计学模型(
青藏高原国家生态安全屏障保护与建设
1
2012
... 内蒙古草原和青藏高原草甸总面积广阔, 气候多样.内蒙古自治区属温带大陆性气候, 由东北向西南, 水分表现为递减趋势, 热量则为递增趋势(
青藏高原国家生态安全屏障保护与建设
1
2012
... 内蒙古草原和青藏高原草甸总面积广阔, 气候多样.内蒙古自治区属温带大陆性气候, 由东北向西南, 水分表现为递减趋势, 热量则为递增趋势(
1:1000000中国植被图集
1
2001
... 由于全球普遍缺乏草原植物物候的长期观测数据, 本研究利用了1982-2009年的GIMMS (Global Inventory Monitoring and Modeling Studies)归一化差分植被指数(NDVI)时间序列数据反演得到草原植被的返青期.基于NOAA-AVHRR卫星观测, GIMMS生成了15天最大NDVI值合成的8 km × 8 km NDVI数据.我们首先对该数据进行了雪盖数据识别和去除(
1:1000000中国植被图集
1
2001
... 由于全球普遍缺乏草原植物物候的长期观测数据, 本研究利用了1982-2009年的GIMMS (Global Inventory Monitoring and Modeling Studies)归一化差分植被指数(NDVI)时间序列数据反演得到草原植被的返青期.基于NOAA-AVHRR卫星观测, GIMMS生成了15天最大NDVI值合成的8 km × 8 km NDVI数据.我们首先对该数据进行了雪盖数据识别和去除(
Elevational adaptation and plasticity in seedling phenology of temperate deciduous tree species
2
2013
... 但是, 这些物候影响因素分析普遍存在两个问题.首先, 分析通常基于线性模型, 如简单偏相关分析(
... 过去有很多研究指出, 在中纬度地区, 植物的春季物候主要受气温控制, 因而在探究物候与环境要素的关系时, 常常采用线性模型分析物候与气温之间的相关关系.如利用返青期与一定时间内的气温之间的线性关系求取气温敏感性.而要利用线性模型, 首先需要对气候变量进行定义.目前, 对气候变量的定义方式主要有以下两种, 以气温为例: (1)指定物候期前1-3个月作为有效气候区间, 区间内的平均气温为气温变量(
A snow-free vegetation index for improved monitoring of vegetation spring green-up date in deciduous ecosystems
1
2017
... 由于全球普遍缺乏草原植物物候的长期观测数据, 本研究利用了1982-2009年的GIMMS (Global Inventory Monitoring and Modeling Studies)归一化差分植被指数(NDVI)时间序列数据反演得到草原植被的返青期.基于NOAA-AVHRR卫星观测, GIMMS生成了15天最大NDVI值合成的8 km × 8 km NDVI数据.我们首先对该数据进行了雪盖数据识别和去除(
Asymmetric sensitivity of first flowering date to warming and cooling in alpine plants
2
2014
... 但是, 这些物候影响因素分析普遍存在两个问题.首先, 分析通常基于线性模型, 如简单偏相关分析(
... ;
Intercomparison, interpretation, and assessment of spring phenology in North America estimated from remote sensing for 1982-2006
1
2009
... 由于全球普遍缺乏草原植物物候的长期观测数据, 本研究利用了1982-2009年的GIMMS (Global Inventory Monitoring and Modeling Studies)归一化差分植被指数(NDVI)时间序列数据反演得到草原植被的返青期.基于NOAA-AVHRR卫星观测, GIMMS生成了15天最大NDVI值合成的8 km × 8 km NDVI数据.我们首先对该数据进行了雪盖数据识别和去除(
Green-up of deciduous forest communities of northeastern North America in response to climate variation and climate change
1
2015
... 本文尝试利用生存分析模型来探讨植物物候与气候因子的关系.生存分析模型最初用于医学研究, 是针对事件不同时效的统计学模型(
Winter and spring warming result in delayed spring phenology on the Tibetan Plateau
1
2010
... 但是, 这些物候影响因素分析普遍存在两个问题.首先, 分析通常基于线性模型, 如简单偏相关分析(
全球变化的中国气候-植被分类研究
1
1996
... 研究中, 为了研究各生态系统可利用水的情况, 我们使用了Holdridge干燥度指数(HAI)作为考察植物可利用水的指标之一(
全球变化的中国气候-植被分类研究
1
1996
... 研究中, 为了研究各生态系统可利用水的情况, 我们使用了Holdridge干燥度指数(HAI)作为考察植物可利用水的指标之一(
