HTML
--> --> -->Among the impact factors, the El Ni?o/Southern Oscillation (ENSO) is one of the main signals affecting summer rainfall in East Asia (Wu et al., 2003; Ding, 2007; Wang et al., 2009; Yamaura and Tomita, 2014). ENSO-related rainfall modes explain near 40% variance of summer rainfall in East Asia, and are associated with both ENSO decaying phases and developing phases (Wang et al., 2009). Also, there were significant differences in the distribution of summer rainfall anomalies in China under different flavors (East Pacific or Central Pacific types) of El Ni?o (Wu et al., 2017). ENSO affects summer rainfall anomalies in East Asia through the modulation of the Western Pacific Subtropical High (WPSH) (Wang et al., 2013, Zhang et al., 2017; Ding et al., 2021). Moreover, the "Indian Ocean capacitor effect" (Xie et al., 2009) represents the lag effect of ENSO on summer rainfall in East Asia via the Indian Ocean. The persistent warming of sea surface temperature (SST) in the tropical Indian Ocean after El Ni?o triggers a Kelvin wave in the troposphere and causes Ekman divergence over the tropical western Pacific, which leads to the variations of the WPSH and the atmospheric circulations in eastern Asia, which goes on to affect the mei-yu rain belt (Nitta, 1986; Nitta and Hu, 1996). Meanwhile, a portion of the SST anomaly (SSTA) in the tropical Indian Ocean, which is independent of ENSO, may impact variations of mei-yu through the modulation of the WPSH by changing the contrast of the east-west SSTA gradient over the tropical Indian-Pacific Ocean (Qian and Guan, 2019). Nevertheless, it remains unclear as to whether the combined influences of the tropical Indian and Pacific Oceans may result in an extreme mei-yu. Moreover, in addition to the impacts in the tropics, the extreme mei-yu is also affected by the cold air intrusions induced by blocking highs in the middle to high latitudes over Eurasia (Ding et al., 2021).
At intra-seasonal time scales, the Madden-Julian Oscillation (MJO) is the dominant variability in the tropics which also affects the eastern Asian summer climate variability. The interannual variability of MJO is associated with variations of the convection over the tropical Indian and western Pacific Oceans (Hendon et al., 1999; Slingo et al., 1999). The interannual variation of the convection may rely on the SSTAs in both the tropical Indian and Pacific Oceans. As a multi-timescale phenomenon, the mei-yu is observed with significant intra-seasonal oscillations (ISO) that are connected with the MJO (Liang and Ding, 2012; Ding et al., 2020). Recently, the roles of both the MJO (Zhang et al., 2021b) and Indian Ocean conditions (Zhou et al., 2021) have been respectively indicated in the extreme mei-yu over the Yangtze River in 2020. Historically, both the MJO and tropical oceans can influence climate anomalies (NAS, 2016; Liang and Lin, 2018), however, the issue is whether there are any connections between the MJO and tropical oceans regarding their impacts on the extreme mei-yu in 2020 from a historical perspective. Moreover, what is the prediction skill in a real-time operational model, and what is the predictability of an extreme mei-yu? It is of great interest to investigate how the combined effects of MJO and the cooperative influences of the Pacific and Indian Oceans act on the mei-yu anomaly, especially the extreme mei-yu in 2020. The prediction skill and predictability of mei-yu may be attributed to the influences of the MJO and the tropical Indian and Pacific Oceans.
In the present study, we examine the roles of MJO and cooperative influences of the Pacific and Indian Oceans on the 2020 extreme mei-yu Season in MLRYR and illustrate the predictability of the extreme mei-yu. The study focuses on the following three topics: (a) the 2020 mei-yu rainfall anomalies and associated circulation, (b) the roles of the MJO and the Pacific and Indian Oceans in the 2020 mei-yu, and (c) the prediction skill and predictability of mei-yu. The remainder of the paper is organized as follows. Various observational and reanalysis products, the forecast (hindcast) data from CFSv2 (version 2 of Climate Forecast System) of the National Centers for Environmental Prediction (NCEP) and Atmospheric Model Intercomparison Project (AMIP) simulations, as well as the methods employed, are described in section 2. The anomalies of the 2020 mei-yu and the associated background circulation are presented in section 3, and the impacts of MJO and the Pacific and Indian Oceans on the extreme mei-yu are discussed in section 4. The prediction skill assessment and the predictability evaluations are shown in section 5. Summary and discussion are given in section 6.
Monthly mean SSTs are obtained from the Extended Reconstructed SST V5 (ERSSTv5; Huang et al., 2017) on a 2° × 2° horizontal resolution from 1979 to 2020. The seasonal Nin?o-3.4 index is downloaded from the CPC (
Ensemble Empirical Mode Decomposition (EEMD) is adopted (Wu and Huang, 2009) to identify the contributions of different timescales to the extreme mei-yu, This helps to resolve the low-frequency components based on daily rainfall data over the mei-yu region. EEMD is adaptive and derives optimal frequencies for decomposing data from the data itself, which provides a natural filter to separate components of different timescales (Huang and Wu, 2008). The four steps included in the EEMD calculations are as follows: (1) a noise series is added to the target data, (2) the data with the added noise is decomposed into Intrinsic Mode Functions (IMFs), (3) repeat (1) and (2) by using different noise series each time, and (4) the final result can be obtained as the ensemble means of the corresponding IMFs of the decompositions.
Partial correlation (Saji and Yamagata, 2003) is also adopted to exclude the possible influence of ENSO:
where


Hindcasts and real-time forecasts in 1982–2020 are from the NCEP CFSv2 (Xue et al., 2013; Saha et al., 2014). CFSv2 is a fully coupled model representing the interaction between the earth's atmosphere, oceans, land, and sea ice. It has been operational at NCEP since March 2011, which has been used for operational sub-seasonal to seasonal predictions. More detailed descriptions of this model can be found in Saha et al. (2014) and Xue et al. (2013).
To investigate the rainfall response to SST, experiments from the AMIP with an atmospheric general circulation model (AGCM) forced by observed global SSTs are analyzed. The AGCM is the atmospheric component (Global Forecast System; GFS) of the NCEP CFSv2 (Saha et al., 2014). The integrations are from January 1957 to August 2020 and have 17 ensemble members with slightly different atmospheric initial conditions (Hu et al., 2017, 2020).
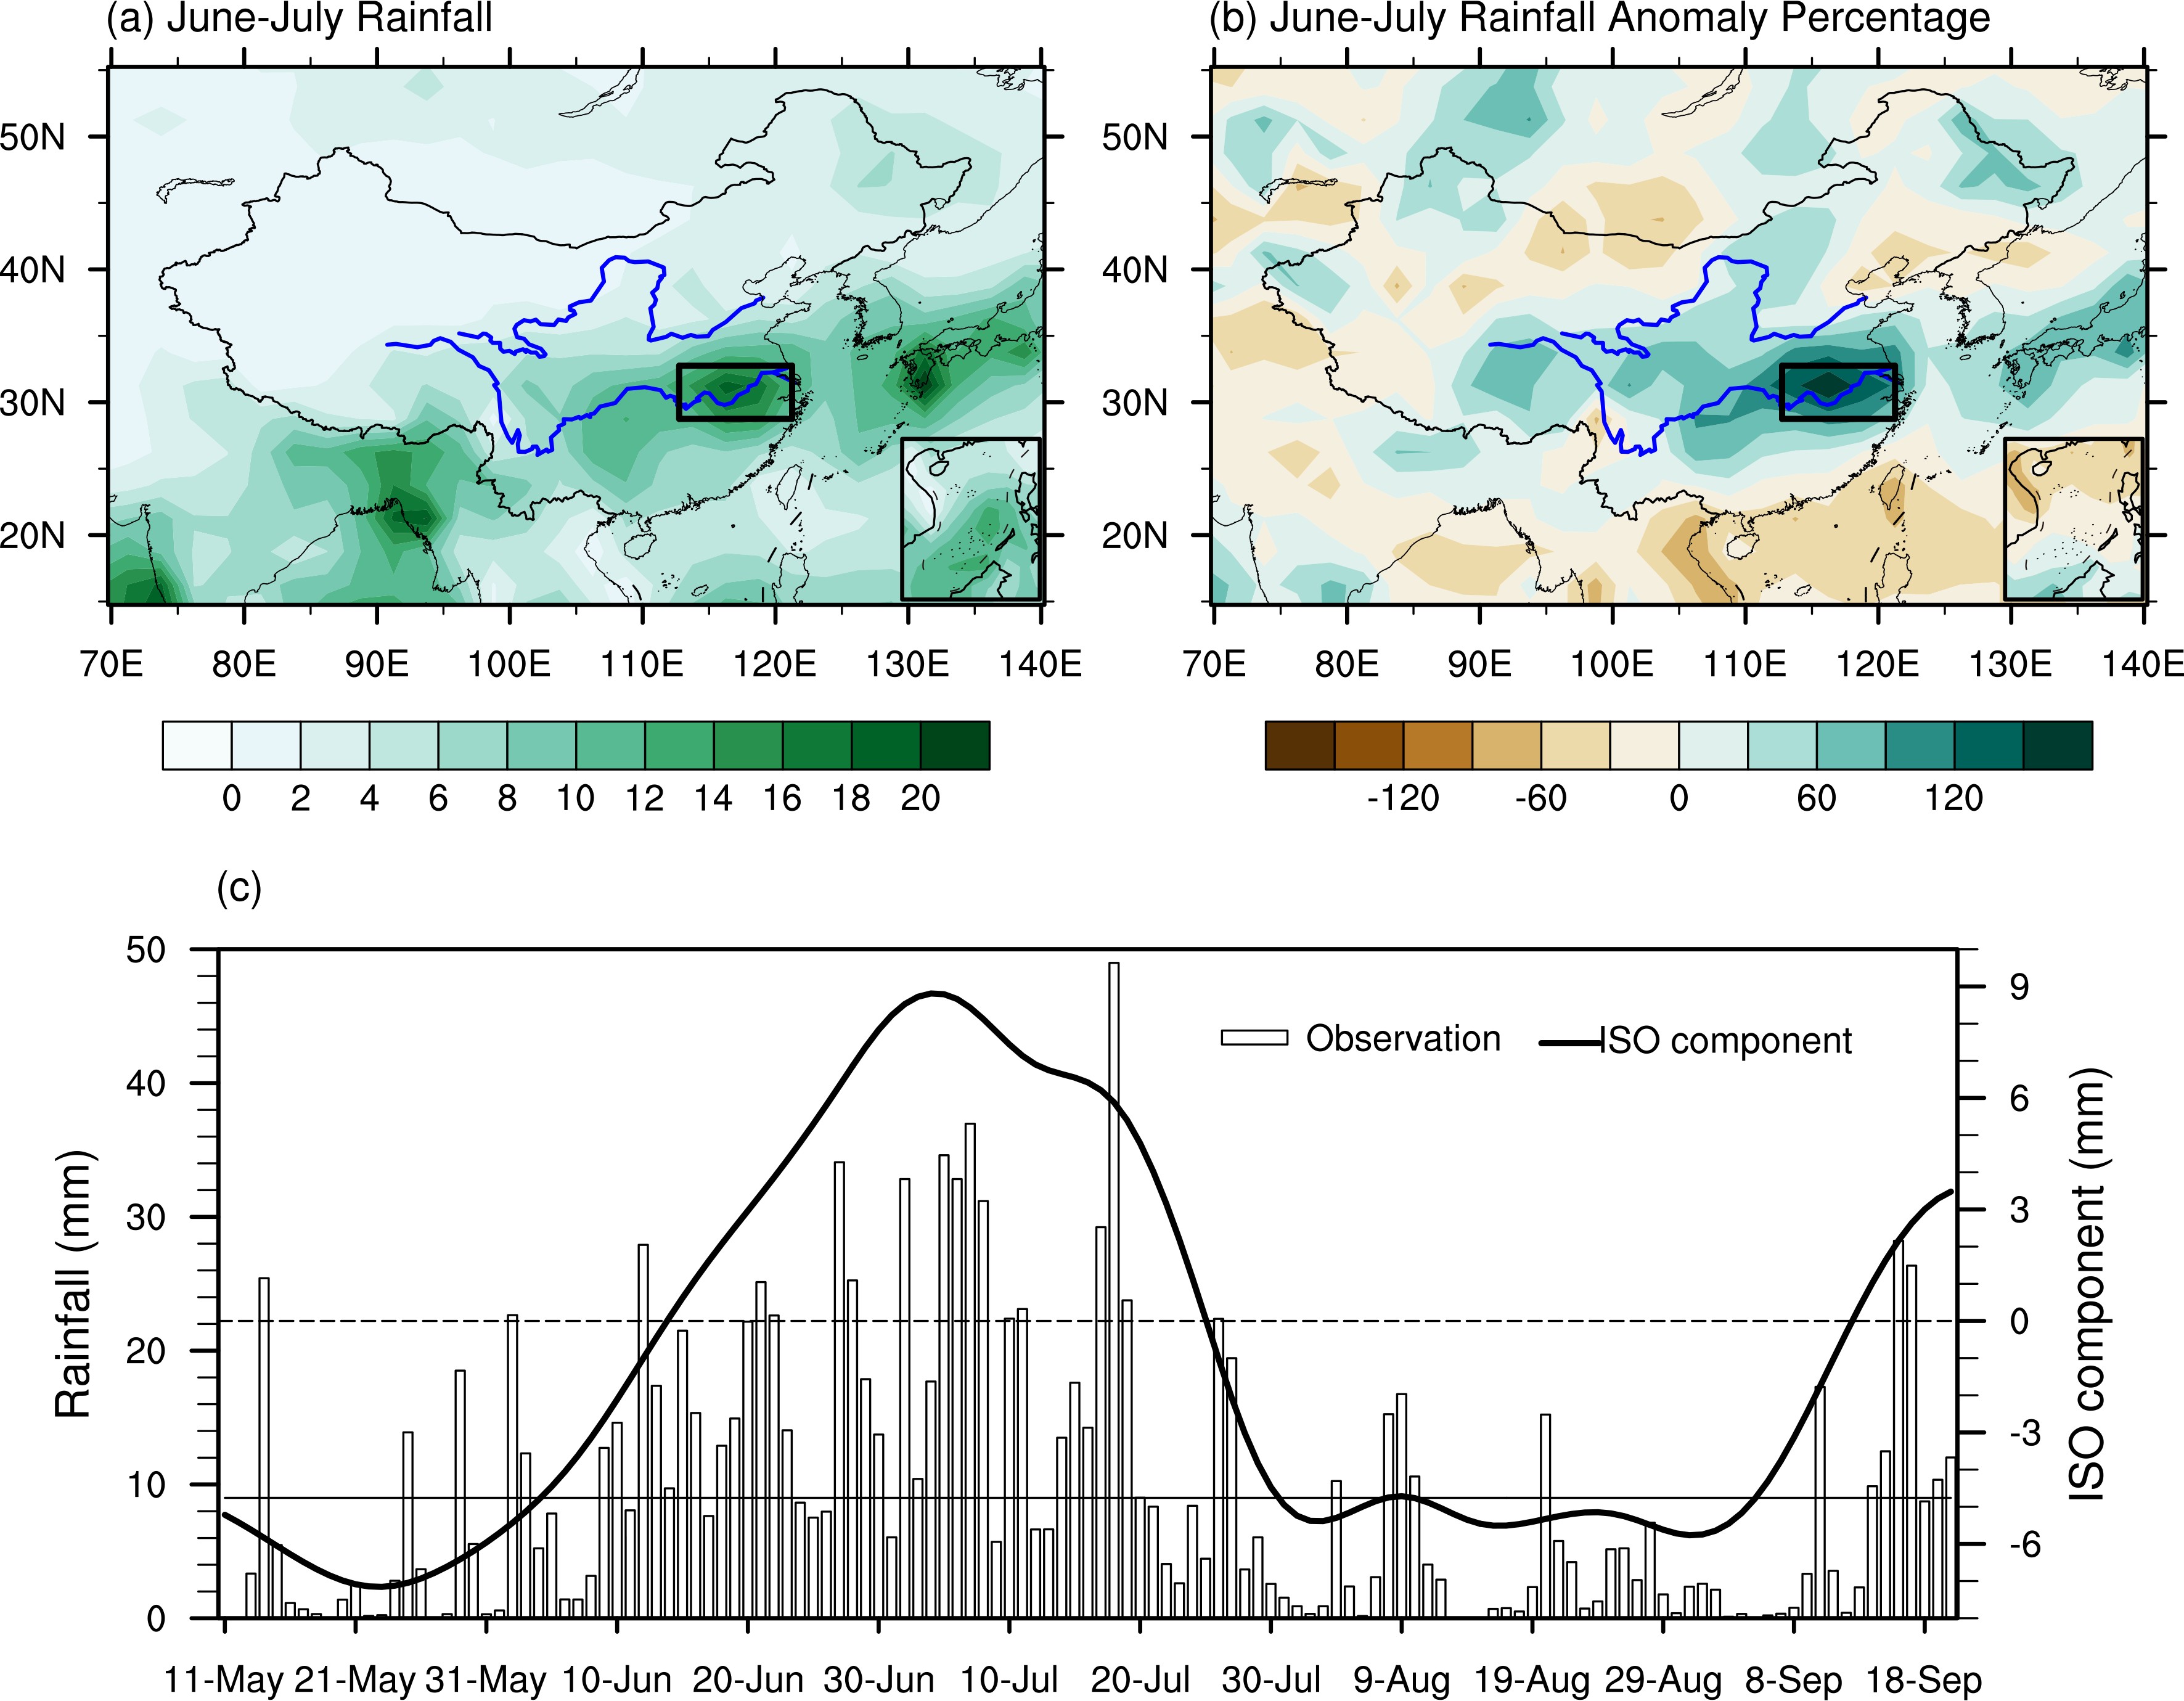 Figure1. (a) Spatial distribution of rainfall (units: mm d?1) and (b) rainfall anomaly percentage (units: %) in East Asia during June?July 2020 (the rectangle represents the low and middle reaches of the Yangtze River) and (c) variation of daily rainfall (bars) and its ISO component (curve) obtained by EEMD (units: mm; solid and dashed horizontal lines indicating seasonal mean of daily rainfall and its ISO component during May–September, respectively).
where Pa denotes rainfall anomaly percentage, P and Pc represent June?July rainfall amount during 2020 and 1981–2010, respectively. From Fig. 1c, it is noted that in addition to higher frequency variations with time scales of about two weeks (Liu et al., 2020; Ding et al., 2021), an intra-seasonal oscillation (ISO; obtained by EEMD) with a period of about 70 days is an important component modulating the sub-seasonal variation of the mei-yu. The quasi-biweekly oscillation (QBWO) can also modulate the heavy rainfall process in the rainy season as was the case for the flood season of 2020. As shown in Fig. 1c, the positive phase of the ISO with a period of about 70 days during summer corresponded to the 2020 Yangtze mei-yu period. The QBWO of the WPSH, the East Asian westerly jet, and the low-level southerly center exerted important influences on the heavy rainfall processes during the extended mei-yu period (Ding et al., 2021). Further EEMD analysis (not shown) suggests the ISO and QBWO components account for 11.9% and 10.7%, respectively, of the total covariance of the daily rainfall during June?July. As suggested by Zhang et al. (2020), the QBWO is an intrinsic mode of the atmosphere in boreal summer in the off-equatorial Indo–western Pacific region, while the MJO is the most unstable mode in the equatorial region. The MJO may provide a favorable background for the QBWO by altering the mean state over the off-equatorial western Pacific region.
The evolution of the SSTAs in the tropical central and eastern Pacific suggest a transition of ENSO phase from a warm condition to a cold condition in 2020 (Figs. 2a–d). The La Ni?a condition developed in the second half of 2020 (L’Heureux et al., 2021). Meanwhile, the SST over the tropical Indian Ocean has been persistently warming during May–July 2020 (Zhang et al., 2021a). The atmospheric circulation anomalies during the mei-yu season in 2020 (Fig. 2e–h) show that the WPSH is abnormally strong, with anomalous southwesterly winds transporting abundant moisture from the western Pacific via the South China Sea to the Yangtze River Basin. Meanwhile, under the influence of a persistent blocking pattern over the Ural Mountains and the Sea of Okhotsk (Ding et al., 2021), an intrusion of cold air from the Kara Sea was forced southward and converged with the warm and moist air transported by the anomalous southwesterly winds to the south of the Yangtze River Basin, leading to the strong mei-yu rainfall in 2020.
 Figure2. (a–d) Global SST (shading; units: °C), uv850 (vectors; units: m s?1), and (e–h) H500 anomalies (shading; units: gpm) in (a, e) May, (b, f) June, (c, g) July, and (d, h) June?July 2020.
4.1. MJO
The MJO exhibited distinct anomalous propagation during the early summer of 2020. As shown in Fig. 3a, the MJO slowly propagated eastward, which was in phase 1 at the end of May 2020. During the whole mei-yu season (June to July), the MJO was persistently active over the western hemisphere and the western Indian Ocean, corresponding to phases 1 and 2 of MJO (Fig. 3a). Compared with their climatology in 1981–2010, the frequencies of phases 1 and 2 during the mei-yu season (June?July) of 2020 were about two times greater than those of their climatology (Fig. 3b). Meanwhile, the MJO is also associated with the ESMI (Fig. 4). Consistent with Fig. 3, the ESMI was continuously abnormally strong, mostly in phases 1 and 2 of MJO, suggesting that phases 1 and 2 of MJO are linked with a strong Eastern Asian subtropical monsoon and mei-yu. The composite of ESMI at eight phases of strong MJO with amplitude larger than one, during the warm season (May–October) of 1980–2019 (not shown) suggests that on average, the ESMI is positive in phases 1?2 of the MJO. The relations are similar for June?July of 2020, implying robustness of the relationship between ESMI and MJO phases 1?2. The ESMI represents the moisture convergence associated with both warm air from southern China and cold air from northern China, thus the circulation anomaly over both south and north of the MLRYR is associated with the ESMI. Taking 2010 as an example, the ESMI is negative under frequent MJO phases 1?2 during June?July, which is connected with the more southward location of the WPSH and the horizontal circulation anomaly over the East Asian westerly region (not shown). Corresponding to the weak ESMI, a weak positive rainfall anomaly took place in the MLRYR during June?July of 2010 (not shown). Figure3. (a) Daily variation of MJO phases during May-August in 2020 and (b) frequency of MJO phases 1?2 during June?July 2020 (red bars) and their corresponding 1981?2010 climatology (blue bars) (units: days).
 Figure4. Daily values of ESMI [units: kg (m s)?1] in the different phases of MJO during June?July of 2020.
To further understand the statistical connection of the MJO phases 1?2 with the mei-yu anomaly, Fig. 5 displays the composites of the circulation anomalies in MJO phases 1?2 during June?July of 1979–2020. In MJO phases 1?2, strong positive geopotential height anomalies in the middle troposphere are present over the tropical northwestern Pacific, the South China Sea, the Bay of Bengal, and the Arabian Sea consistent with an anomalously strong WPSH. The resulting circulation brought anomalously abundant moisture into the MLRYR from the northwestern Pacific via the South China Sea, leading to anomalous rainfall over the MLRYR. The anomalous rainfall is mainly associated with anomalous moisture transport from the northwestern Pacific via the South China Sea. By taking June?July 2020 as an example, corresponding to the frequent MJO phases 1?2, the anomalous moisture transported by the southerly wind along the western extent of the WPSH accounts for more than 40% of the total moisture flux over the MLRYR (not shown), which results in extreme mei-yu. This is consistent with the statistical relation and with Liang et al. (2020). Meanwhile, the rainfall anomalies are amplified by the abnormal moisture transport from the Bay of Bengal. The low-level circulation anomaly during MJO phases 1?2 (Fig. 5) is similar to that during 2020 mei-yu (Fig. 2d) along the tropical Indian-Pacific Oceans and the subtropical areas of the Asian continent. Moreover, from a long-term statistical perspective, the dominance of phases 1?2 in the 2020 mei-yu, shown in Figs. 3, 4, may be connected with the development of La Ni?a and the warming in the tropical Indian Ocean in 2020. This will be discussed further in the upcoming subsections.
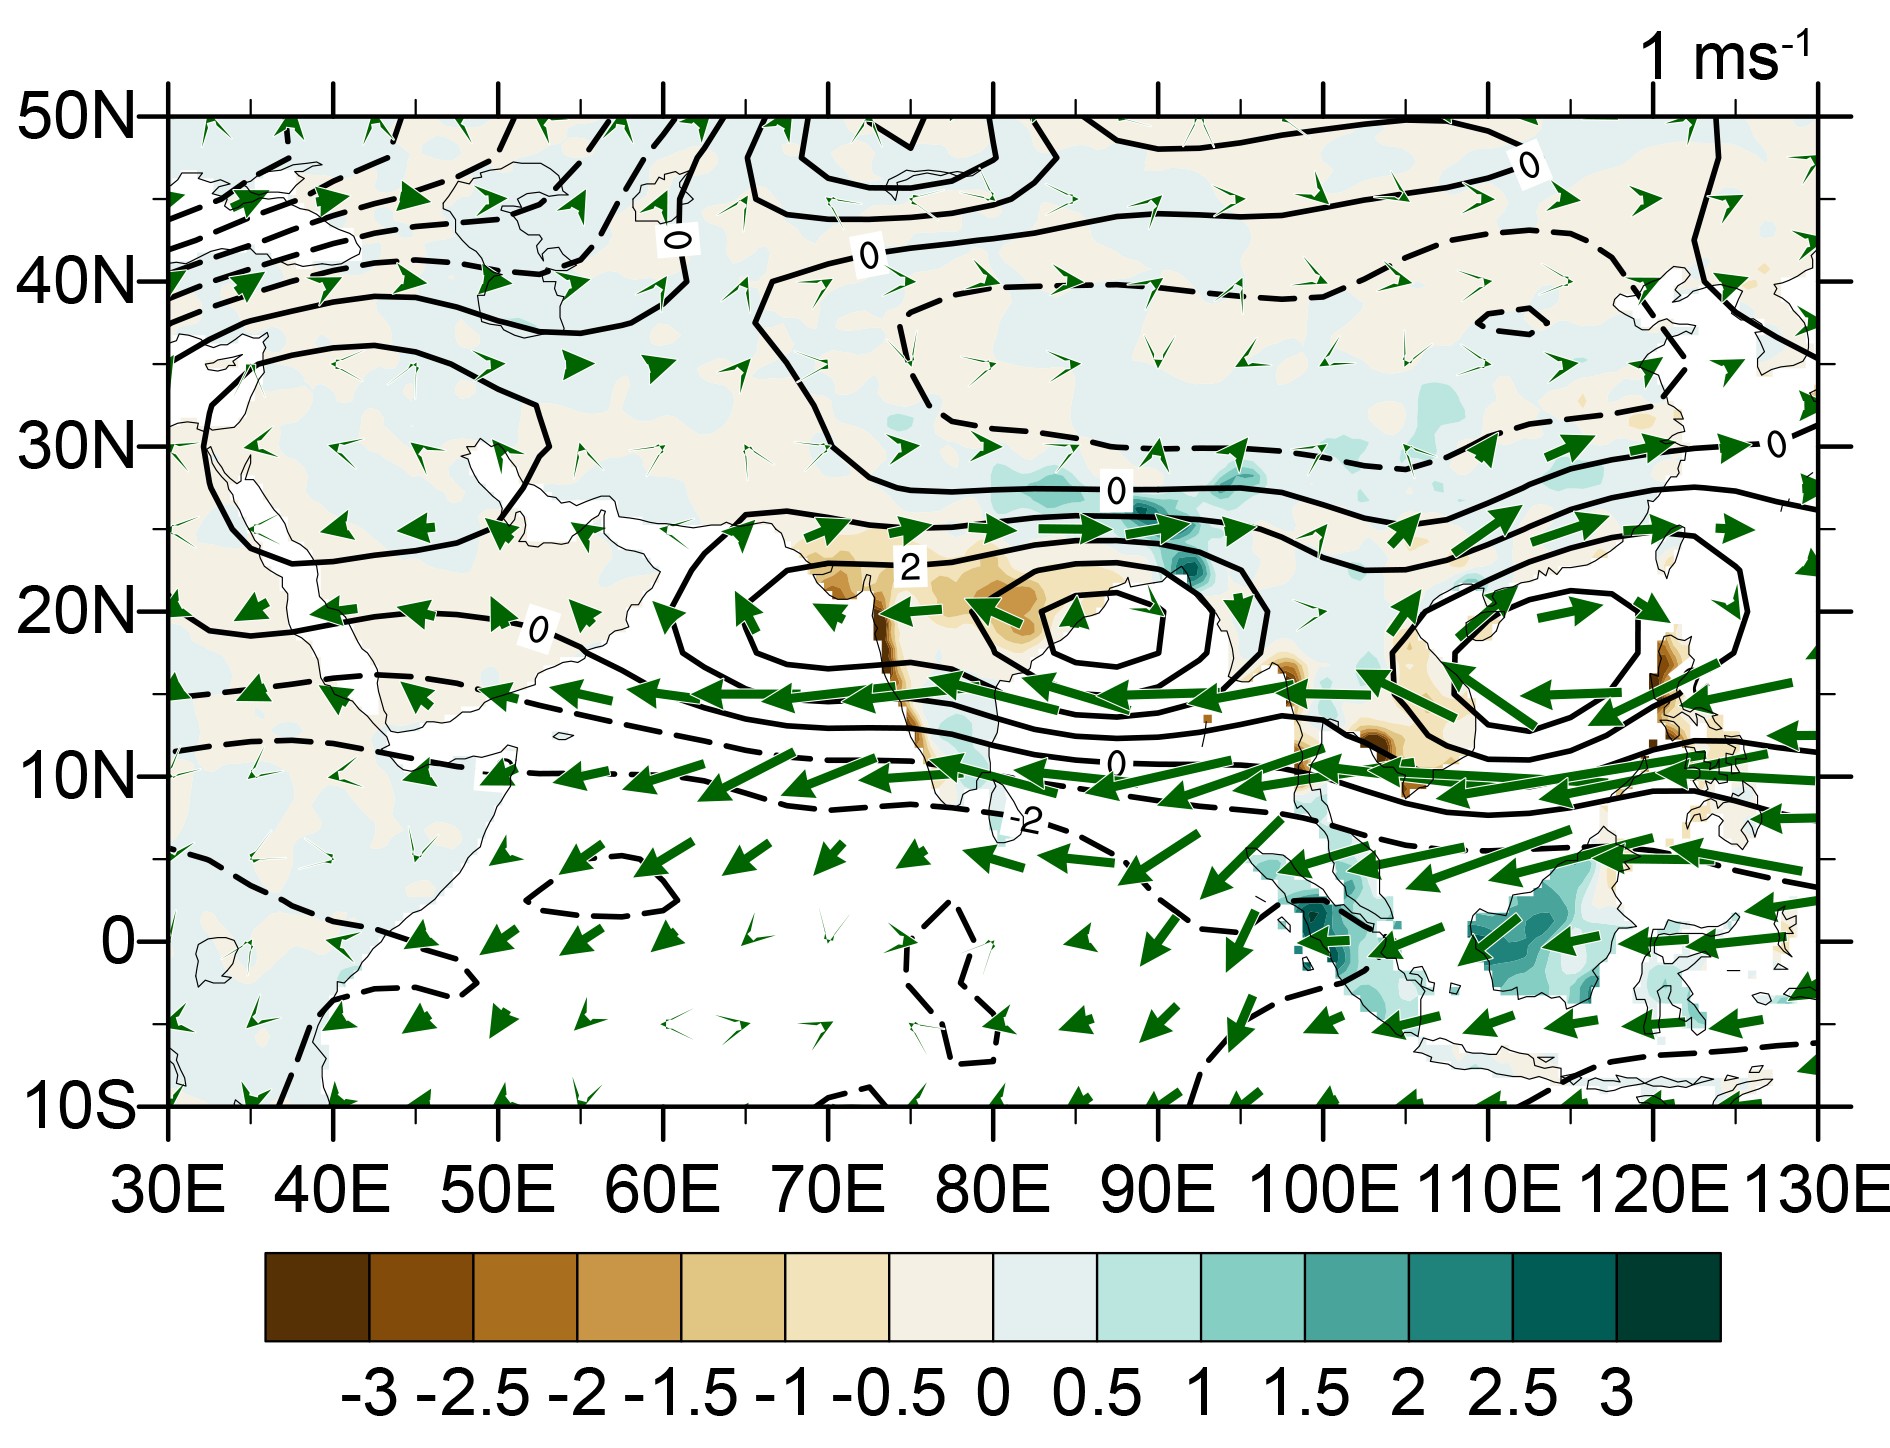 Figure5. Anomalous composites of H500 (contour; units: gpm), rainfall (shading; units: mm d?1), and uv850 (vector; units: m s?1) in MJO phases 1?2 during June?July of 1979–2020.
2
4.2. Influences of La Ni?a development
During 2020, ENSO transitioned from a warm condition to a cold condition with a La Ni?a emerging in the second half of 2020 (L’Heureux et al., 2021). To further examine the impact of the developing phase of La Ni?a on mei-yu, the frequencies of various MJO phases in June?July of seven La Ni?a developing years during 1979–2020 are analyzed (Figs. 6, 7a, b). It can be seen that MJO phases 1?2 are more favorable than other phases (Fig. 6a) under La Ni?a developing conditions (Fig. 7a). That may imply that during summers that feature a developing La Ni?a, the eastward propagation of MJO is restricted, resulting in long-lived MJO phases 1?2 which favors abundant rainfall over the MLRYR (Fig. 5). This idea is consistent with Yoo et al. (2010) who found that the MJO has different characteristics in the different phases of the ENSO cycle. For example, the eastward propagation of MJO is less favorable in La Ni?a rather than in El Ni?o conditions. Figure6. (a) Frequency (days) of different MJO phases during June?July of seven La Ni?a developing years and, (b) their average in comparison with 2020 and the 1981–2010 climatology.
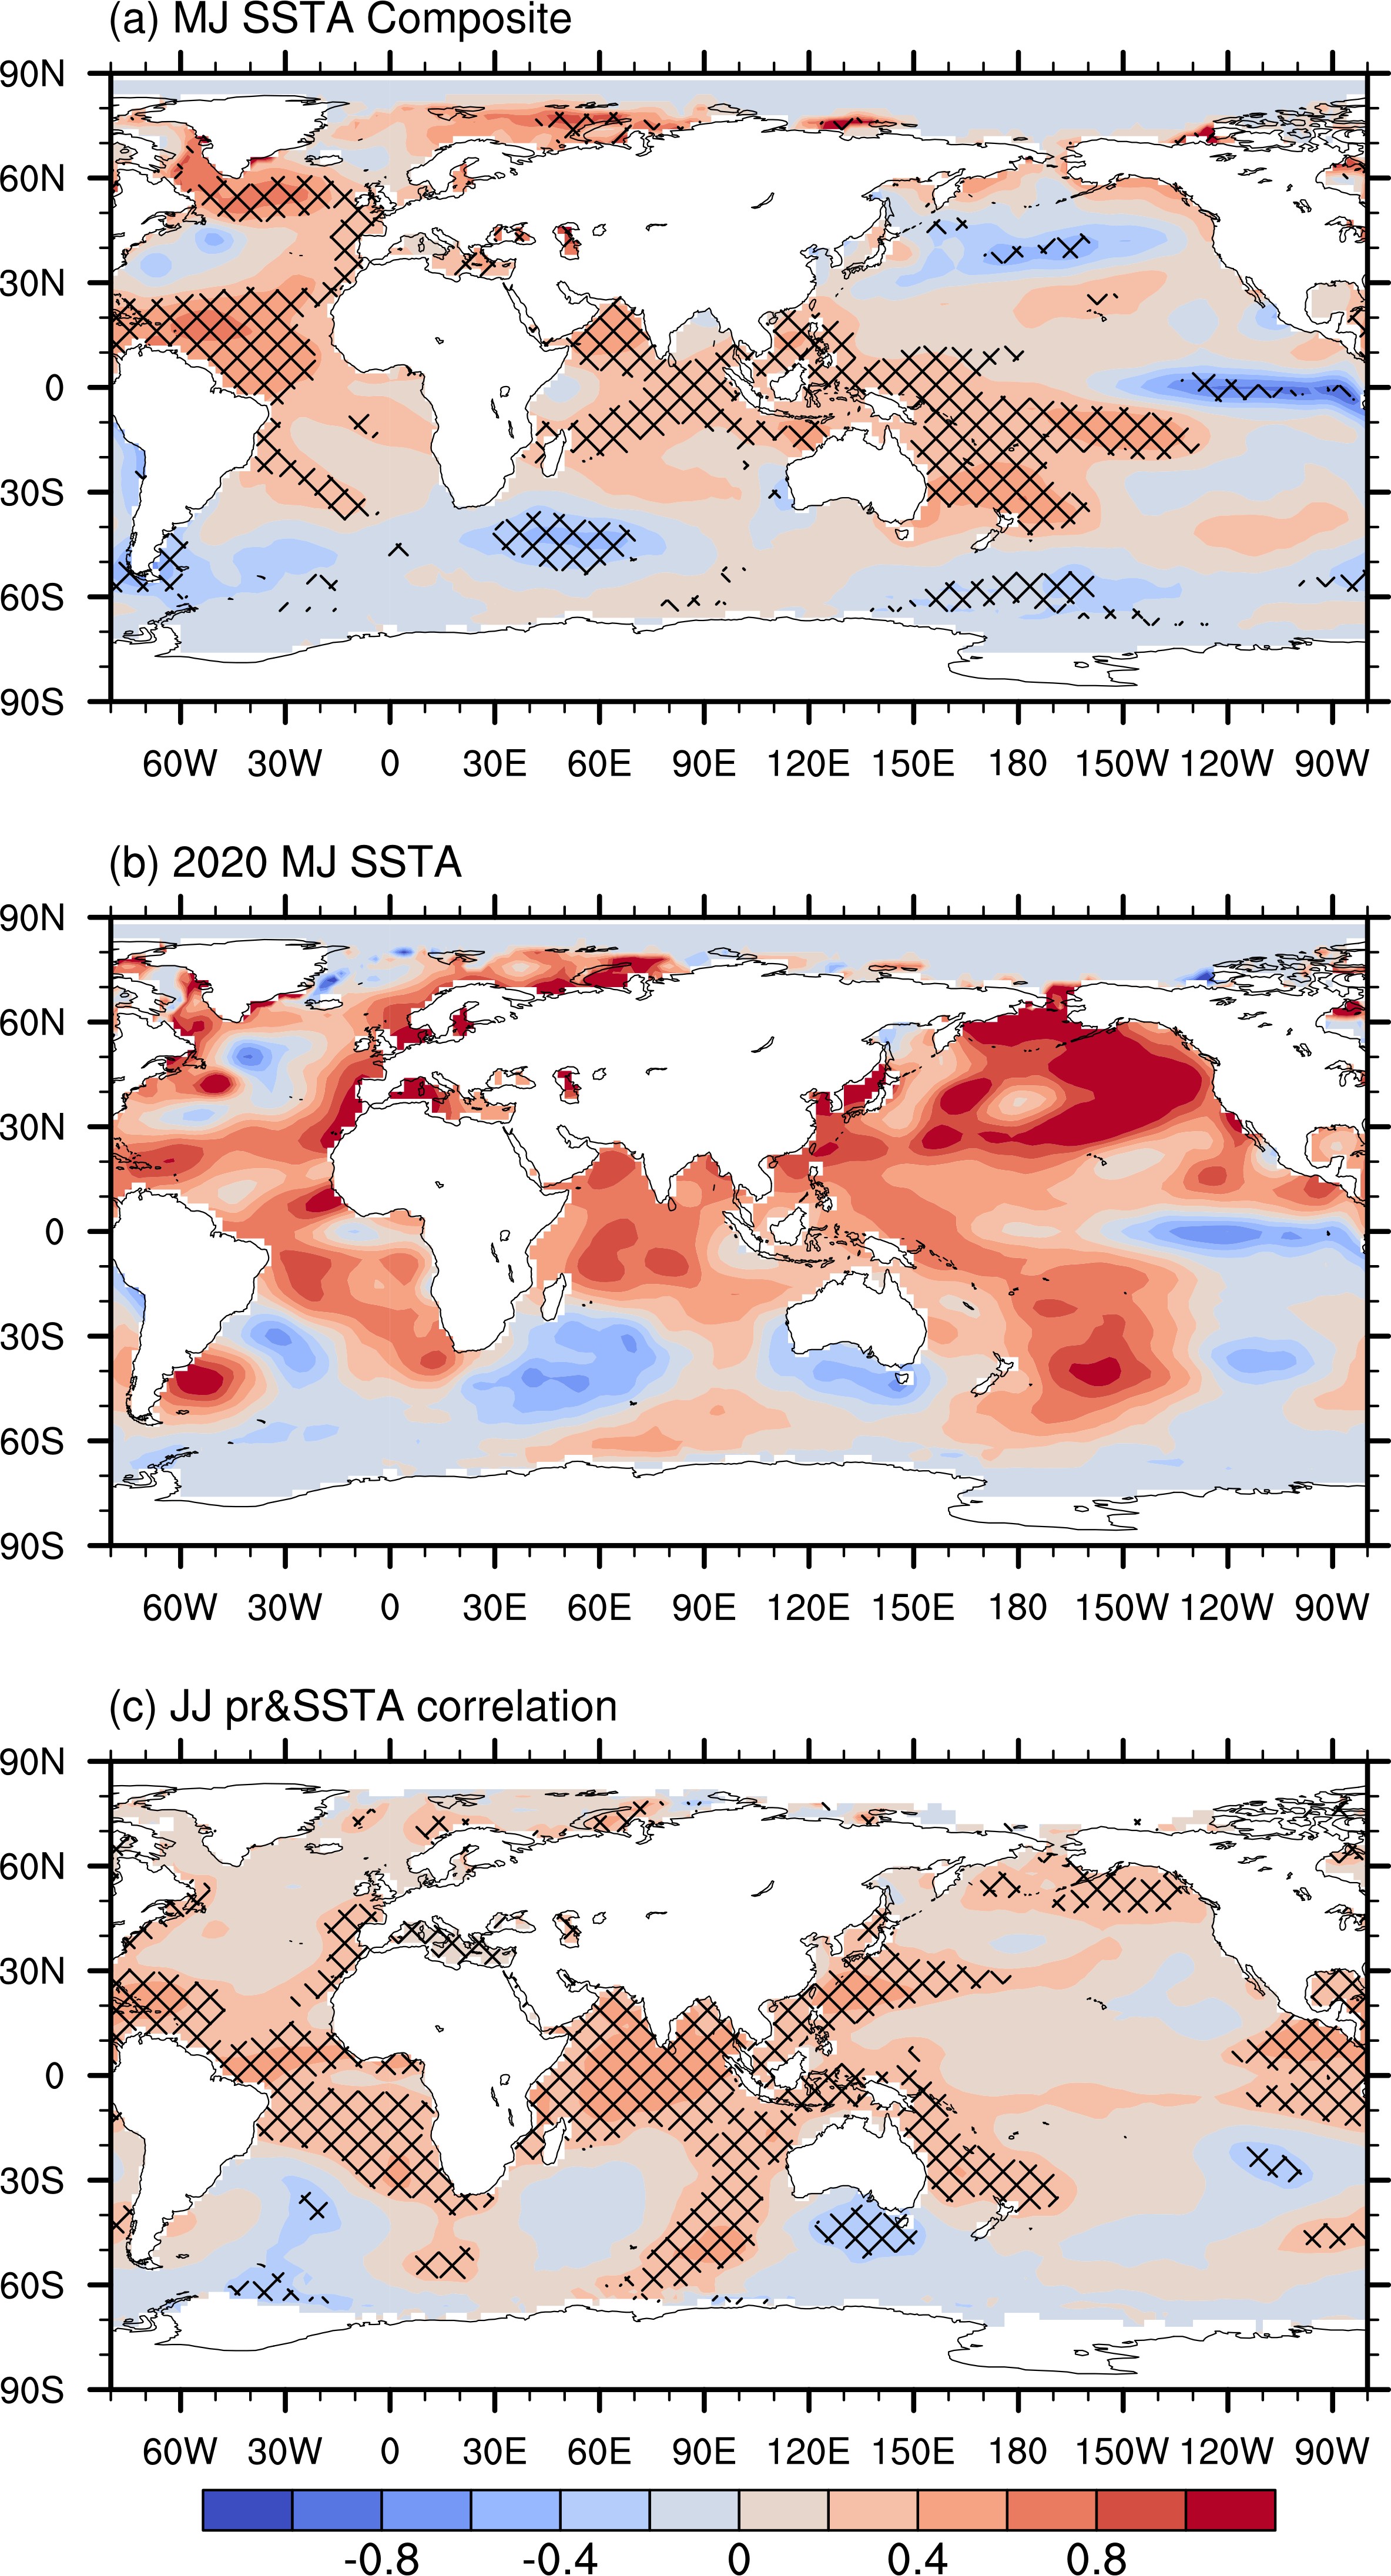 Figure7. (a) Composites of SSTA in May?June (units: °C) of seven La Ni?a developing years, (b) SSTA in May?June 2020, and (c) simultaneous correlation of June?July rainfall anomaly average in the middle and lower reaches of the Yangtze River with SSTA during 1981–2020. Hatches in (a) and (c) represent the significance at the level of 95% using a T-test.
The occurrence frequencies of MJO phases 1 and 2 seem to be connected with the cooling tendency in the tropical central and eastern Pacific from boreal winter (December–February, DJF) to the late spring and early summer (April–June, AMJ). Historically, on the other hand, the SSTAs in the central-western tropical Pacific can be modulated by MJO events that originated from the tropical Indian Ocean (Zhang et al., 2021b). Figure 8 shows the interannual variations of the cooling tendency and frequencies of MJO phases 1?2. The cooling tendency is denoted by the Ni?o-3.4 index differences between AMJ and DJF. Thereinto, the cooling tendency occurs when the Ni?o-3.4 index difference is negative. The frequencies of MJO phases 1?2 in June?July significantly correlate with the cooling tendency, with a correlation coefficient of –0.47 (significant above the 0.01 confidence level). The above mentioned slower propagation of MJO in the early summer of La Ni?a developing years is similar to that which occurs in winter (Wei and Ren, 2019) and is also consistent with what is observed during the weakening of the MJO over the western Pacific during decaying phases of El Ni?o (Gushchina and Dewitte, 2012; Wang et al., 2018).
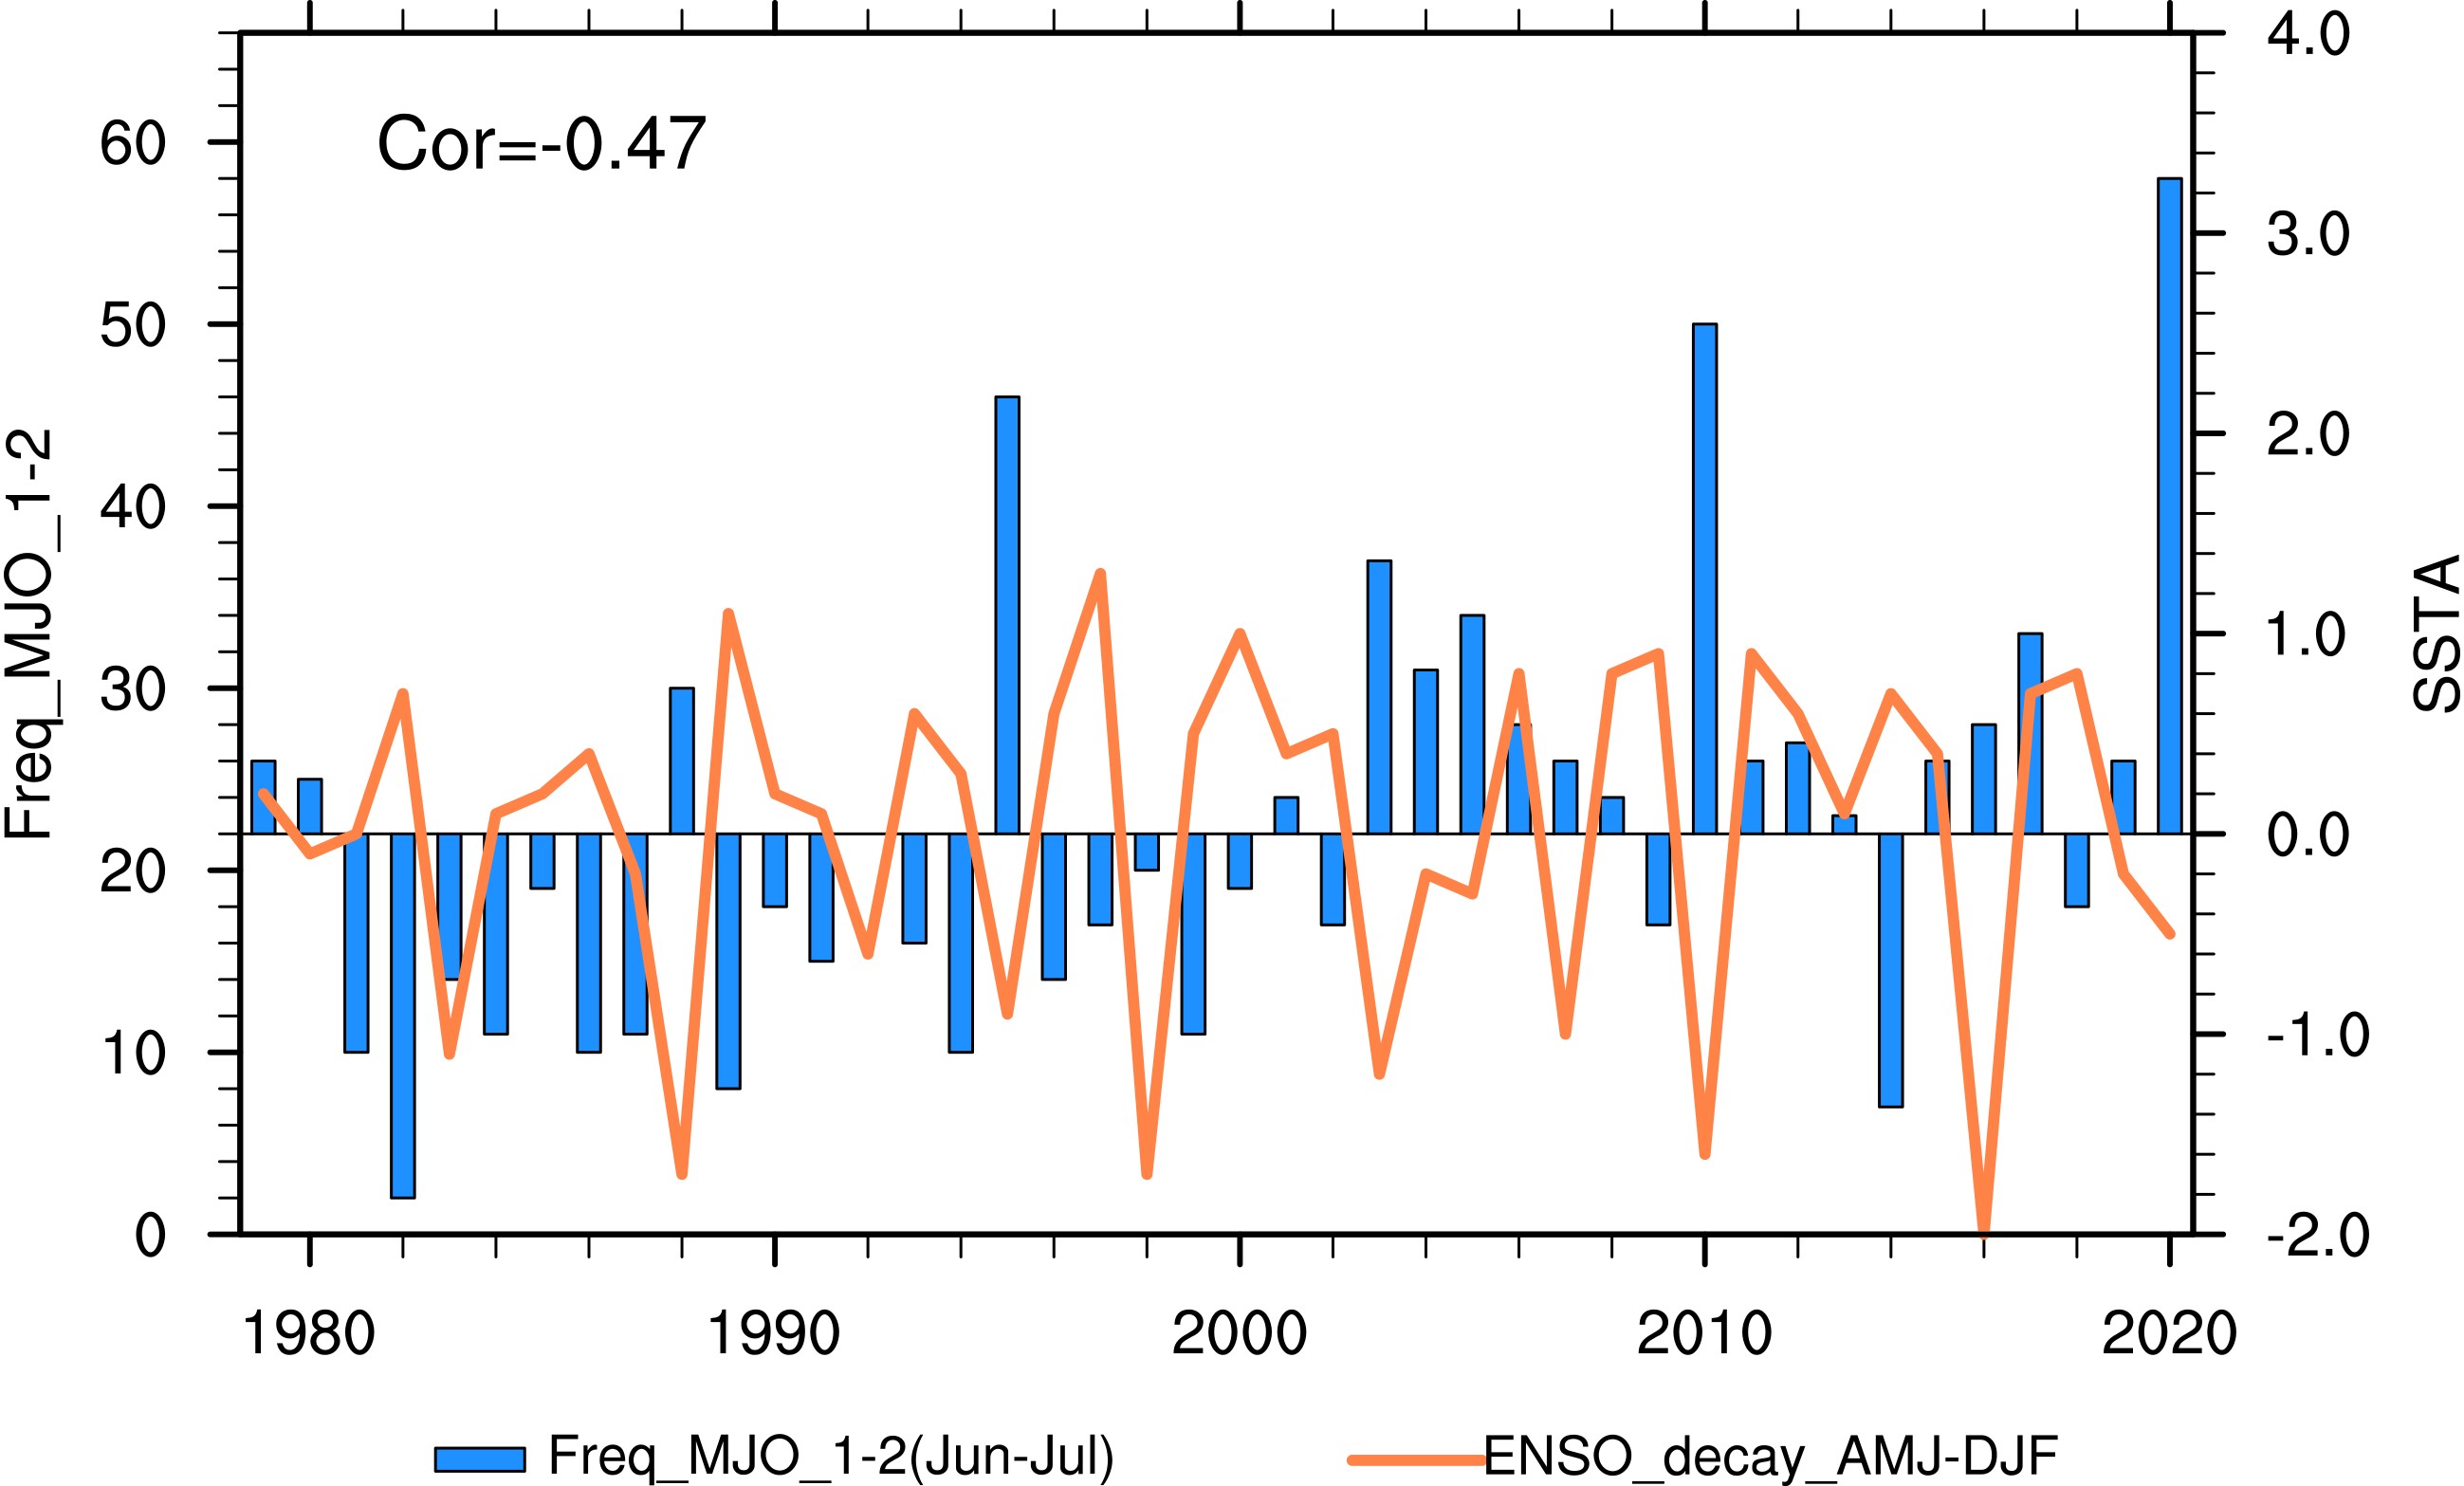 Figure8. Frequency of MJO phases 1?2 (bars, units: days) during June?July and Ni?o-3.4 index difference between April–June and preceding December–February in La Ni?a developing years (SSTA curve, units: °C).
2
4.3. Influences of the tropical Indian Ocean
In addition to the impact of the developing phase of La Ni?a, the frequency increase of MJO phases 1?2 may also be amplified by other factors, such as the warming in the tropical Indian Ocean (Fig. 7b). As shown in Figs. 7a and 7b, pronounced warming over the tropical Indian Ocean is seen in the early summer of both six historical La Ni?a developing years and 2020. Statistically, there is a significant correlation of 0.41 between SSTAs averaged in the tropical Indian Ocean (60o–90oE, 10oS–10oN) in May?June and the ESMI index in June?July (Fig. 9a), which exceeds the 0.01 significance level. By excluding the possible influence dominated by ENSO, represented by the May?June Ni?o-3.4 index, the corresponding partial correlation is 0.47, slightly higher than without excluding ENSO influence. That may suggest that SSTAs in the tropical Indian Ocean are an important factor in affecting East Asian summer climate anomalies through their influence upon the ESMI and WPSH (e.g., Hu et al., 2003). According to Takaya et al. (2020), the Indian Ocean warming condition may be traced back to the strong Indian Ocean Dipole (IOD) episode in 2019 through oceanic dynamics and monsoon modulation.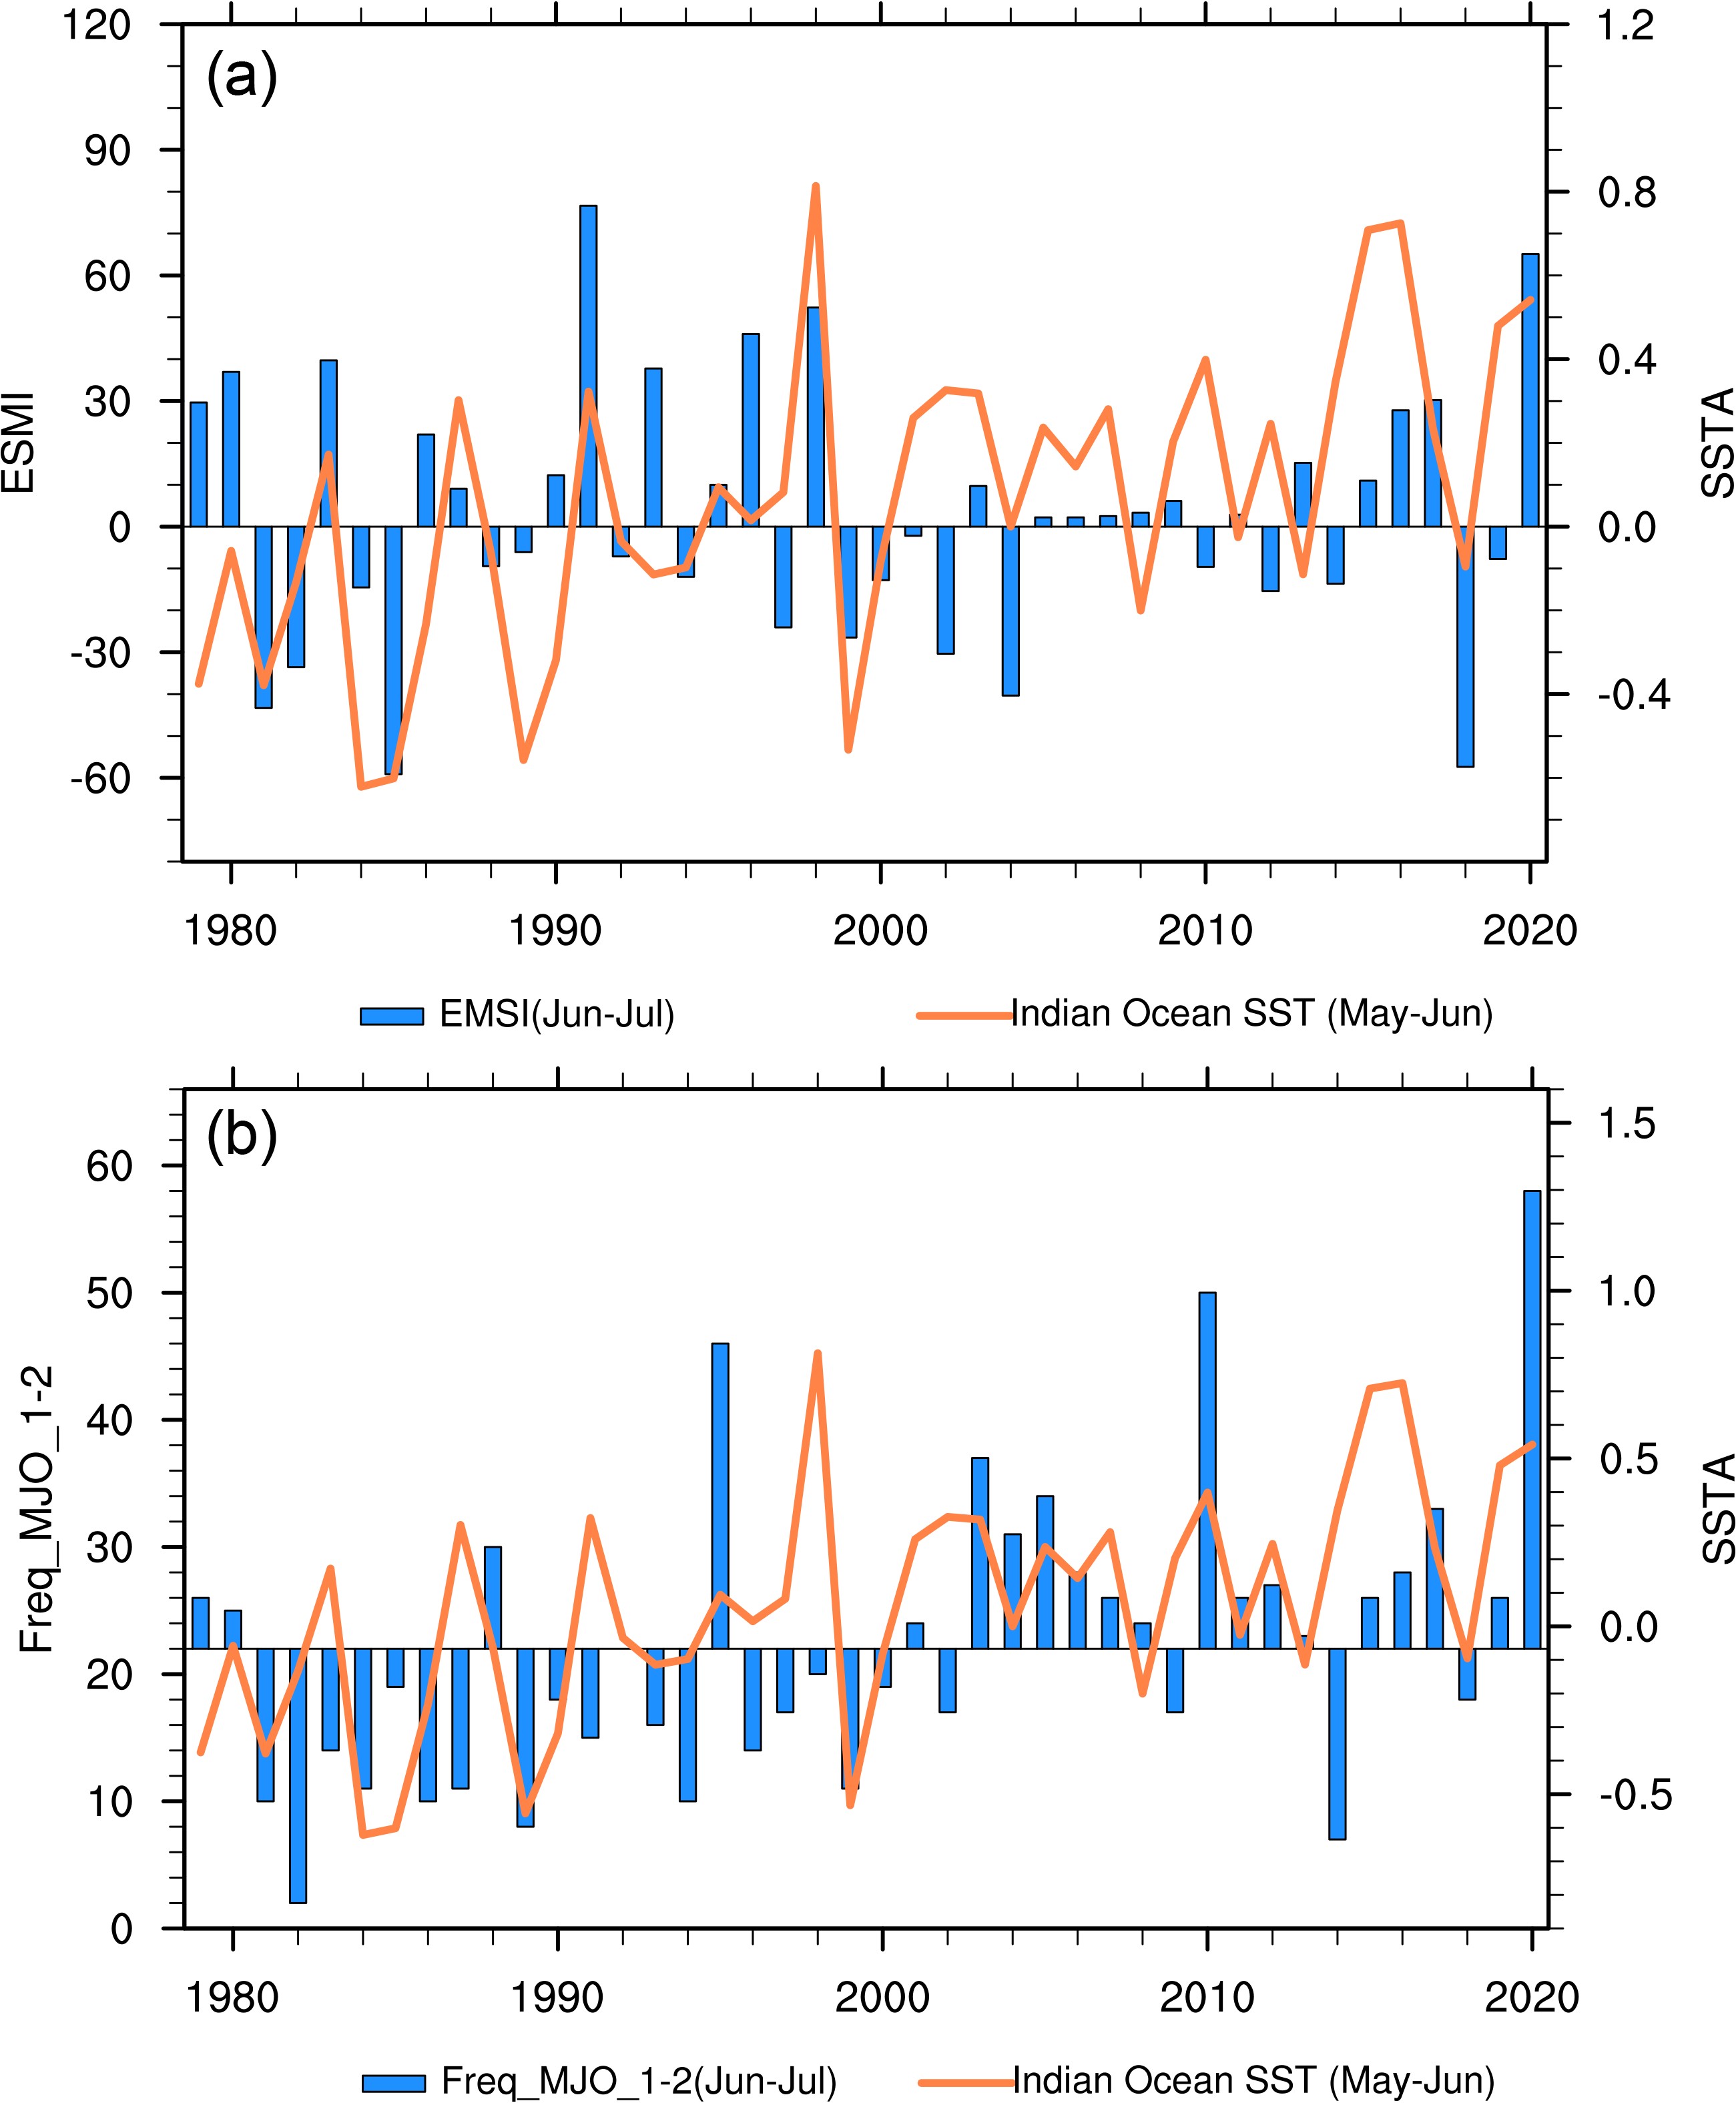 Figure9. (a) ESMI [units: kg (m s)?1] and (b) frequency (days) of MJO phases 1?2 (bars) in June?July. The curve in (a, b) denotes SSTA averaged in the tropical Indian Ocean in May?June (units: °C).
On the other hand, SST warming in the tropical Indian Ocean can also be indirectly advantageous to abundant mei-yu by increasing MJO phases 1?2. As shown in Fig. 9b, there is a significant correlation (with correlation coefficient 0.43 above 0.01 confidence level) between the SSTA averaged in the tropical Indian Ocean in May?June with the frequency of MJO phases 1?2 in June?July. By excluding the influence of ENSO represented by the Ni?o-3.4 index, the corresponding partial correlation (with correlation coefficient 0.37) is still significant. Thus, in addition to the development of La Ni?a, the warming in the tropical Indian Ocean may contribute to the 2020 extreme mei-yu through its modulation of the WPSH and consequent anchoring of the MJO (phases 1?2) in the tropical Indian Ocean. This is consistent with Yuan et al. (2014) which suggested the 850 hPa anomalous easterlies over the equatorial central Indian Ocean in association with a positive IOD can act as a barrier to the continuously eastward propagation of the intraseasonal convection, which interrupts MJO propagation in the eastern equatorial Indian Ocean and western Pacific. Nevertheless, in addition to the impacts that ENSO and Indian Ocean SSTs have on the MJO, it should be pointed out that, historically, the SSTAs in the central-western tropical Pacific and tropical Indian Oceans can be modulated by MJO events (Zhang et al., 2021b). Moreover, considering that the “moisture mode” hypothesis is a recently adopted plausible mechanism for MJO propagation (e.g., Kim, 2017), the thermodynamical processes may contribute to the MJO propagation and persistency during the 2020 mei-yu, which deserves further study.
To quantitatively estimate the influences of the Pacific and Indian Oceans on the MJO, binary linear regressions of SSTA tendency in the tropical central and eastern Pacific from DJF to AMJ and the tropical Indian Ocean SSTA in May?June onto the frequencies of MJO phases 1?2 during June?July are calculated. The linear regression reconstructed frequency of MJO phases 1?2 from June to July 2020 is 29, higher than the 1981–2010 climatological frequency (20), indicating that the cooperative influences of the Pacific and Indian Oceans are favorable for the 1?2 phases of MJO. Collectively, these may be the main sources of predictability and prediction skills for the mei-yu in 2020.
 Figure10. Rainfall anomalies of the ensemble mean of 80 members of CFSv2 real-time forecasts in June?July 2020 in (a) 1-month and (b) 3-month leads. The unit is mm d?1.
To understand the sources of the forecast skill of mei-yu rainfall in CFSv2, the correlation of June?July rainfall anomalies in the MLRYR with the SSTAs of CFSv2 hindcasts during 1982–2018 at 1- and 3-month leads are shown in Fig. 11. For the 1-month lead (Fig. 11a), the overall correlation pattern is similar to the SSTA distribution in the tropical Indian and western Pacific Oceans as shown in Fig. 3. However, in addition to spatial distribution disagreement between Figs. 7 and 11 in the tropical Indian and western Pacific Oceans, the negative correlations in the tropical central and eastern Pacific in the 1-month lead become positive in the 3-month lead. This implies that the connections of mei-yu anomalies with SSTAs in the tropical Indian and Pacific Oceans are only partially captured in CFSv2. That may be one of the reasons that explain why the 2020 Meiyu rainfall anomaly is only quantitatively captured with underestimated amplitude in CFSv2.
 Figure11. Simultaneous correlation of June?July rainfall anomaly in the middle and lower reaches of the Yangtze River (the red rectangle in (a), 28.75°–32.75°N, 112.75°–121.25°E) with SSTAs of CFSv2 forecasts during January 1982–December 2018 in (a) 1-month and (b) 3-month leads. The hatches denote the significance at the level of 95% using a T-test.
In fact, in addition to the biases in capturing the connection of mei-yu rainfall with SSTAs in the tropical Indian and Pacific Oceans, the internal dynamics-driven variability may be an important factor resulting in the low prediction skill, which is evident in AMIP simulations. AMIP model simulations are a reasonable approach to estimate the impact of SST on climate variability and the potential for climate prediction (Peng et al., 2000). Figure 12a shows the simultaneous correlations of the June?July rainfall anomaly over the MLRYR with SSTAs of a 17-member ensemble mean of the AMIP simulations. The similarity between Fig. 7c and Figs. 11 and 12 implies that both the real-time forecast in CFSv2 and the AMIP simulation capture the connection between rainfall and the MJO with a 1-month lead. Both significantly positive and negative correlations are present over the tropical Indian and western Pacific Oceans, and the tropical central and eastern Pacific Ocean, respectively. This is similar to that in the observations (Fig. 7) and confirms that the connection of SSTAs over the tropical Indian and Pacific Oceans with the mei-yu rainfall variability.
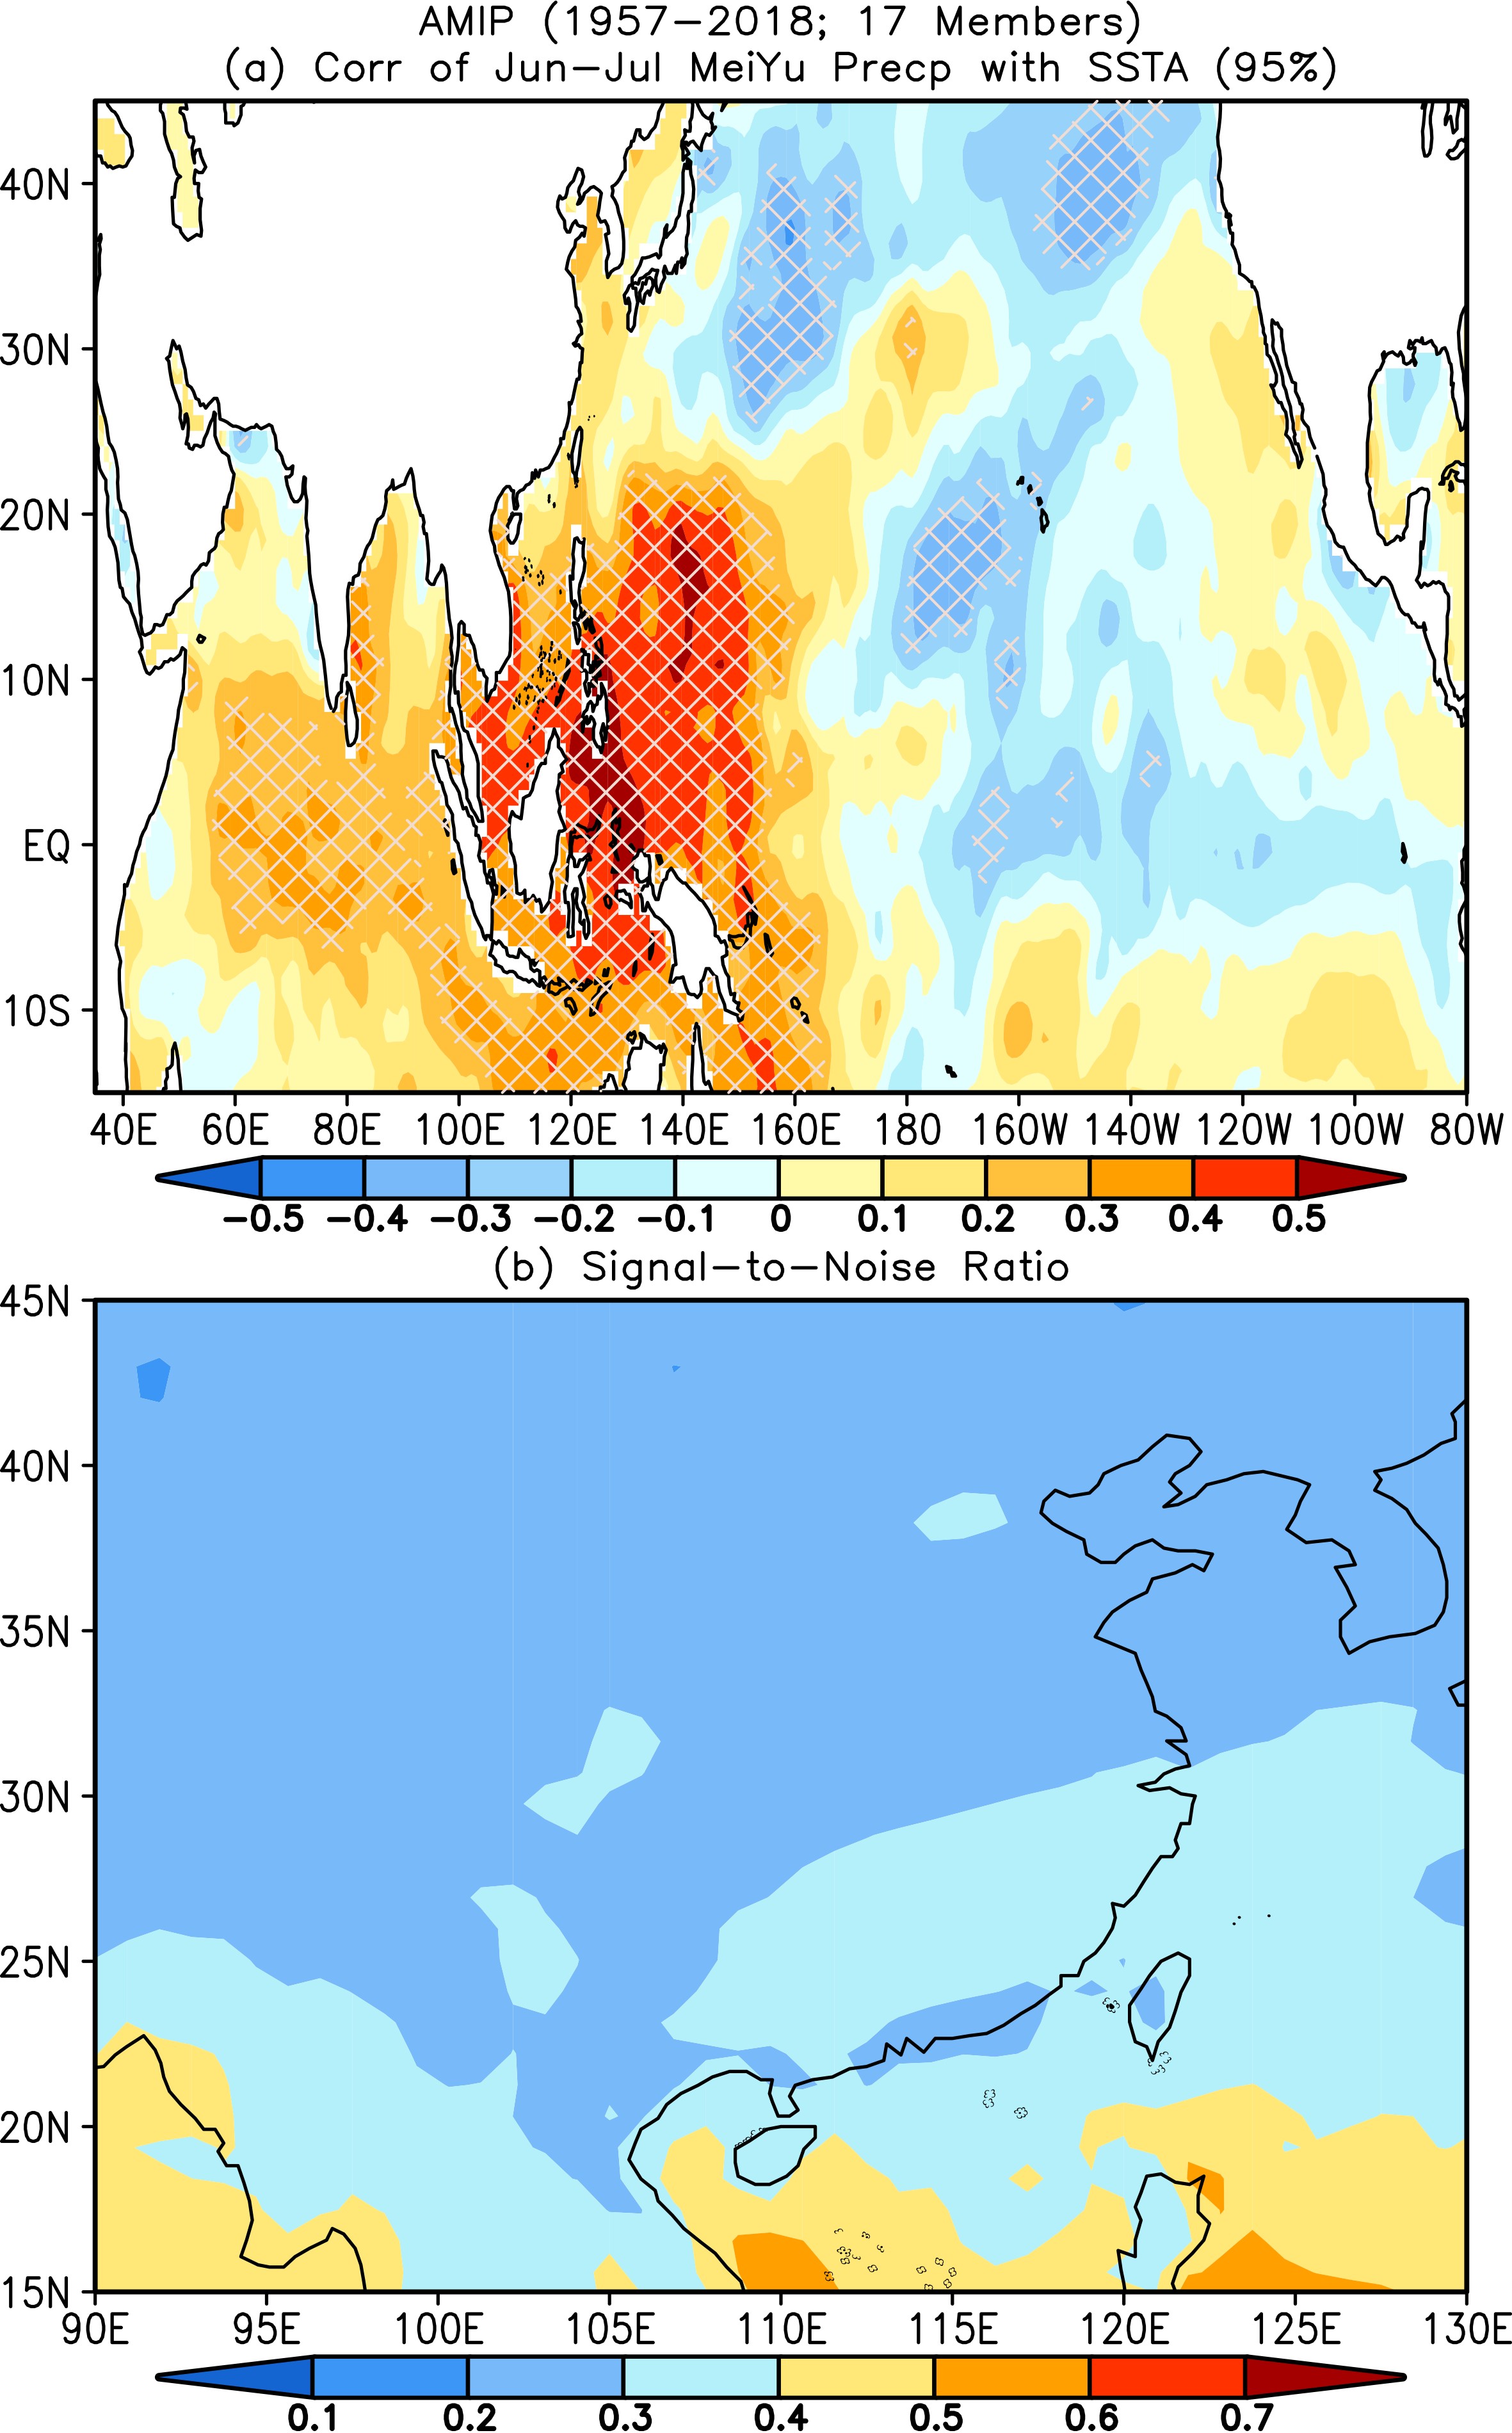 Figure12. (a) Simultaneous correlation of June?July rainfall anomaly averaged in the middle and lower reaches of the Yangtze River with SSTA of the ensemble mean of 17-members of the AMIP simulations during January 1957–December 2018. (b) The signal-to-noise ratio of the rainfall anomalies of the AMIP simulations during January 1957–December 2018. The signal is referred to as the standard deviation of the ensemble mean anomaly of 17 members, and the noise is defined as the standard deviation of the departure of each of the 17 members from the ensemble mean. The hatches in (a) denote the significance at the level of 95% using a T-test.
To further assess the predictability of the mei-yu rainfall anomaly, the signal-to-noise ratio (SNR) of mei-yu rainfall anomalies in June?July in the AMIP simulations is shown in Fig. 12b. The signal is referred to as the standard deviation of the ensemble mean anomaly of 17 members, which represents the response to SSTA. While the noise is defined as the standard deviation of the departure of each of the 17 members from the ensemble mean and it is mainly associated with the variability driven by the internal dynamical processes. The SNR is about 30% over the MLRYR. This suggests that at sub-seasonal and inter-seasonal time scales, the atmospheric internal processes (which is less predictable or unpredictable) play a more important role than the boundary forcing (such as SSTA in the tropical Indian and Pacific Oceans which is largely predictable) in the variability of mei-yu rainfall anomaly (e.g., Liang et al., 2019). This may be the primary mechanism responsible for the underestimation of the 2020 extreme mei-yu rainfall in the real-time forecasts of CFSv2.
During the 2020 mei-yu season, a strong WPSH and persistent blocking type circulation over the Ural Mountains and the Sea of Okhotsk contributed to persistent moisture convergence. Warm moist air transported by low-level southwesterly wind anomalies converged with cold air intrusions over the Yangtze River Basin, leading to the extreme mei-yu rainfall. The strengthening of the WPSH is associated with the development of La Ni?a and the warming in the tropical Indian Ocean, which play an anchoring role to keep the MJO nearly phase locked in the tropical Indian Ocean. During June?July 2020, the daily frequency of MJO phases 1?2 is two times greater than climatology which contributes to an anomalously strong WPSH and the corresponding abundant moisture transports to the mei-yu region. The development of La Ni?a slows down the eastward propagation of the MJO and leads to the long-lived MJO phases 1?2. In addition to the direct enhancement of East Asian subtropical monsoon, the warming in the tropical Indian Ocean may also be indirectly advantageous to the abundant mei-yu by increasing the frequency of MJO phases 1?2. The MJO directly induced the extreme mei-yu in 2020, which is consistent with Zhang et al. (2021b). The cooperative influences of the Pacific and Indian Oceans on the persistent MJO phases 1?2 are proposed through analyzing the historical data in 1979–2020. Therefore, besides the seasonal circulation background, the Pacific and Indian Oceans may indirectly affect the mei-yu by impacting the persistence of MJO phases 1?2.
The 2020 mei-yu rainfall anomalies can be quantitatively captured in the ensemble mean of the CFSv2 real-time forecast at lead times of a few months. However, the extreme amount of 2020 mei-yu rainfall is seriously underestimated in the forecasts. This may be associated with physical processes that the model is unable to reproduce regarding the connections of mei-yu rainfall with the warming in the tropical Indian Ocean and La Ni?a development and MJO activity. It has previously been reported that the skillful MJO predictions are attainable at lead times of approximately 3–4 weeks (Wang et al., 2014; Lim et al., 2018). Aside from the poor prediction of the tropical SSTAs with a two-month lead in CFSv2, the skillful prediction of MJO shorter than one month may also contribute to the low prediction skill in CFSv2 beyond a one-month lead. The MJO prediction skills are affected by both the MJO amplitude and phase errors, with the latter becoming more important at longer lead forecasts (Lim et al., 2018). Thus, the prediction skill of the MJO during the extreme mei-yu may be reduced due to prediction errors of the anomalously persistent MJO phases 1?2, which further impacts the prediction of mei-yu rainfall. More importantly, the AMIP simulations suggest that atmospheric internal processes may play a more important role than the boundary forcing (such as SSTA in the tropical Indian and Pacific Oceans) in the variability of mei-yu rainfall anomaly, which implies coherent low predictability for rainfall over the extratropical land areas, as discussed in Liang et al. (2019) and Hu et al. (2020).
Acknowledgements. The authors appreciate the constructive comments and insightful suggestions from the reviewers and editor. This work was jointly supported by the National Key Research and Development Plan “Major Natural Disaster Monitoring, Warning and Prevention” (2017YFC1502301), the Natural Science Foundation of Shanghai (21ZR1457600), the National Natural Science Foundation of China under Grant No. 41790471 and 41775047, and China Three Gorges Corporation (Grant No. 0704181). The AMIP simulations are provided by the NOAA Climate Prediction Center and conducted by Dr. B. JHA.
