HTML
--> --> -->The primary factors that influence the precipitation variability over the South African monsoon region are attributed to El Ni?o-Southern Oscillation (ENSO), the intensity and position of the intertropical convergence zone (ITCZ), the south Indian Ocean convergence zone (SICZ), and subtropical Mascarene High (Fig. 1c; Jury and Pathack, 1991; Reason and Rouault, 2002; Fauchereau et al., 2009; Zhang et al., 2015; Hart et al., 2018; Li et al., 2018, 2020). The SICZ appears as a northwest-southeast oriented cloud band, also known as the tropical-temperate trough, that extends from tropical East Africa to the subtropical SWIO (Mason and Jury, 1997; Lindesay, 1988; Cook, 2001; Barimalala et al., 2018) (Fig. 1c). However, since previous attempts to understand the mechanisms of precipitation variability over the South African monsoon regime have focused mainly on the continent portion (e.g., Jury, 1992; Reason and Mulenga, 1999; Fauchereau et al., 2009; Hansingo and Reason, 2009), the possible impactors of the precipitation variability in the SWIO remain unclear.
To better understand the information recorded in the paleo-hydroclimate records from the SWIO, such as speleothem records from remote Rodrigues Island (63.4°E, 19.7°S), we apply modern observations to diagnose the possible factors that influence the high amplitude interannual precipitation variability over the region. The rest of this manuscript is organized as follows: in section 2, we introduce the datasets and methods. In section 3, we define the SWIO and investigate the possible impact factors on the interannual precipitation over the SWIO. In section 4, the discussion and conclusion are presented.
The composites are used to highlight the differences between wet and dry years. The two-sided Student’s t-test was used to estimate the statistical significance of results from the composites analysis. Following the previous studies (Pang et al., 2018; Sun et al., 2019; Hu et al., 2020), the linear baroclinic model (LBM) (Watanabe and Kimoto, 2000) was employed to investigate the steady atmospheric response to the idealized diabatic heating under a given mean state. As a simple dry atmospheric model with linearized primitive equations, the LBM distinctly reflects the fundamental physical processes, which has been widely used to analyze climate processes in the tropical zones (e.g., Wang et al., 2016; Guo et al., 2019). The three-dimensional basic state was chosen as the local rainy season of January?April, and the idealized heating function employed is elliptical in the horizontal and strongest at 500 hPa in the vertical direction (e.g., Hu et al., 2020). The horizontal resolution for the LBM is T42, and there are 20 unevenly spaced sigma levels in the vertical. The LBM was run for 30 days using time integration methods, and the 850 hPa wind in the last day (i.e., day 30) regarded as a steady response.
3.1. Rainy season over Rodrigues Island and SWIO
Rodrigues Island, which is approximately 2500 km east of East Africa and 1600 km east of Madagascar (Fig. 1a), serves as a natural meteorological station to record the climate change over the tropical SWIO. The precipitation over Rodrigues Island exhibits a unimodal rainy season, which lasts from January to April (JFMA), with a peak in February (Fig. 1b). Approximately 73% of total annual rainfall over Rodrigues Island occurs during this local rainy season. The JFMA precipitation variance between 1979 and 2018 is as high as 2.2 mm d–1, which shows a striking deviation from the mean value (Fig. 1b). Namely, the largest interannual variation of precipitation in each month occurs in the rainy season, JFMA, resulting in frequent droughts and floods (Fig. 1b).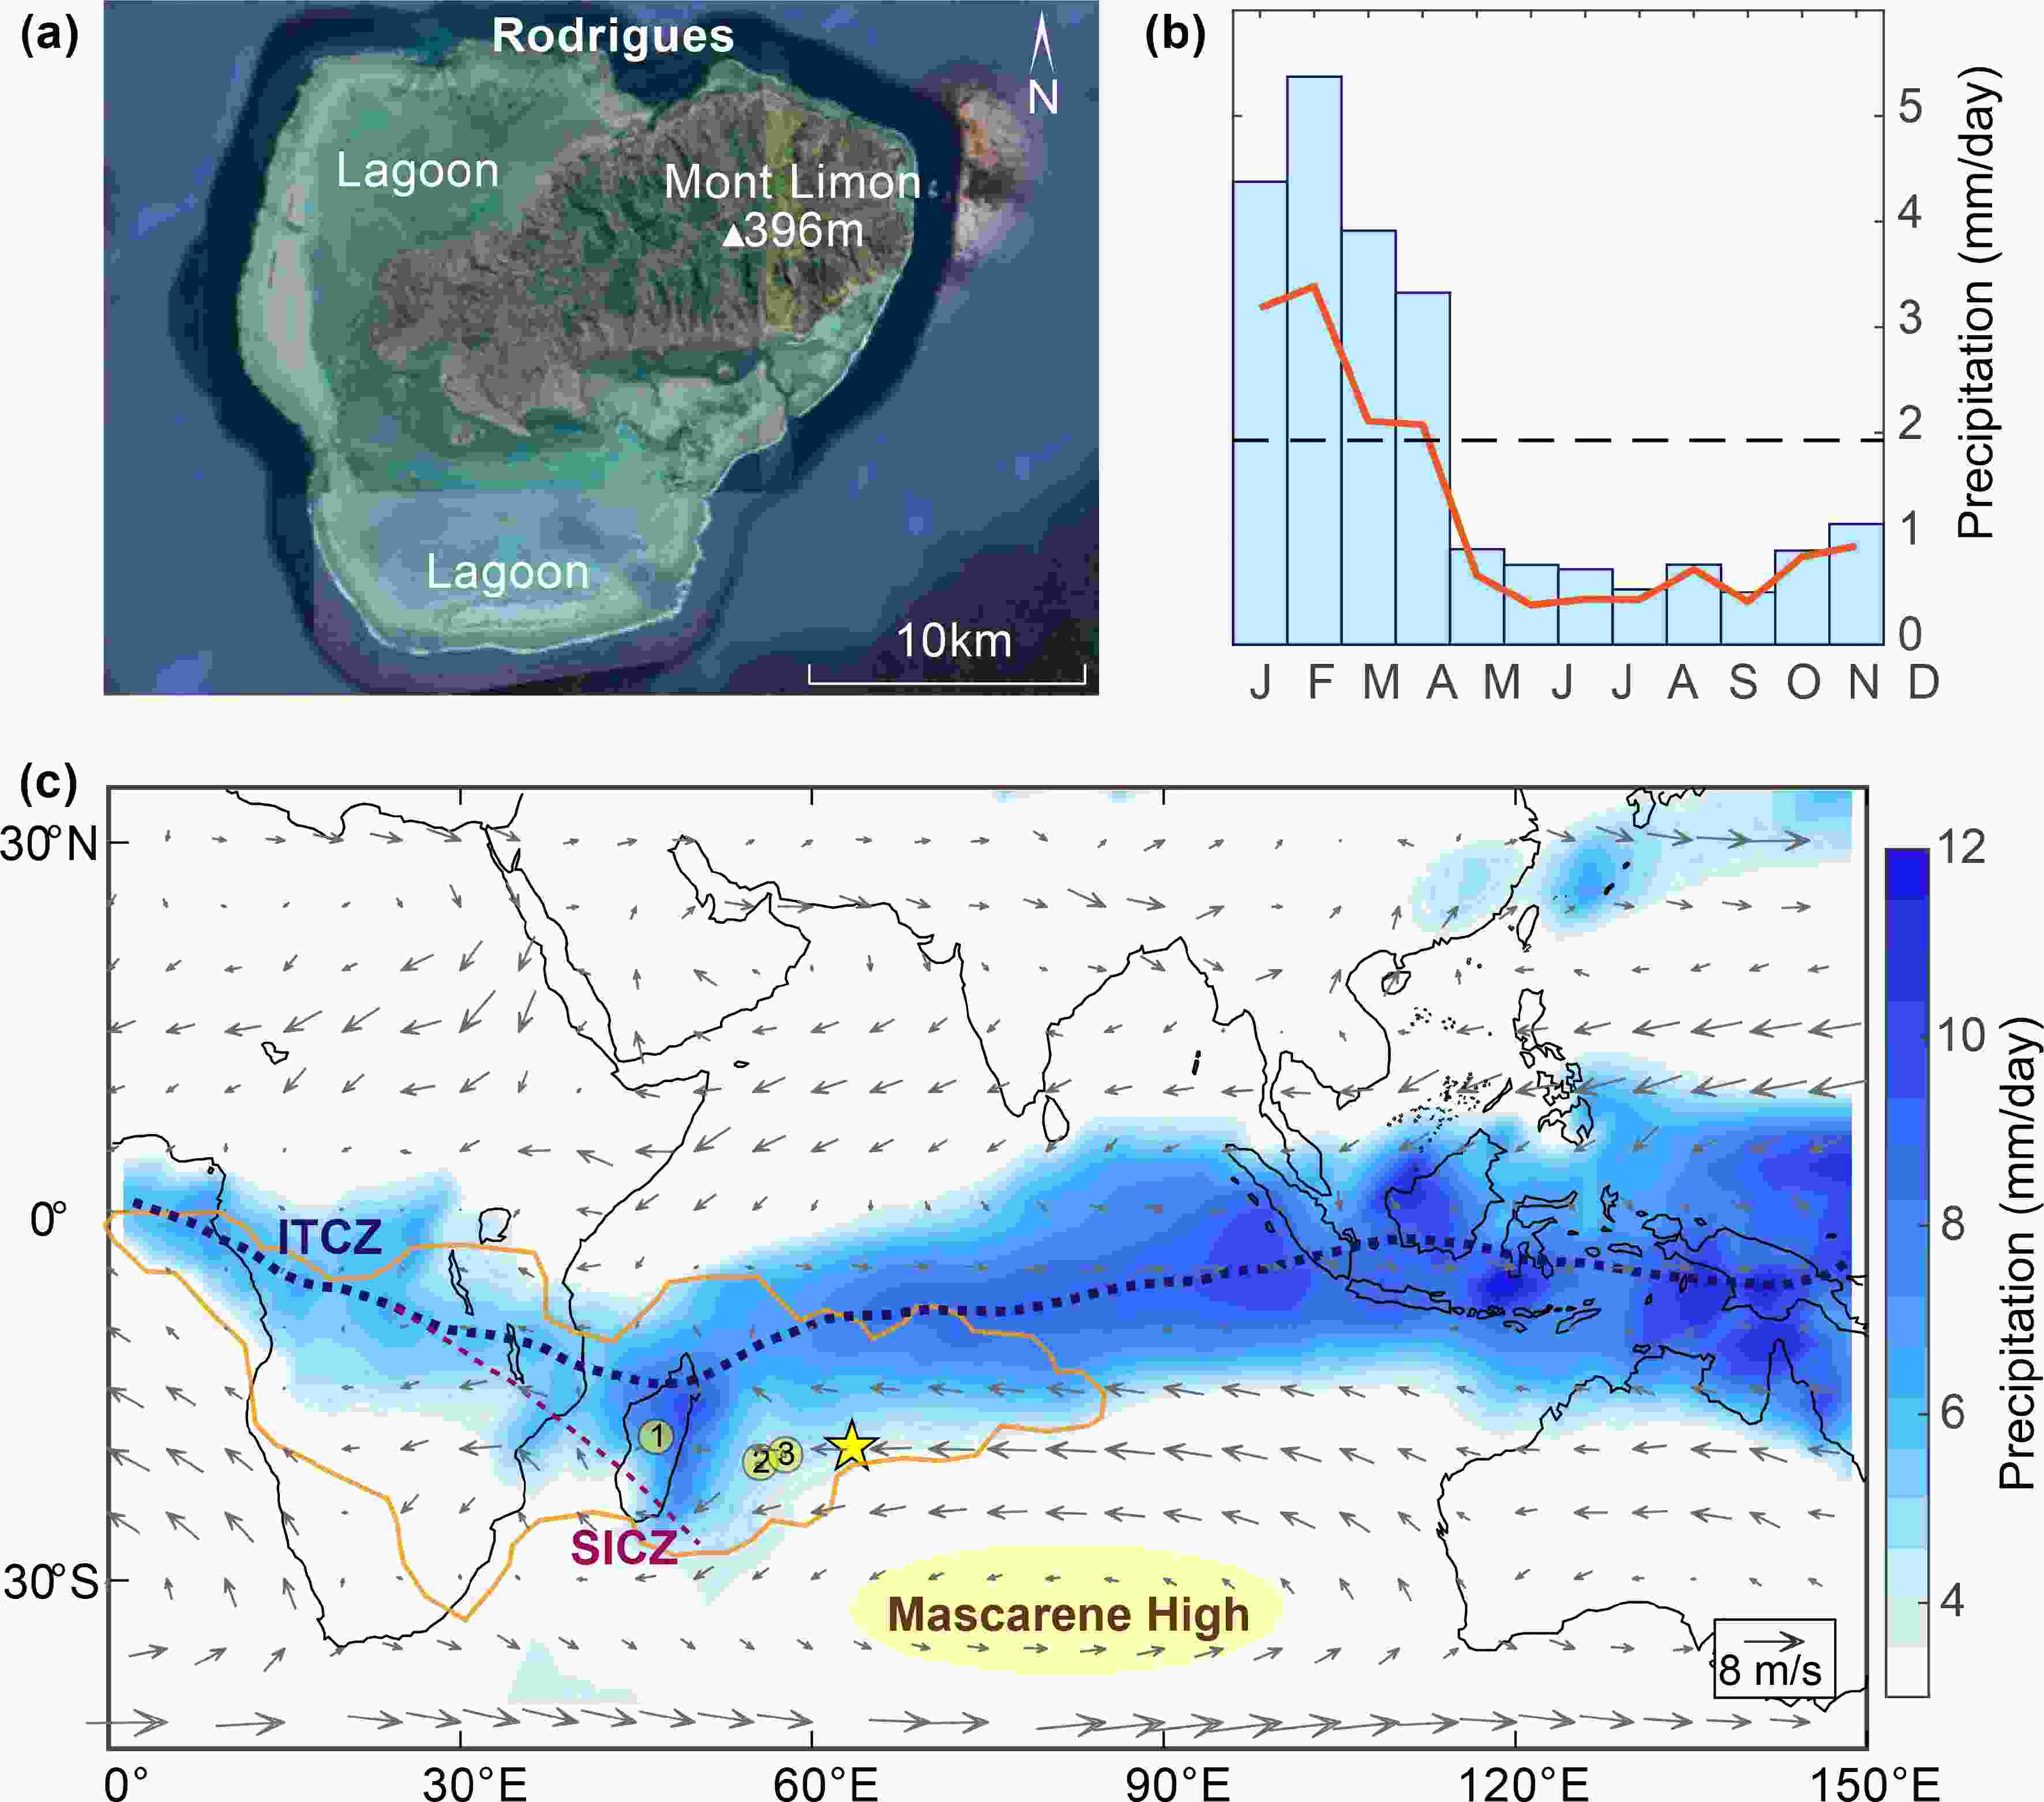 Figure1. Geographic and climatological context of the study area. (a) Google earth image of Rodrigues and surrounding lagoon. Mont Limon, as the highest place (~396 m) on the island is shown. (b) Climatology of precipitation (blue bars) with one standard deviation in each month mean (red curve) between 1979 and 2018 derived from CAMP dataset. The annual mean precipitation (1.9 mm d–1) is shown by the horizontal dashed line. (c) Climatology of 850 hPa winds (arrows) and precipitation (shading) for January?February?March?April (JFMA) mean for the period 1979 to 2018. ITCZ and SICZ are marked with dashed lines, and Mascarene High is highlighted in yellow shading. The South African monsoon region is outlined by the solid orange line (Wang et al., 2012). Circles with numbers 1 to 3 and star mark Madagascar, Réunion, Mauritius, and Rodrigues Island.
The JFMA mean rainfall over Rodrigues Island exhibits prominent interannual variations during the period from 1979 to 2018. Nine anomalous wet years (1979, 1980, 1982, 1987, 1991, 1995, 1996, 2015, 2018) and dry years (1984, 1993, 1999, 2000, 2001, 2008, 2009, 2016, 2017) were selected by setting the threshold of 0.8 standard deviation (Fig. 2a). The correlation of normalized OLR and vertical velocity with precipitation from the nearest grid point of Rodrigues Island is ?0.85 and ?0.70, respectively, and both correlation coefficients are significant at the 95% confidence intervals ranging between ?0.73 and ?0.92 and between ?0.49 and ?0.83, respectively (Fig. 2b). These high correlations confirm that the CMAP precipitation at Rodrigues Island is consistent with the ERA-Interim reanalysis data's atmospheric dynamics.
 Figure2. Climate variations over Rodrigues Island between 1979 and 2018. (a) z-scored time series of JFMA mean precipitation derived from the nearest grid of Rodrigues Island. The anomalous wet (dry) years with rainfall amount higher (lower) than 0.8 standard deviations (horizontal dashed lines) are shaded by deeper green (brown) color and shown in the upper (lower) corner of the panel. (b) Comparison of JFMA mean precipitation (grey bars) with OLR and vertical velocity at 500 hPa derived from the grid closest to Rodrigues Island. (c) Time series comparison among JFMA mean precipitation from the closest grid to the Rodrigues Island (black line) and regional average over the SWIO (blue line) as well JFMA mean SST over the SWIO (yellow line) and Ni?o-4 region (Magenta line). The correlation coefficients and 95% confidence intervals among the time-series are listed bottom at the bottom of panels (c) and (d).
The rainfall variability of Rodrigues during the rainy season is quite representative of the SWIO (45°?80°E, 10°?25°S), with a statistically significant high correlation coefficient and 95% confidence interval of 0.67 (0.46?0.81), respectively. Modulated by the ITCZ and the SICZ further southward, deep convective rainfall over the SWIO is produced when the easterly trade wind forced by the Mascarene High converges with cross-equator northwest winds converting from northeasterly winds originally from the northern Indian Ocean (Fig. 1c). Being far from the core of the ITCZ and SICZ, Rodrigues Island sits along the southern boundary of the tropical rainfall belt (Sb-TRB, the 4 mm d–1 isohyet during the rainy season) (Li et al., 2020). The north-south shift of the Sb-TRB characterizes the prominent rainfall variability of the SWIO as well as tropical Africa. Located in the core of shifting region of the Sb-TRB (Li et al., 2020), the rainfall variability of Rodrigues Island is attributable to the same source as that of the SWIO.
2
3.2. The teleconnection between precipitation over the SWIO and tropical Pacific
To detect the possible mechanism that may modulate the precipitation during the local rainy season over the SWIO, composited JFMA anomalies in precipitation, SST, OLR, velocity potential, and divergent wind at 200 hPa and 850 hPa were computed between wet and dry years as mentioned above (Figs. 3 and 4). Considering that the rainfall variability of Rodrigues Island is an ideal representative of rainfall pattern over the SWIO (Fig. 3a) (Li et al., 2020), we utilized composite analysis based on the years of Rodrigues rainfall anomaly to investigate the controlling mechanisms of interannual rainfall variability over the SWIO. Figure3. Composited spatial patterns: JFMA spatial pattern between wet and dry years is a composite of precipitation (a) SST, (b) OLR, (c) vertical velocity at 500 hPa, and (d) winds at 850 hPa. Star shows the location of Rodrigues Island. Stippling in (a) to (d), as well as winds in (d), indicates significant differences at 90% confidence level. Green box in each subpanel represents the SWIO (45°?80°E and 10°?25°S).
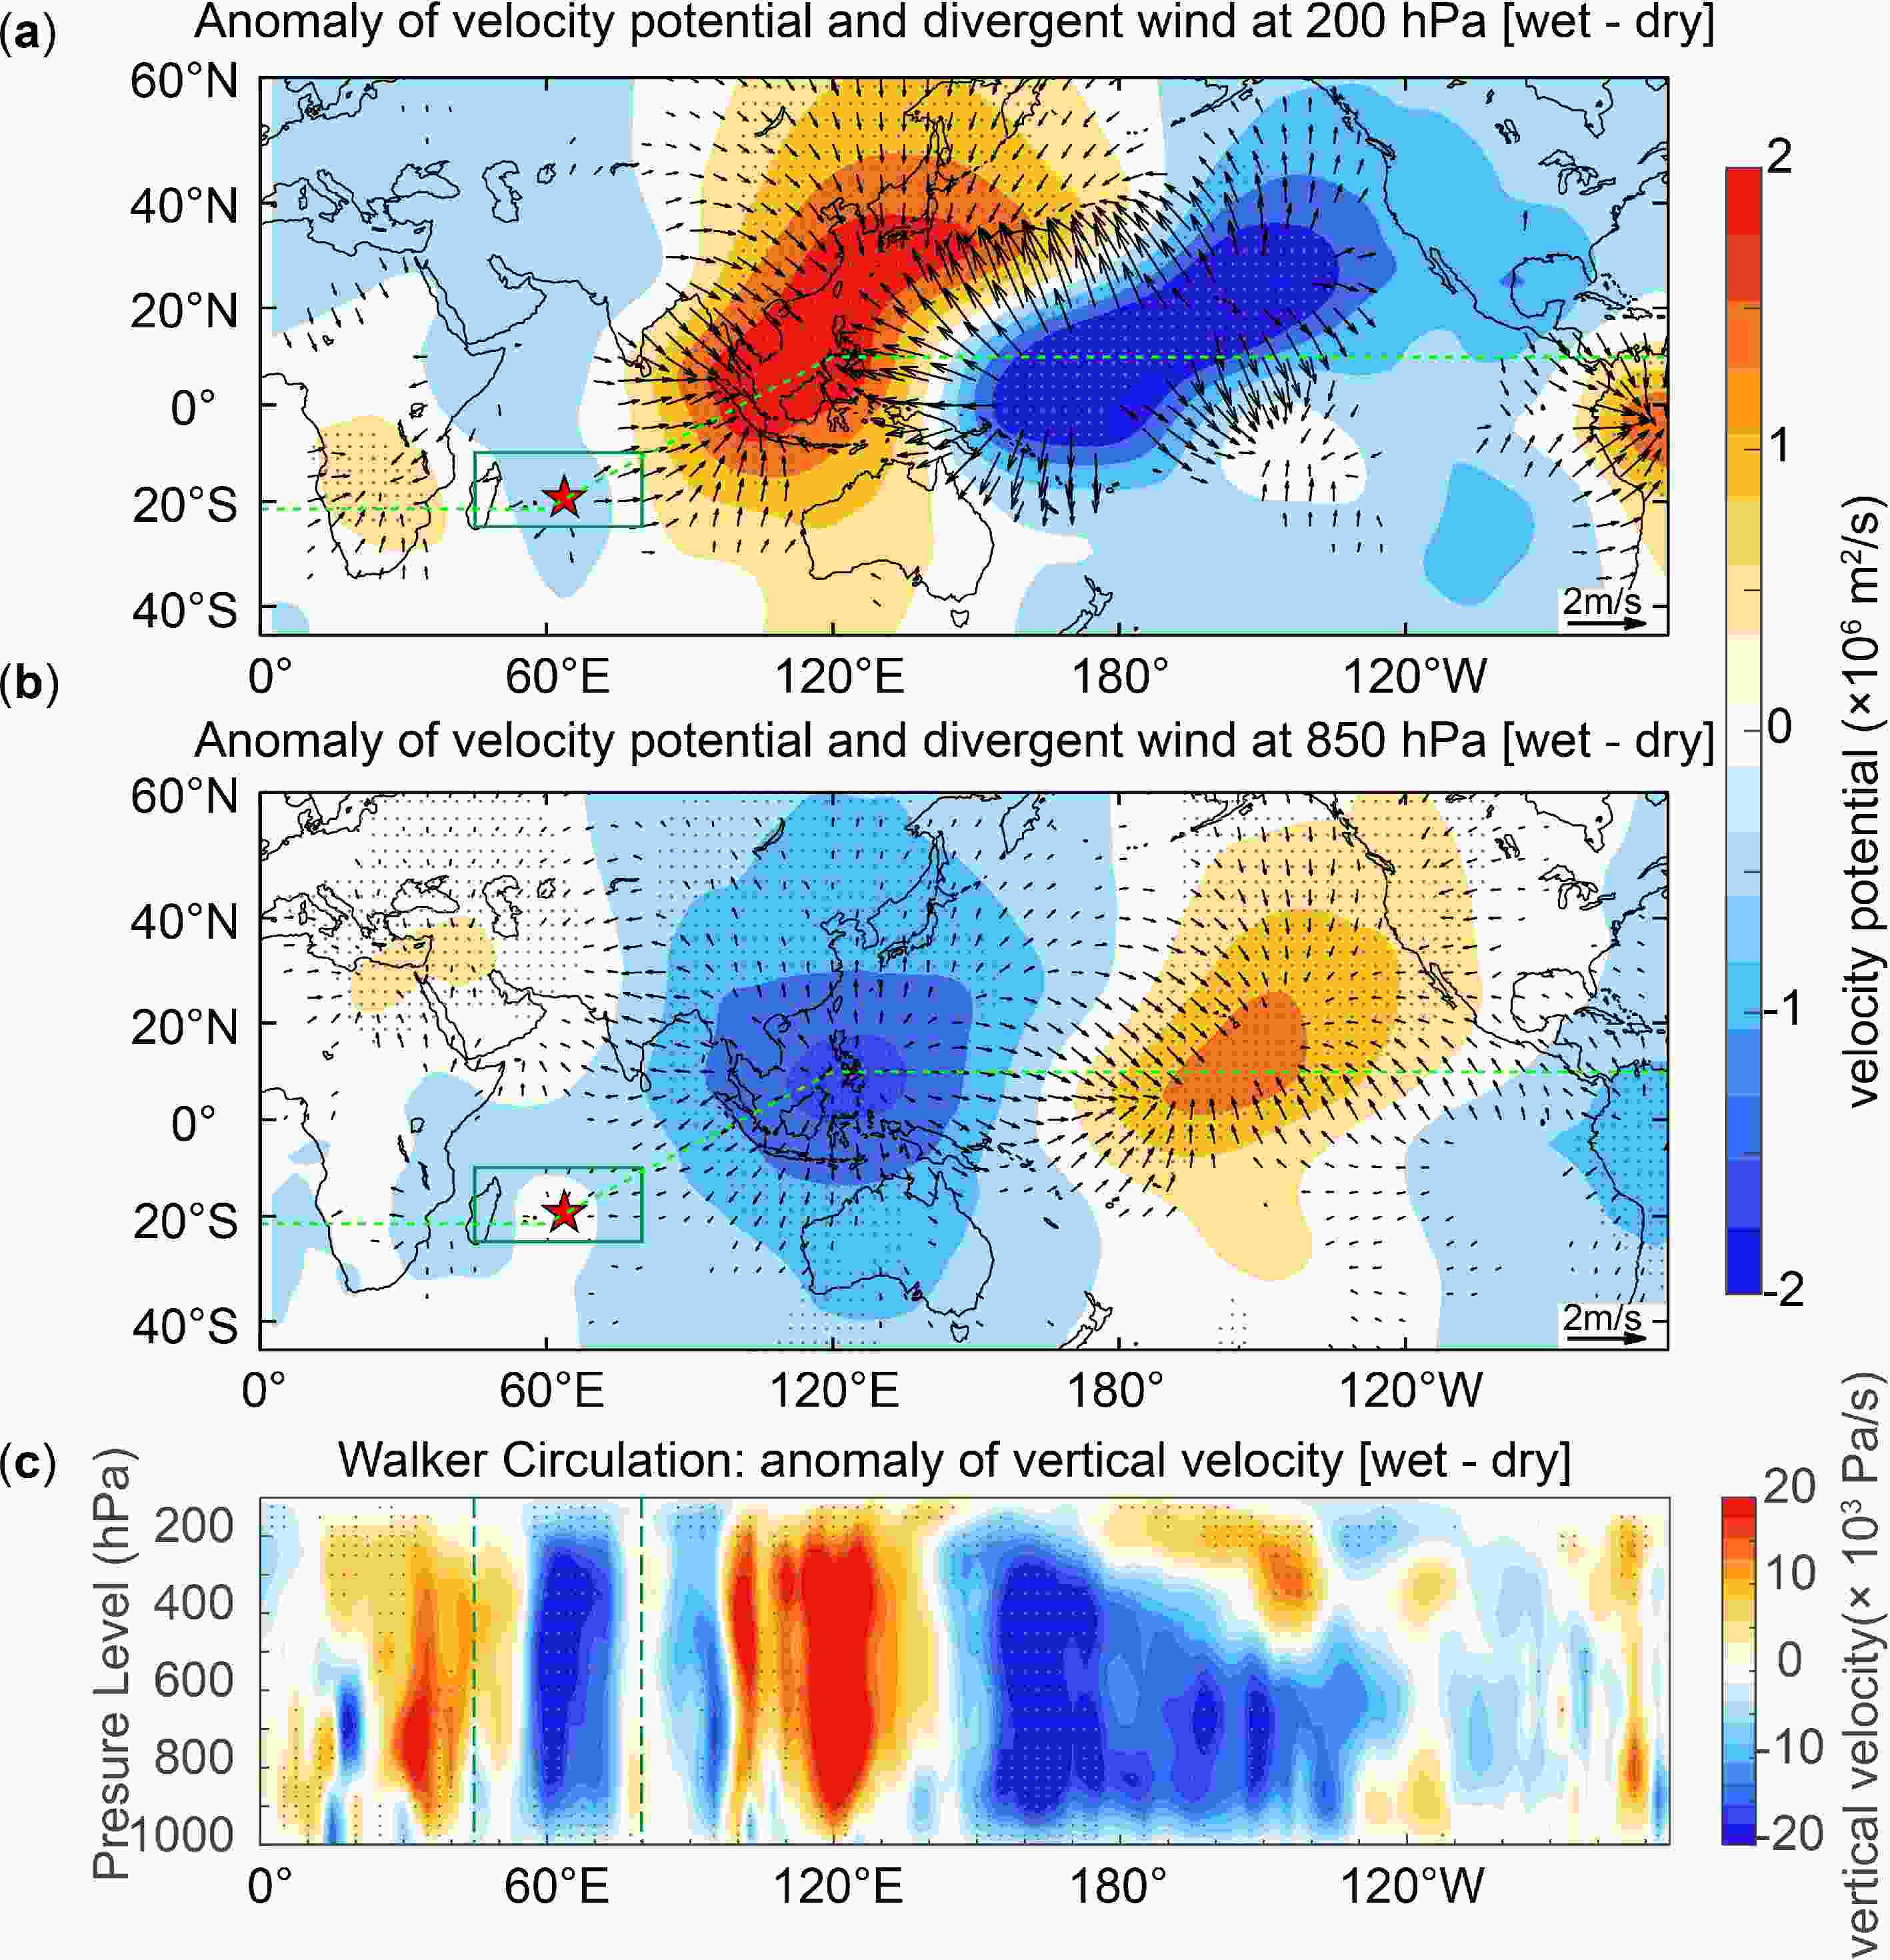 Figure4. Dynamical processes: JFMA spatial patterns between wet and dry years are a composite of velocity potential (shading) and divergent wind (arrow) at (a) 200 hPa and (b) 850 hPa. Star shows the location of Rodrigues Island. The green box in (a) and (b) represents the SWIO (45°?80°E and 10°?25°S). Stippling as well as divergent wind indicate significant differences at the 90% confidence level. (c) The JFMA anomalous Walker Circulation between wet and dry years are a composite of vertical velocity averaged along the latitude shown as the green dashed line in (a) and (b). The excited ascending motions of the Walker Circulation between 45°E and 80°E are highlighted by the green dashed line.
Corresponding to the increased rainfall over the SWIO, significantly warm JFMA mean SST anomalies appear over the equatorial central Pacific and cold SST anomalies over the equatorial western Pacific and northern Pacific at mid latitudes stretching from east Asia almost to North America (Fig. 3b). The SST anomaly pattern is robust as determined by cross-checking against the ERSST dataset (Huang et al., 2017) [Fig. S1 in the electronic supplementary material (ESM)]. The significant positive relationship between JFMA mean rainfall over the SWIO and the SST anomalies in the Ni?o-4 region (160°E?150°W, 5°S?5°N) is as high as 0.49 at the 99% confidence level, further confirming the observation above (Fig. 2). Notably, although the composited SST anomaly over the SWIO is positive, it is not significant at the 90% confidence level. The large positive contemporaneous correlation between rainfall and SST over the tropics suggests that SST forces the atmosphere (Wu and Kirtman, 2005). In our case, we infer that local warm SST anomalies may contribute to the increased rainfall over the SWIO, but the share of contribution is limited due to the weak correlation between them [r = 0.22 (?0.10, 0.50)] (Fig. 2). Instead, the large interannual variability over the SWIO is strongly connected to the central Pacific SST due to its large, concurrent and significant correlation. Thus, the rainfall variation over the SWIO is linked to the oceanic condition in the Pacific Ocean, which resembles the central Pacific types of ENSO (CP ENSO).
We note the reduced rainfall pattern over the Maritime Continent and increased rainfall over the equatorial central Pacific corresponds to increased rainfall over the SWIO. Such a rainfall pattern reflects the atmospheric thermal response to underlying SST anomalies (Wu and Kirtman, 2005). The anomalies of OLR, the vertical velocity in the mid-troposphere (500 hPa), and low-level winds (850 hPa) further demonstrate that enhanced convection and increased ascending motion over the SWIO are coincident with increased rainfall there. Meanwhile, reduced convection and anomalous descending motion over the Maritime Continent is consistent with decreased rainfall there (Figs. 3c and d).
In the central Pacific, the anomaly of velocity potential and divergent wind at 200 hPa and 850 hPa between wet and dry years shows prominent upper-level divergence and low-level convergence corresponding to the local warm SST anomalies and increased rainfall (Fig. 4). Meanwhile, low-level divergence and upper-level convergence appear over the Maritime Continent associated with local cold SST anomalies and reduced rainfall. Such divergence-convergence centers support a weakened Walker Circulation in the Pacific Ocean. The weakened Walker Circulation further supports the weak upper-level divergence and low-level convergence over the SWIO, and ultimately sets up a favorable dynamical environment for increased rainfall over the SWIO (Fig. 4c).
The above diagnosis shows one possible modulation of the central Pacific warming on the SWIO rainfall is via the large-scale Walker Circulation. Over the entire Pacific, the SST anomaly is not only constrained to the tropical Pacific but also extends into the North Pacific. This triple SST anomaly pattern is akin to the so-called “Victoria mode” (Ding et al., 2015), the second dominant mode of North Pacific variability, which was considered as the trigger to excite the CP ENSO (Yu and Kim, 2011). The associated anomaly pattern in precipitation, OLR, vertical velocity at 500 hPa, as well as velocity potential at 200 hPa and 850 hPa all show a large-scale northeast-southwest tilted dipole between 10°S and 40°N in the Pacific. The anomaly of 850 hPa wind and divergent wind at 200 hPa and 850 hPa show a typical response to the Victoria mode as reported by the previous studies (Yu and Kim, 2011). The distribution of anomalies suggests the extratropical forcing from the North Pacific gives rise to CP ENSO via a combination of footprinting mechanism, wind-evaporation-SST feedback, and equatorial ocean dynamics (Vimont et al., 2001; Alexander et al., 2010, Ding et al., 2015), which subsequently impact the rainfall in the tropical southwest Indian Ocean.
We further propose the mechanism relates to the Rossby wave response associated with water vapor transport. Figure 3d shows two anomalous low-level anticyclones in the tropical Indian Ocean centered at (15°N, 85°E) and (10°S, 85°E), respectively. Such a pattern is a typical Gill response (Gill, 1980) to the Maritime Continent's diabatic cooling. Of particular importance is that one of the anticyclones is located south of the equator. Such a distribution favors moisture advection from the tropical ITCZ region to the SWIO via an anomalous northwest wind regime to the southwest of the anomalous tropical anticyclones (centered at 10°S, 85°E). The vertically integrated water vapor flux is nearly identical to the low-level circulation, illustrating the consistency between water vapor transport and the low-level circulation (Fig. 3d and Fig. 5). Water vapor divergence over the Maritime Continent and convergence over the SWIO corresponds to the anomalous anti-cyclonic and cyclonic circulation to the west of these two regions. This observation suggests that enhanced water vapor over the SWIO favors the thermodynamic environment for the increased rainfall there (Fig. 5). The direct energy source for the tropical atmosphere is latent heat (e.g., Gill, 1980). The ocean acts as the trigger to excite atmospheric variations when more (less) rainfall with increased (reduced) latent heat corresponds to the warm (cold) SST. Since anticyclones are located to the west of the suppressed convection and cold SST anomalies over the Maritime Continent (Fig. 3), this pattern suggests its origin rests in the response of Rossby wave to the latent cooling (Matsuno, 1966; Gill, 1980). Here we use LBM to demonstrate the atmospheric response to the given diabatic cooling. As shown in Fig. 6a, latent cooling was added over the Maritime Continent. As a result, two anticyclones appear over the tropical Indian Ocean, which coincide with those in Figs. 3d and 5. Prominent westerly winds present over the SWIO transport the water vapor from the ITCZ center to the southern boundary of the tropical rain belt.
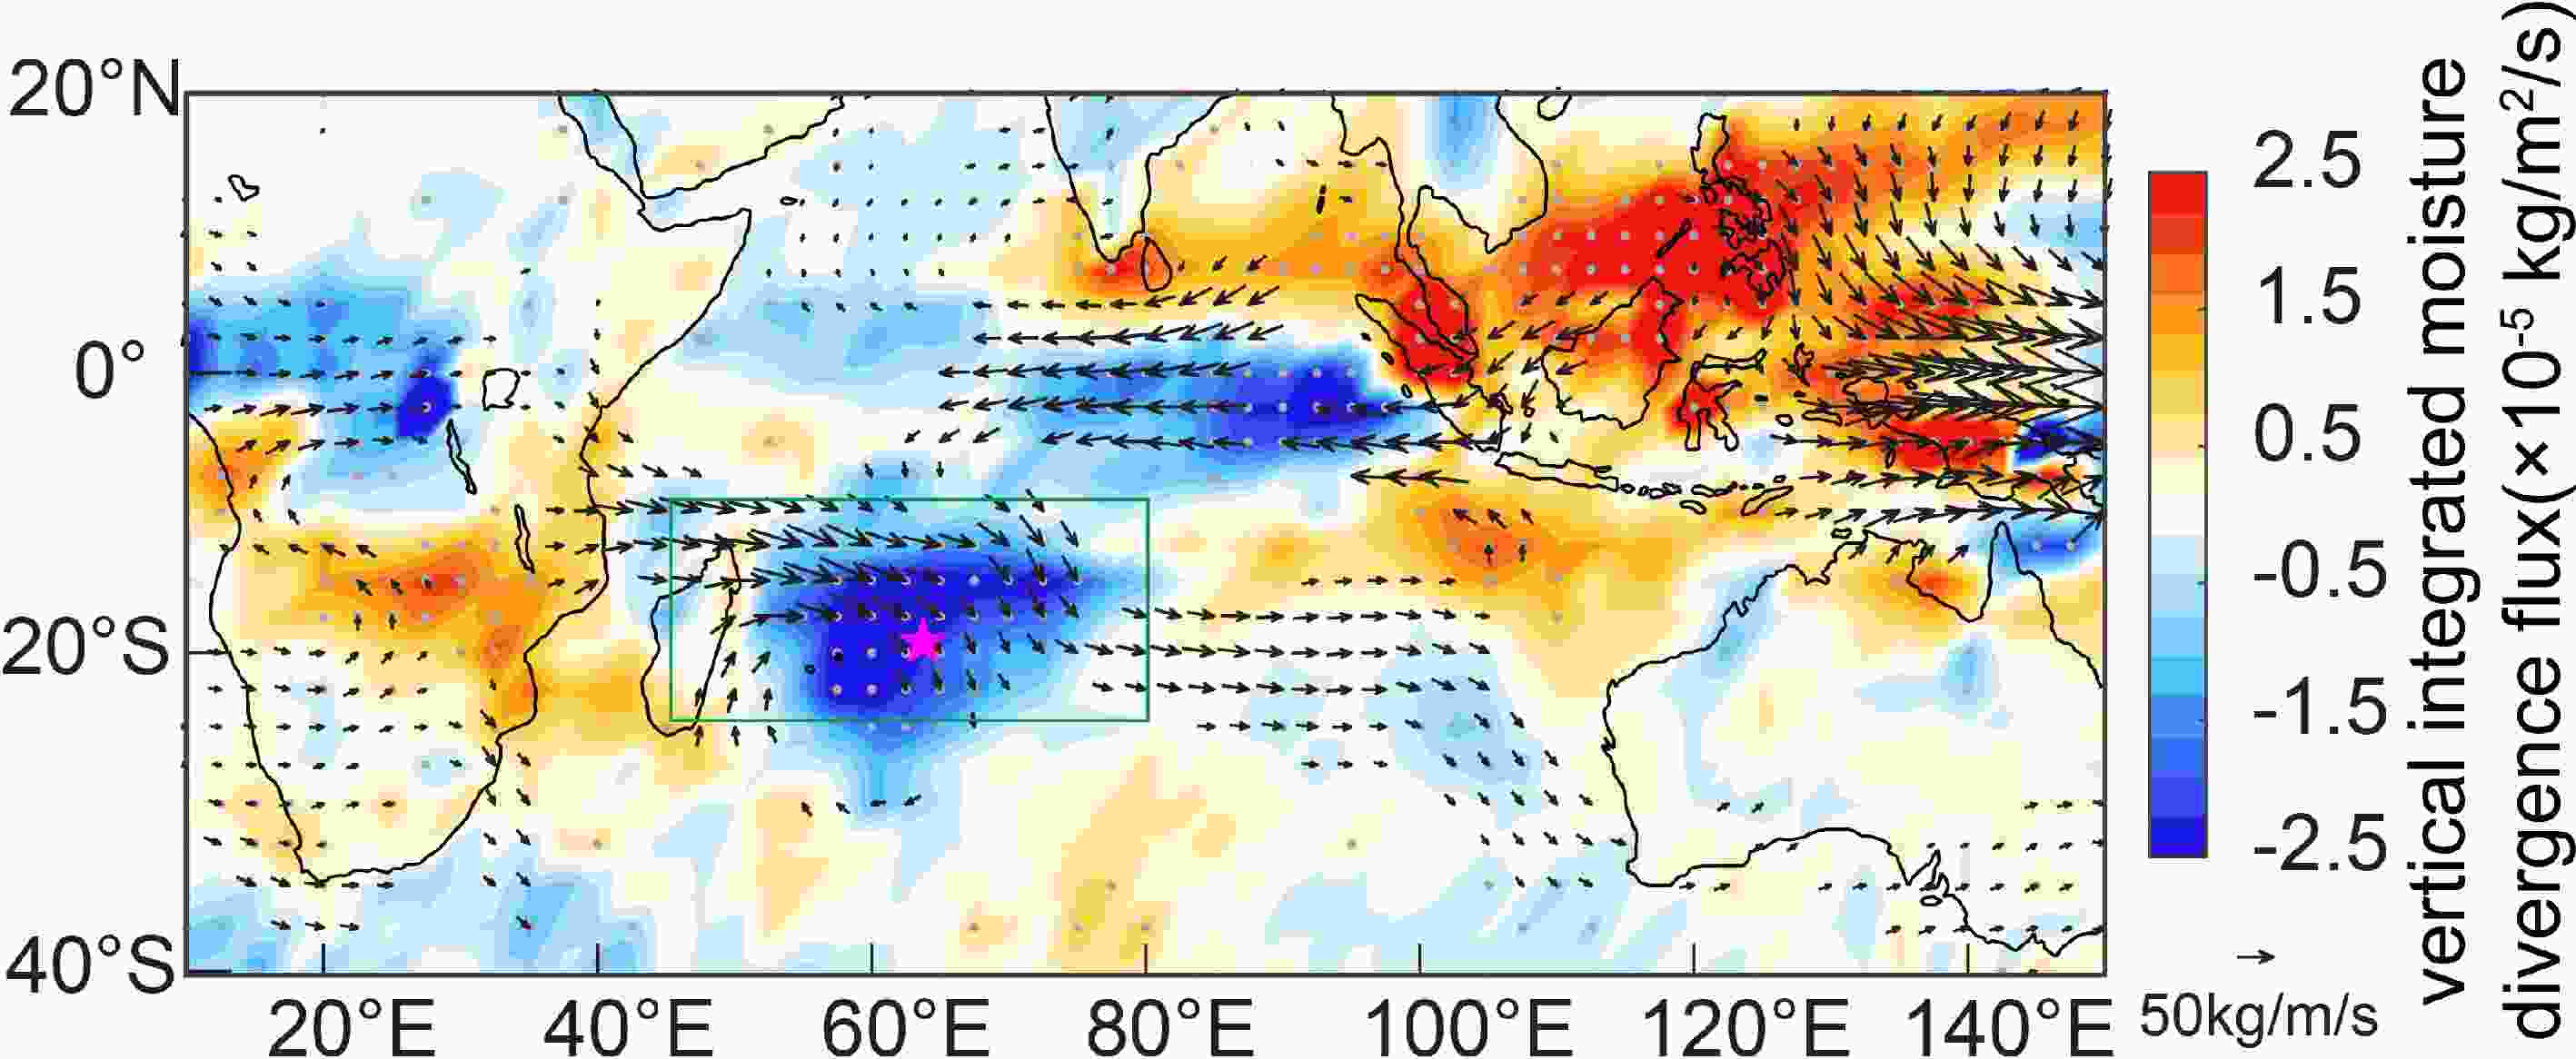 Figure5. Thermodynamic processes: JFMA spatial pattern between wet and dry years is a composite of the vertical integral of moisture divergence flux (shading) and water vapour flux (arrows). Stippling as well as arrows indicate significant differences at the 90% confidence level. The star shows the location of Rodrigues Island. Green box represents the SWIO (45°?80°E and 10°?25°S).
2
3.3. The local positive feedback of precipitation over SWIO
Despite a close agreement between the low-level winds in the ERA-Interim reanalysis (Fig. 3d) and LBM simulated steady response results (Fig. 6a), we find that the anomalous northerly winds over the SWIO are present in the reanalysis wind field but absent in the Maritime Continent cooling experiment. This anomalous northerly wind seems to be an anomalous cyclonic circulation, which is present to the west of Rodrigues Island in accordance with the water vapor flux field (Fig. 5). We hypothesize that this anomalous cyclone results from the increased latent heating. Accordingly, we performed another LBM experiment by adding latent heating forcing over Rodrigues Island corresponding to the increased local rainfall. As shown in Fig. 6b, a low-level cyclone appears to the southwest of the diabatic heating over Rodrigues Island. The steady response of westerly and northwesterly wind to the northeast of the anomalous cyclone (Fig. 6b) is consistent with the reanalysis data (Figs. 3d and 5).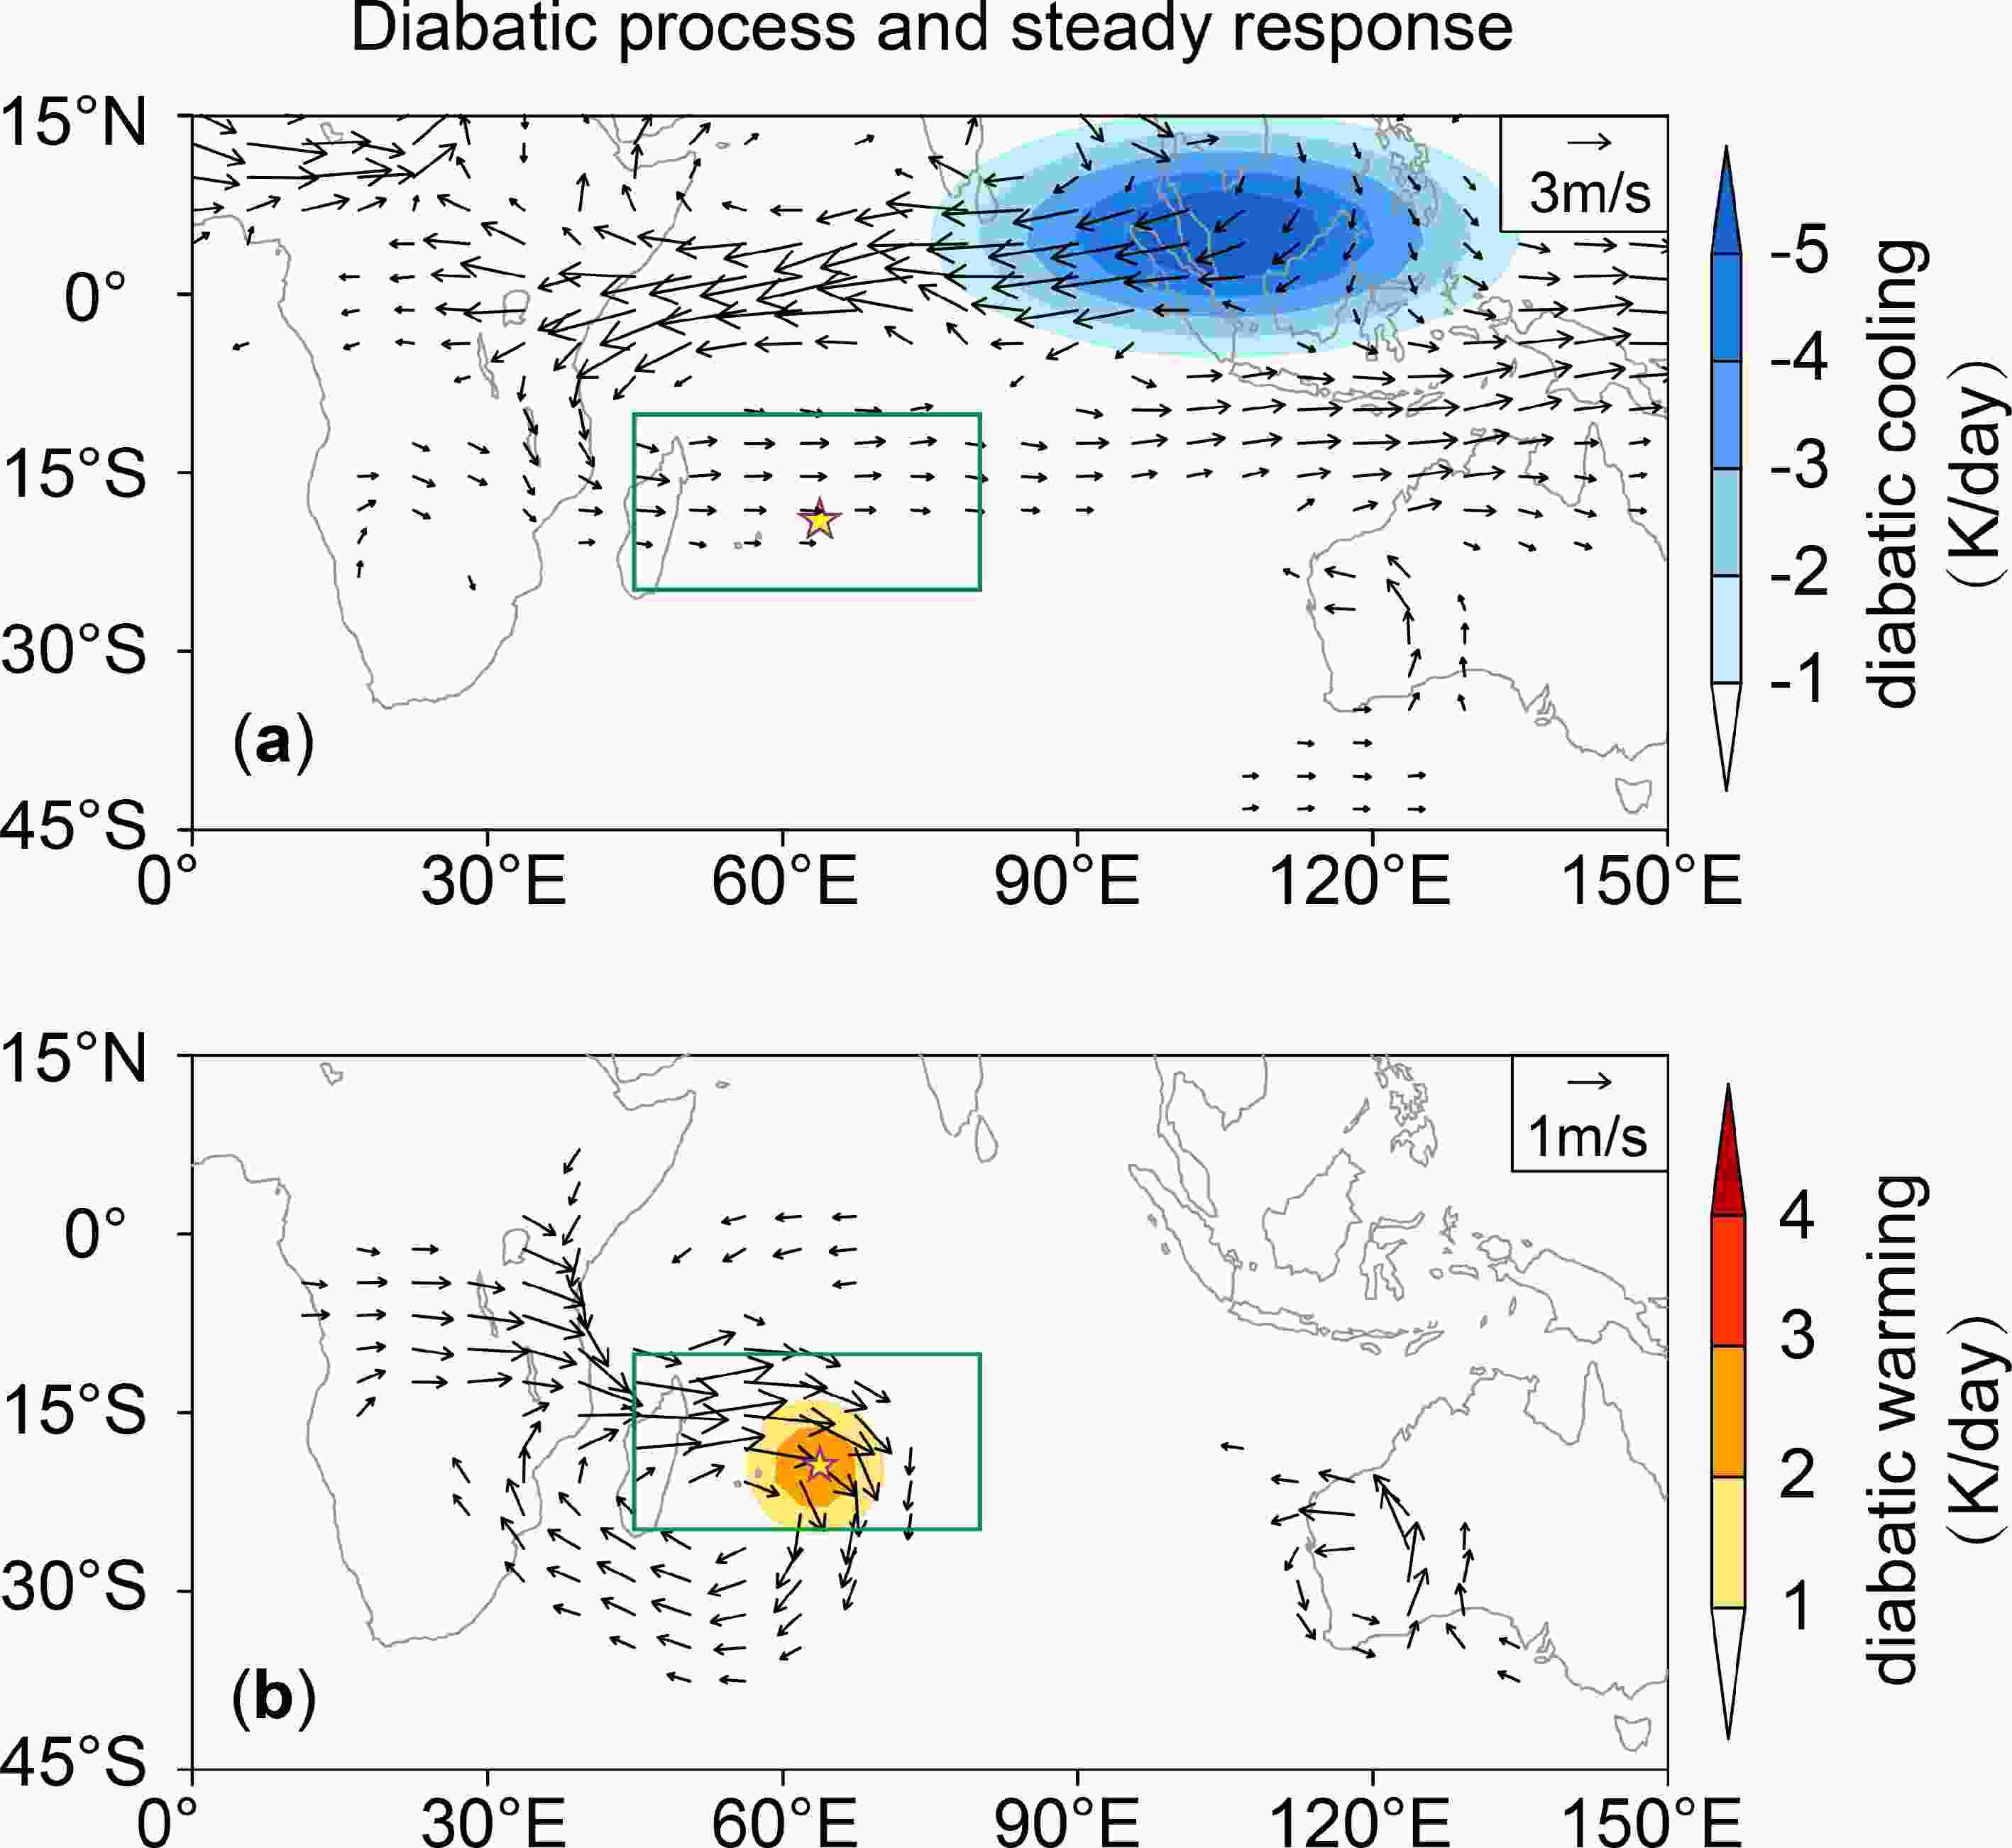 Figure6. The LBM simulation of diabatic process and steady response. (a) The trigger of diabatic cooling over the Maritime Continent at 500 hPa (shading) and the steady wind response at 850 hPa (arrows). (b) The trigger of diabatic heating over the Rodrigues Island at 500 hPa (shading) and the steady response of wind at 850 hPa (arrows). The green box represents the SWIO (45°?80°E and 10°?25°S) and the star marks Rodrigues Island.
This anomalous low-level cyclone can be regarded as the Rossby wave response to diabatic heating (Gill, 1980). Another way to understand this anomalous cyclone and the northerly wind is the Sverdrup balance (i.e.,


The anomalous cyclone shown in Fig. 6b suggests positive feedback of the circulation and rainfall. Suppose the rainfall over the SWIO increased mainly due to thermodynamic or dynamic processes mentioned in section 3.2 (Figs. 4 and 5). In that case, an anomalous cyclone can be excited to the southwest of Rodrigues Island (Fig. 6b), which further reinforces the rainfall increasing via moisture advection to the SWIO. Such positive feedback between circulation and rainfall may explain the enhanced amplitude in the interannual variation of precipitation in the SWIO during the local rainy season. On the other hand, the positive feedback of water vapor transport depends on the background state of the moisture gradient. The positive feedback can be active through the austral summer because the warm Southern Hemisphere and southerly located ITCZ support a large moisture gradient for the water vapor transport from the tropics to the southern Indian Ocean via anomalous northwesterly wind. However, this can lead to demise during the austral winter, because the colder southern Hemisphere, northerly located ITCZ, and intensified MH result in a dry condition in the tropical Indian Ocean and the failure of the anomalous northwesterly wind to transport water vapor to the SWIO.
The interannual variations of the local rainy season over the SWIO can be affected by both remote and local atmospheric processes (Fig. 7). The rainfall variation over the SWIO is linked to the oceanic condition in the Pacific Ocean, resembling the central Pacific types of ENSO, and closely linked to the Victoria mode variability in the North Pacific. Our results not only confirm the previous findings that teleconnection between CP ENSO and the southern Indian Ocean is strong (Kao and Yu, 2009), but also indicate a chain of teleconnection initially triggered by the North Pacific Oscillation. We demonstrate dynamic and thermodynamic mechanisms that bridge the anomalous SST over the tropical central Pacific Ocean to the rainfall variation over the SWIO (Fig. 7). Dynamically, a weakened Walker Circulation induced by a warmer tropical central Pacific Ocean leads to anomalous upper-level divergence and low-level convergence over the tropical region of the SWIO, and subsequently increases the precipitation over the SWIO. Thermodynamically, the cooling over the Maritime Continent excites equatorial Rossby waves to its west. The anomalous low-level westerly wind to the south of the anticyclone in the southern Indian Ocean transports water vapor to the SWIO and contributes to the increased rainfall. Furthermore, we identify additional positive feedback between the local increased rainfall and atmospheric circulation, which is very important to understand the high regional precipitation variability (Fig. 7b). We find that increased rainfall over the SWIO, induced by teleconnection to the tropical Pacific, further excites the Rossby wave to the southwest of Rodrigues Island and contributes to the moisture advection and increased rainfall.
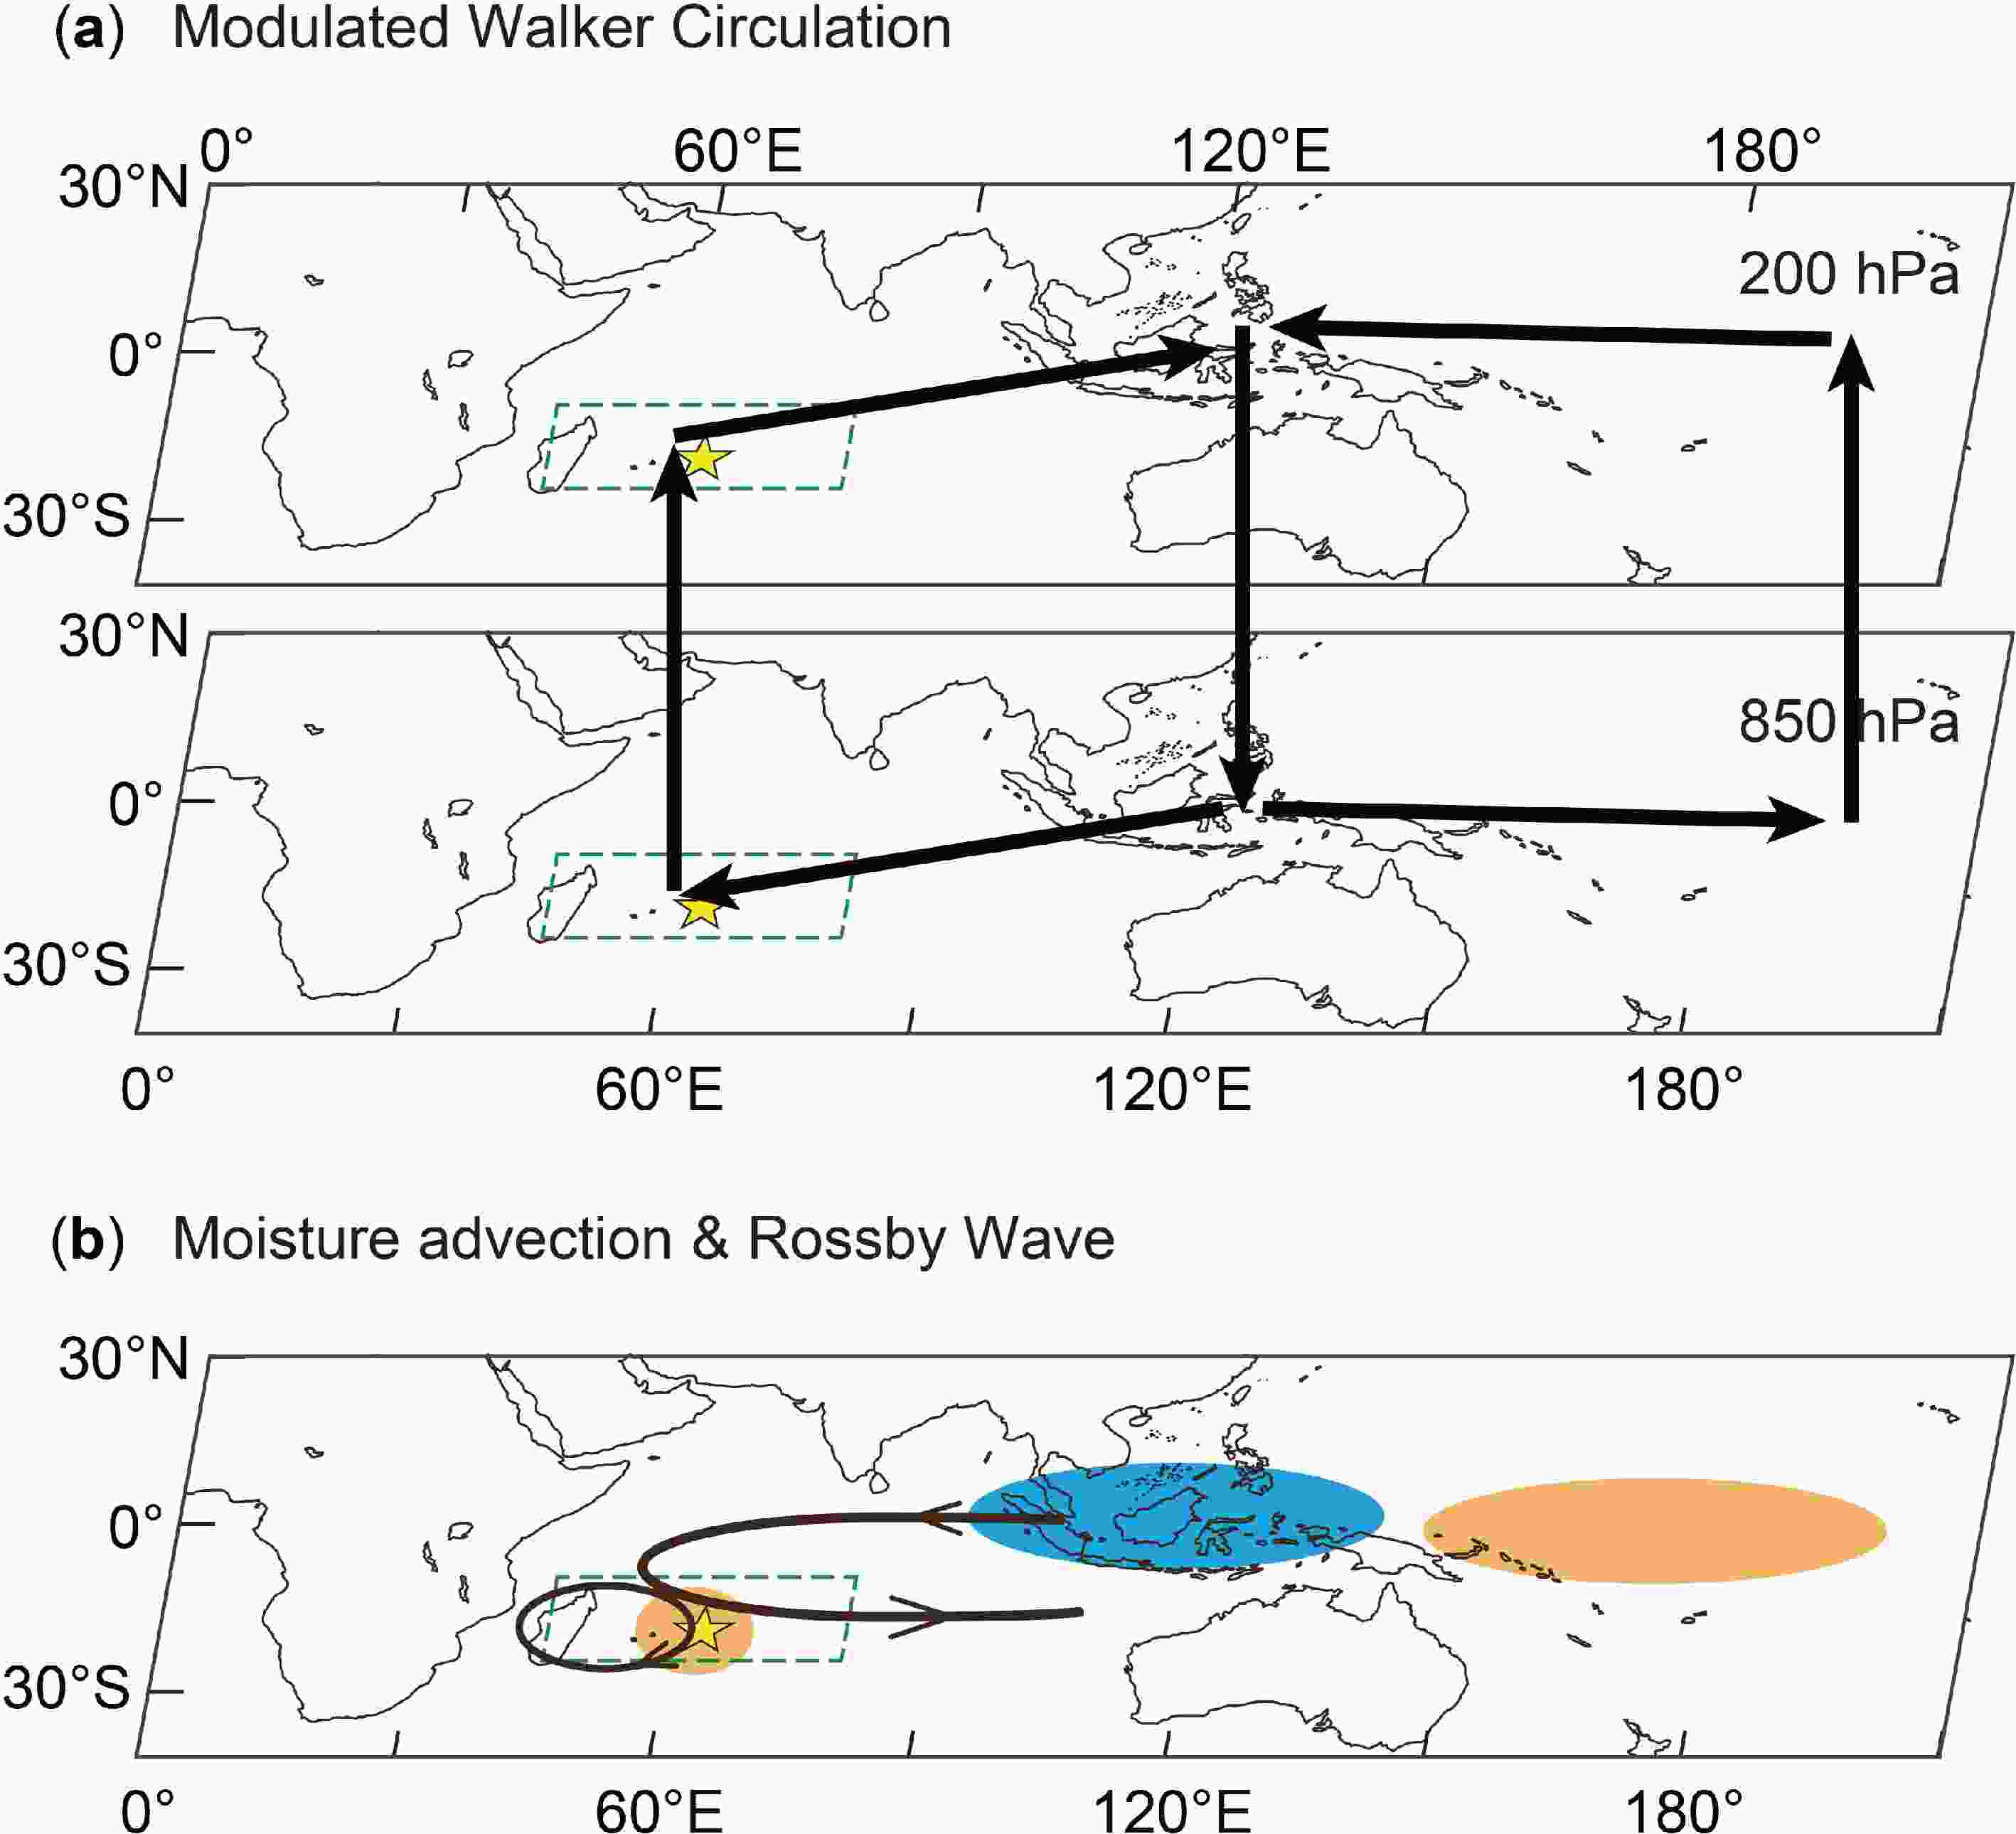 Figure7. Schematic diagram of possible mechanisms for the modulation by the tropical central Pacific warming SST on the increased precipitation over the SWIO during the local rainy season: (a) the dynamical mechanism associated with the weakened large-scale Walker Circulation (marked by arrows between 200 and 850 hPa level), and (b) the thermodynamic mechanism related to the Rossby wave response and moisture advection, including Gill response to the Maritime Continent diabatic cooling and local positive feedback. Yellow and blue circles represent the forces of heating and cooling. Black arrows show the excited Rossby wave. The green dashed box and star in (a) and (b) represents the SWIO (45°?80°E and 10°?25°S) and Rodrigues Island.
In summary, we find that increased rainfall over the SWIO is caused by weakened Walker Circulation and an excited Rossby wave resulting from anomalous Pacific SST, subsequently amplified by local positive feedback. This mechanism for creating monsoon precipitation variability over the SWIO is helpful for a better understanding of climate change than was possible in the past. Speleothem δ18O (δ18Oc), a proxy of precipitation, is universal in the paleoclimate study, which inherits the variability of precipitation δ18O (δ18Op) commonly reversed with precipitation amount in the tropics (Risi et al., 2008; Dansgaard, 1964). Current instrument and model simulation capabilities have given support to the inverse relationship between precipitation amount over the SWIO and δ18Op around Rodrigues Island during the local rainy season, in which a 1‰ increase in δ18Op corresponds to ~66 mm decrease during December-January-February (Li et al., 2020). The large interannual variability of recent precipitation records can be observed in the observation and modelled δ18Op as well as in the 5-year interpolated δ18Oc of speleothem persistently over the past 8 ka BP (Li et al., 2020) (Fig. 8). It is interesting to see that the precipitation over the past 8 ka B.P., at least partly revealed by δ18Oc, was characterized by large, high frequency variations with a muted drying trend. Given the remote and local dynamic processes discussed in this study, it seems that high-amplitude and frequent change is not a unique process in the recent past, but also for the entire mid to late Holocene. Our work sheds light on the understanding of highly variable and large amplitude hydroclimate changes revealed by speleothem δ18O records in the SWIO and provides a reasonable causal basis with respect to the teleconnection between conditions of the Pacific Ocean and precipitation variability over the SWIO in the ancient time.
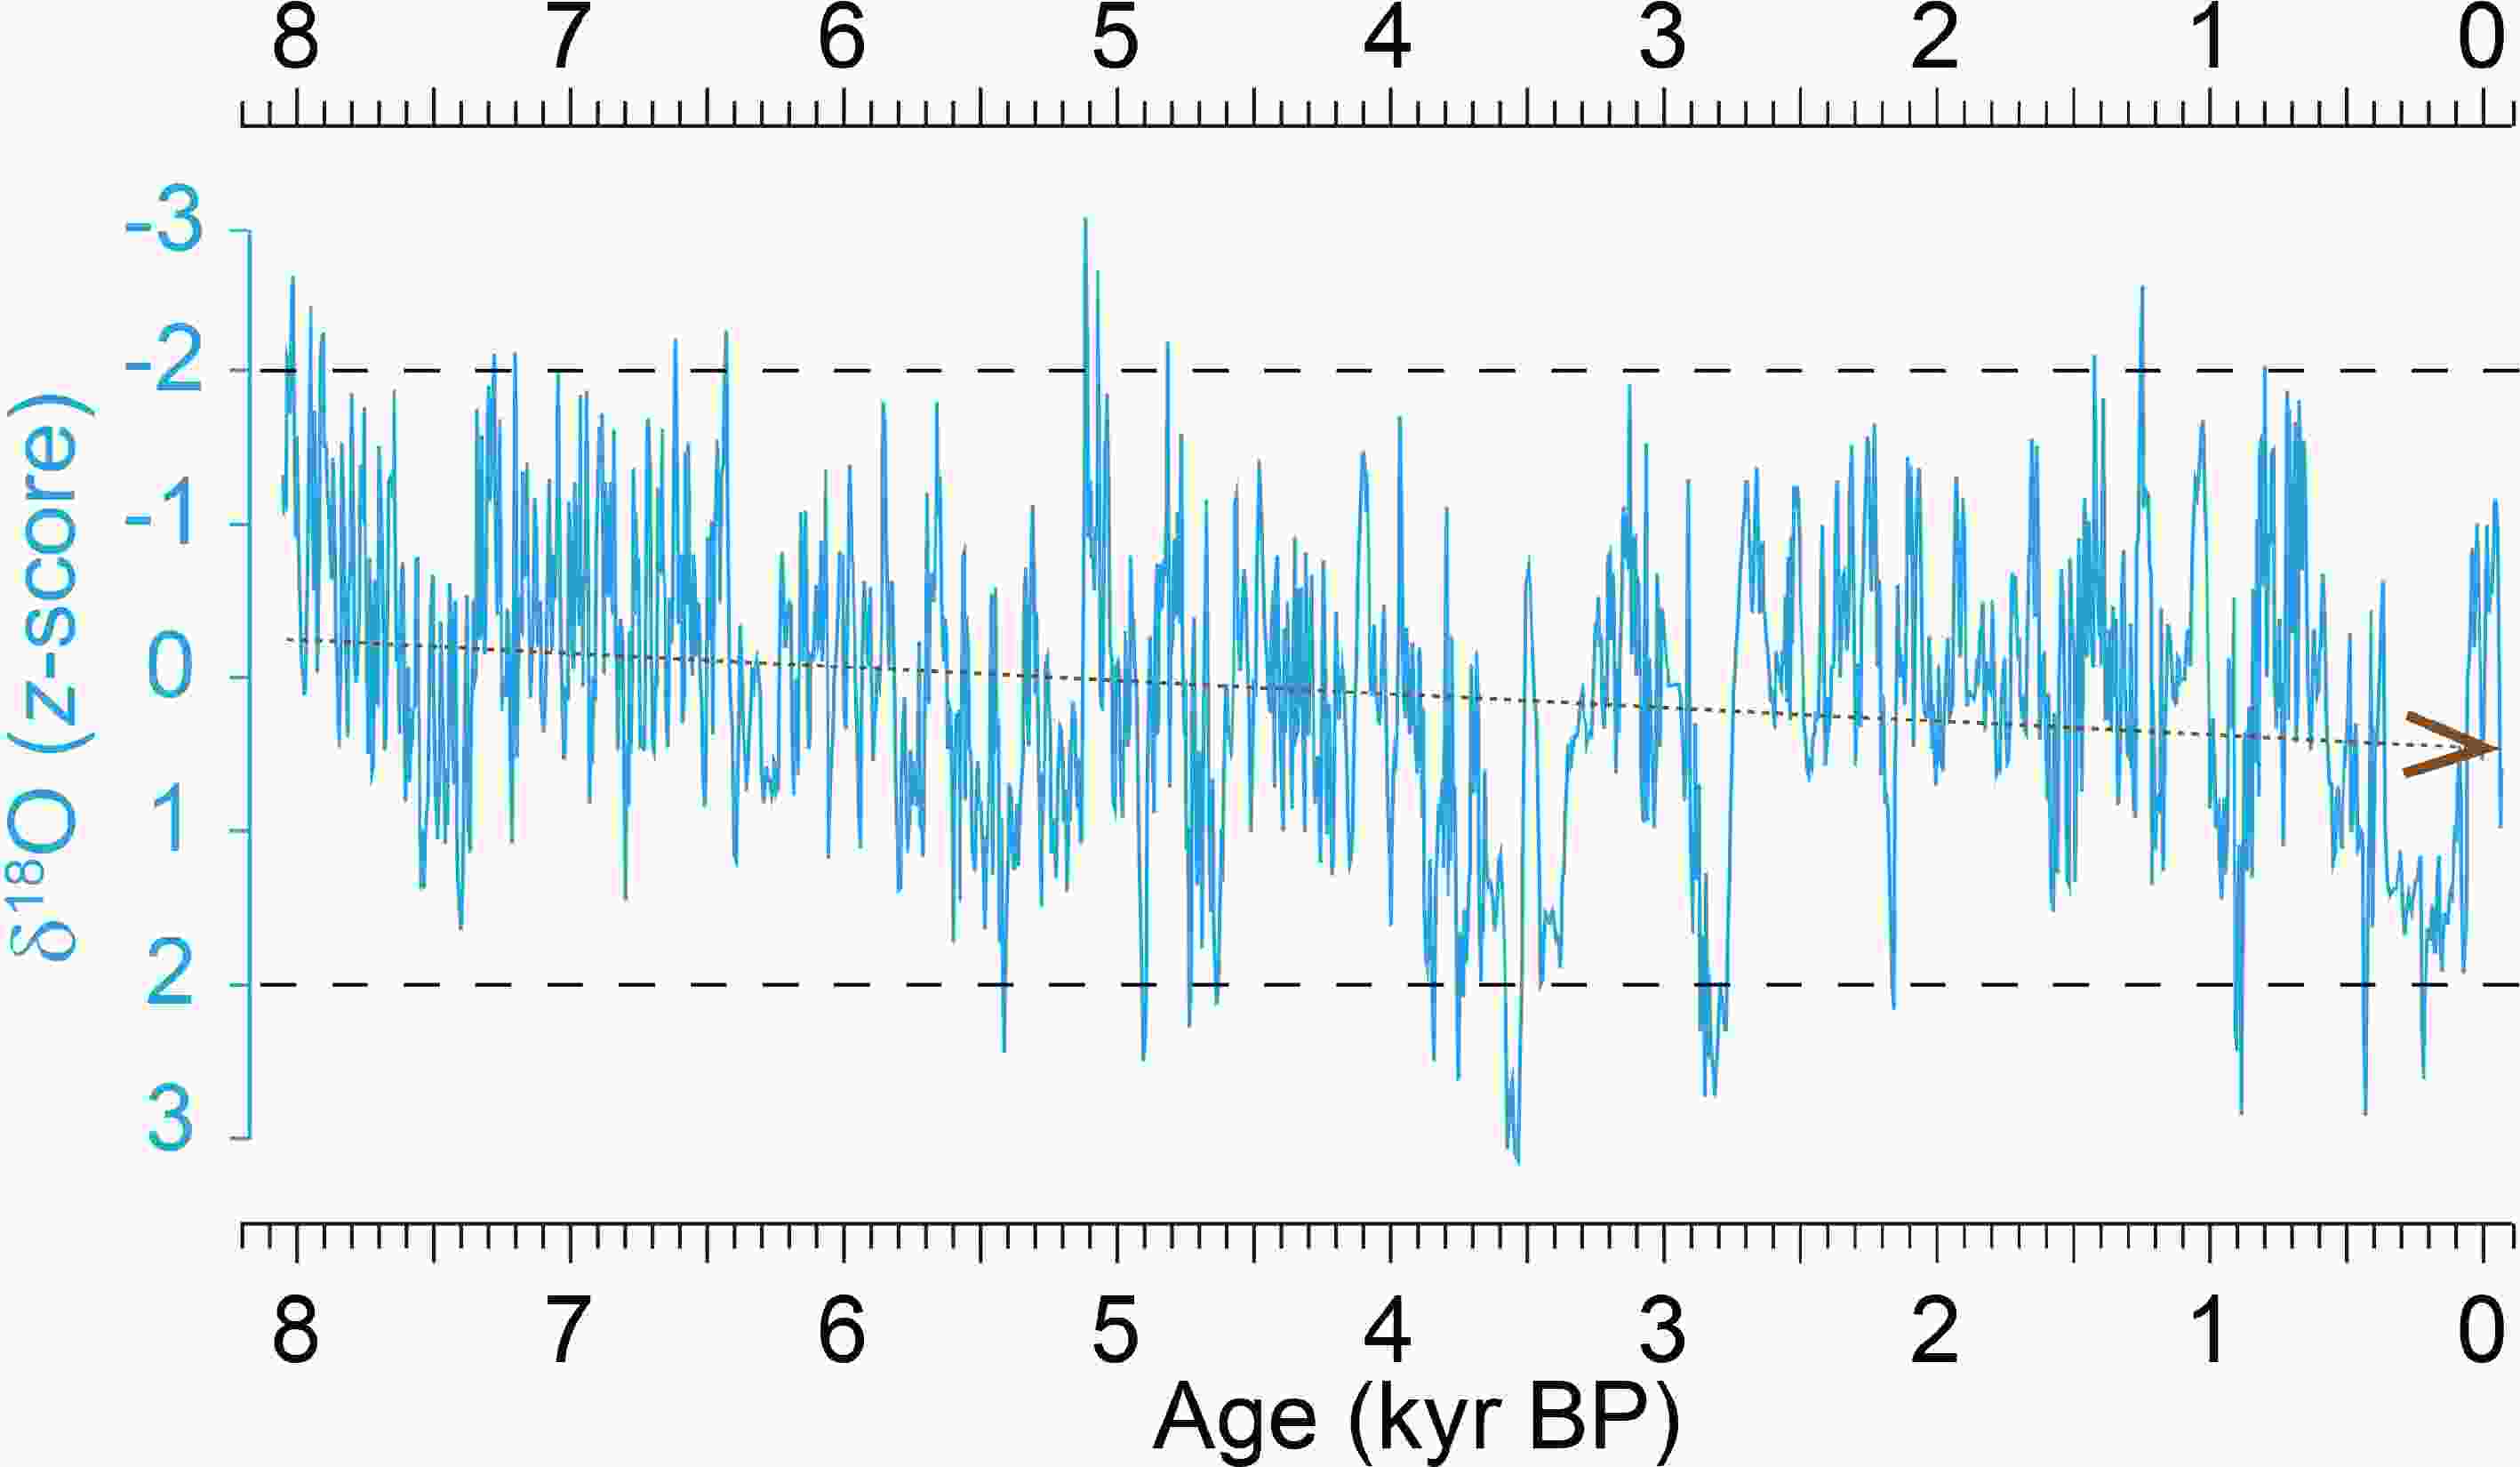 Figure8. The composite speleothem δ18O record from Rodrigues Island in the SWIO over the past 8 ka B.P. The horizonal dashed lines mark 2 standard deviations for the entire record. Linear trend is delineated by the brown dashed line.
Acknowledgements. The authors thank editor Dr. Buwen DONG and two anonymous reviewers for their constructive comments and suggestions. This work was supported by the National Natural Science Foundation of China (Grant Nos. 41888101, 41731174 and 41561144003 to Hai CHENG, and 41472140), and the Chinese Academy of Sciences “PIFI Program” (Grant No. 2020VCA0019) to Ashish SINHA. Qiong ZHANG acknowledges the support from Swedish Research Council (Vetenskapsr?det, Grant Nos. 2013-06476 and 2017-04232). Peng HU acknowledges the Special Research Assistant Project of Chinese Academy of Sciences.
Electronic supplementary material: Supplementary material is available in the online version of this article at
