删除或更新信息,请邮件至freekaoyan#163.com(#换成@)

The Interannual Variation of Transboundary Contributions from Chinese Emissions of PM<sub>2.5&

本站小编 Free考研考试/2022-01-02

Xiao HAN1,2,
Meigen ZHANG1,2,3,,

Corresponding author: Meigen ZHANG,mgzhang@mail.iap.ac.cn
1.State Key Laboratory of Atmospheric Boundary Layer Physics and Atmospheric Chemistry, Institute of Atmospheric Physics, Chinese Academy of Sciences, Beijing 100029, China
2.College of Earth and Planetary Sciences, University of Chinese Academy of Sciences, Beijing 100049, China
3.Center for Excellence in Urban Atmospheric Environment, Institute of Urban Environment, Chinese Academy of Sciences, Xiamen 361021, China
Manuscript received: 2021-01-05
Manuscript revised: 2021-02-08
Manuscript accepted: 2021-03-11
Abstract:In recent years, several studies pointed out that anthropogenic emission sources in China which significantly contribute to the PM2.5 mass burden was an important cause of particulate pollution in South Korea. However, most studies generally focused upon a single pollution event. It is rare to see comprehensive research that captures those features prone to interannual variations concerning the transboundary pollutant contribution in South Korea using a unified method. In this paper, we establish the emission inventories covering East Asia in 2010, 2015, and 2017, and then conduct the source apportionment by applying a coupled regional air quality model called the Integrated Source Apportionment Module (ISAM). Comparison of simulated and observed PM2.5 mass concentration at 165 CNEMC (China National Environmental Monitoring Center) sites suggests that the PM2.5 concentrations are well represented by the modeling system. The model is used to quantitatively investigate the contribution from emission sources in China to PM2.5 concentrations over South Korea and those features found to be prone to interannual variations are then discussed. The results show that the average annual contribution of PM2.5 has dropped significantly from 28.0% in 2010 to 15.7% in 2017, which strongly suggests that China has achieved remarkable results in the treatment of atmospheric particulates.
Keywords: CMAQ,
PM2.5,
transboundary contribution,
air quality


--> --> -->
1. Introduction
In recent years, there has been much controversy as to whether the transport of particulate matter from China has had a serious impact on the air quality of neighboring countries. Due to economic development and dense population, the mass loading of aerosols in eastern China has often been at high levels and has led to frequent haze events (Guo et al., 2014; Zhu et al., 2016). Intuitively, these aerosols are also likely to make transboundary contributions to nearby, downstream areas. Taking South Korea as an example, some earlier studies used backward trajectories among other methods to analyze the source of PM2.5 in the Seoul metropolitan area, suggesting that the emission in industrial areas of China were important sources of sulfate, nitrate, and secondary organic carbon (Kim et al., 2007; Heo et al., 2009). Since 2010, many researchers have used the receptor model and numerical simulations to trace the source, and quantitatively estimated the contribution from emission sources in Beijing, Tianjin, Hebei, Shandong, and the Yangtze River Delta during different periods. The proportion of the particulate matter attributed to Chinese emissions in South Korea fluctuated from 10% to 80% (Lee et al., 2017; Choi et al., 2019; Yim et al., 2019). This significant variation is subject to further uncertainty considering that there were large deviations among the related studies which used diverse methods and analyzed different time periods.
On the other hand, several atmospheric environmental control projects have been implemented in succession by the Chinese government to strictly control atmospheric pollution since 2013. According to the "Report on the State of the Environment in China", the average PM2.5 mass burden of 74 leading cities (Fang et al., 2016) in China has dropped from 72 μg m?3 in 2013 to 39 μg m?3 in 2018. Specifically, the PM2.5 mass concentration decreased by 43.4% and 34.4% in two key regions: Beijing-Tianjin-Hebei and the Yangtze River Delta, respectively. These results indicate that the treatment of air pollution has resulted in significant reductions, and the transboundary impact of Chinese pollutant emissions on the air quality of neighboring countries should also show concurrent reductions over the past 10 years. However, it is rare to see related research which estimates the interannual variations of pollutants based on emission sources that exhibit annual changes.

2. Methodology
This study applied the regional air quality modeling system RAMS-CMAQ coupled with ISAM (integrated source appointment module) to simulate the major PM2.5 components and their precursors emitted from the sources in China. Compared with other methods, such as receptor modeling, the chemical transport model is more suitable for capturing the transport contribution of secondary aerosols that result from nonlinear processes, including chemical mechanisms, wet scavenging, and gas-aerosol interactions, which are treated comprehensively. Within the model system, CMAQ (version 5.0.2; https://www.airqualitymodeling.org/index.php/CMAQ_version_5.0.2_(April_2014_release)_Technical_Documentation) was responsible for simulating the evolution of atmospheric pollutants. ISAM is a new-generation numerical source appointment module. Compared with the previous version (TSSA), the computational requirements and reliable representation were balanced and optimized. Additionally, aside from other major aerosol species (sulfate, nitrate, ammonium, black carbon, and organic carbon), ISAM added the mechanism to track multiple crustal species (Kwok et al., 2013). The modeling system has been employed to research the spatial-temporal distribution of aerosol in East Asia and has proven to perform reliably (Han et al., 2011, 2013; Li et al., 2019).
The emission source inventories covering East Asia corresponding to the simulation year were established. First, the MIX inventory (Li et al., 2017), which provides the major anthropogenic emission data covering the entire Asian continent, is regarded to be a reliable emission inventory and has been widely used by modeling studies. Thus, the MIX (based on 2010 data) combined with other emission data, including lightning, spraying, soil fertilization, global natural VOCs, forest and grassland wildfires, and straw burning from REAS (Regional Emission Inventory in Asia; Version 2.1), MEGAN (Model of Emissions of Gases and Aerosols from Nature; Version 2.1), and GFED (Global Fire Emissions Database; Version 3.0), respectively, was applied to establish the emission inventory in 2010. Second, the latest version of MEIC inventory (http://www.meicmodel.org/dataset-mix.html; based on 2015), which provides the anthropogenic emission data in China, was used to establish the emission inventory in 2015. Meanwhile, the GFED was also updated in version 4.1. However, the comprehensive emissions data in East Asia based on recent years have not been released until now. The research team of MIX summarized the interannual variation of pollutant emission from 2010 to 2017 in China and released the statistical results with detailed information about species and sections (Zheng et al., 2018). Then, the 2017 emission inventory was obtained by adjusting the data based on 2015 according to the statistical parameters in Zheng et al. (2018). As reported by Zheng et al. (2018), the anthropogenic emission budget of major aerosol precursors and primary PM2.5 components underwent significant changes from 2010 to 2017 in China. The emissions of SO2, PM2.5, BC, and OC showed a declining trend year after year. The emission of SO2, in particular, decreased by 61.8% over this period, from 27.8 Tg in 2010 to 10.5 Tg in 2017. Furthermore, the declines of primary PM2.5, BC, and OC were 35.6%, 23.5%, and 34.4%, respectively. Only NMVOCs (nonmethane volatile organic compounds) emissions rose, by 10.5%.

3. Results and discussion
The model domain (shown in Fig. 1) is 6654 km × 5440 km with 64 km2 fixed grid cells and uses a rotated polar stereographic map projection. To evaluate the simulation results, the hourly observation data of PM2.5 mass concentration from 2015 released by the China National Environmental Monitoring Center were collected, and we selected data from 35 stations in North China, 50 stations in Northeast China, and 80 stations in East China for comparison with the modeled PM2.5. The location of each site is shown in Fig. 1, and all sites are located in the region around South Korea. Figures 2ac presents the scatterplot of the observed and modeled monthly means of PM2.5 mass concentrations in 2015 over North China, Northeast China, and Eastern China, respectively. It can be seen that the points generally gather around the 1:1 solid line in Fig. 2b, but the model results were slightly greater than the observed values in Figs. 2a and 2c. Figures 2df presents the correlation coefficients of monthly means between the observational and simulated values in January, April, July, and October for each station. The correlation coefficients are broadly distributed in the 0.5–0.75 range, and were greater in January, April, and October, but were relatively lower in July. One possible explanation for the July discrepancy centers around good diffusion conditions since convection is strong during summer, so it is difficult to capture the significant fluctuations of the PM2.5 mass burden for model simulations. In general, the average values and variation trend of PM2.5 mass concentration in 2015 can be well reproduced by the modeling system.
Figure1. The model domain used in this study and the locations of observation data in North China, Northeast China, and Eastern China.


Figure2. Scatterplots of the modeled and observed monthly means (units: μg m?3) of PM2.5 mass concentrations (a–c) and the correlation coefficients (d–f). The solid lines are 1:1 and the dashed lines are 2:1 or 1:2 in (a–c). The x-axis represents the different stations in (d–f).


Based on the emission inventories in 2010, 2015, and 2017, the mass concentration of pollutants in East Asia was simulated by RAMS-CMAQ. It should be noted that in order to eliminate the interannual variations of meteorological factors, all experiments were conducted by applying the same meteorological field corresponding to the mean values observed during the respective months of 2015. Figure 3 presents the monthly average surface wind field in January, April, July, and October of 2015. It can be seen that the meteorological conditions were conducive to pollutant transport from East China to South Korea due to the strong northwesterly wind field forced by the interaction between the Siberian (Continental) High and Okhotsk (Maritime) Low that are climatologically common in January. In July, however, the dominant wind direction was southerly, the wind speed was relatively low, and the strong solar radiation is known to lead to strong and widespread convection and a subsequent increase of dry deposition of aerosols. Thus, the transport impact from China should be weak during summer. On the other hand, compared with the weak average wind speeds in April, the anticyclonic circulations which develop in autumn imply that much of the pollution emitted from central and eastern China could be transported to the eastern, downwind areas in October. Figure 4 shows the horizontal distribution of the annual average PM2.5 mass concentration in 2015. The interannual differences of PM2.5 mass concentrations calculated from 2010, 2015, and 2017 data (2015 minus 2010, and 2017 minus 2015) are also shown in Fig. 4. First, it can be seen that high values, which can exceed 75 μg m–3, were mainly concentrated in North China, Central China, and the Sichuan Basin. Furthermore, the mass burden reached 35–75 μg m–3 in the densely populated areas of central and eastern China, and below 35 μg m–3 in other regions. The above distribution features were essentially consistent with that of the emission inventory. Also, the PM2.5 mass concentration broadly decreased by 15–30 μg m–3 from 2010 to 2015, and 10–20 μg m–3 from 2015 to 2017 in Central and Eastern China, respectively.
Figure3. The monthly averaged surface wind field in January, April, July, and October of 2015.


Figure4. The annual mean values of PM2.5 mass concentration in 2015 are shown in (a). Also shown are the variations of PM2.5 mass concentration: 2015 minus 2010 (b) and 2017 minus 2015 (c).


Figure 5 shows the percentage of the average annual contribution which was attributed to anthropogenic emissions by China, to the total PM2.5 mass burden in 2010, 2015, and 2017 over the model domain. Generally, it can be seen that the major anthropogenic contributions appeared in localized areas of China. The value could exceed 90% over most of these regions, except the Xinjiang Uygur Autonomous Region and the Tibet Autonomous Region in China, and was limited to 20%–30% of the total PM2.5 mass burden in South Korea in 2010. Over time, the local contribution trended lower in the Xinjiang Uygur Autonomous Region, Central China, and Northeast China consistent with the accompanying decrease of anthropogenic emissions, but generally maintained a value above 70% in most regions. Also, the contribution of Chinese anthropogenic emissions of PM2.5 in South Korea dropped to less than 30% in 2015 and less than 20% in 2017. According to the simulation results, the annual, regionally averaged contribution was 28.0% in 2010, 20.4% in 2015, and 15.7% in 2017, respectively.
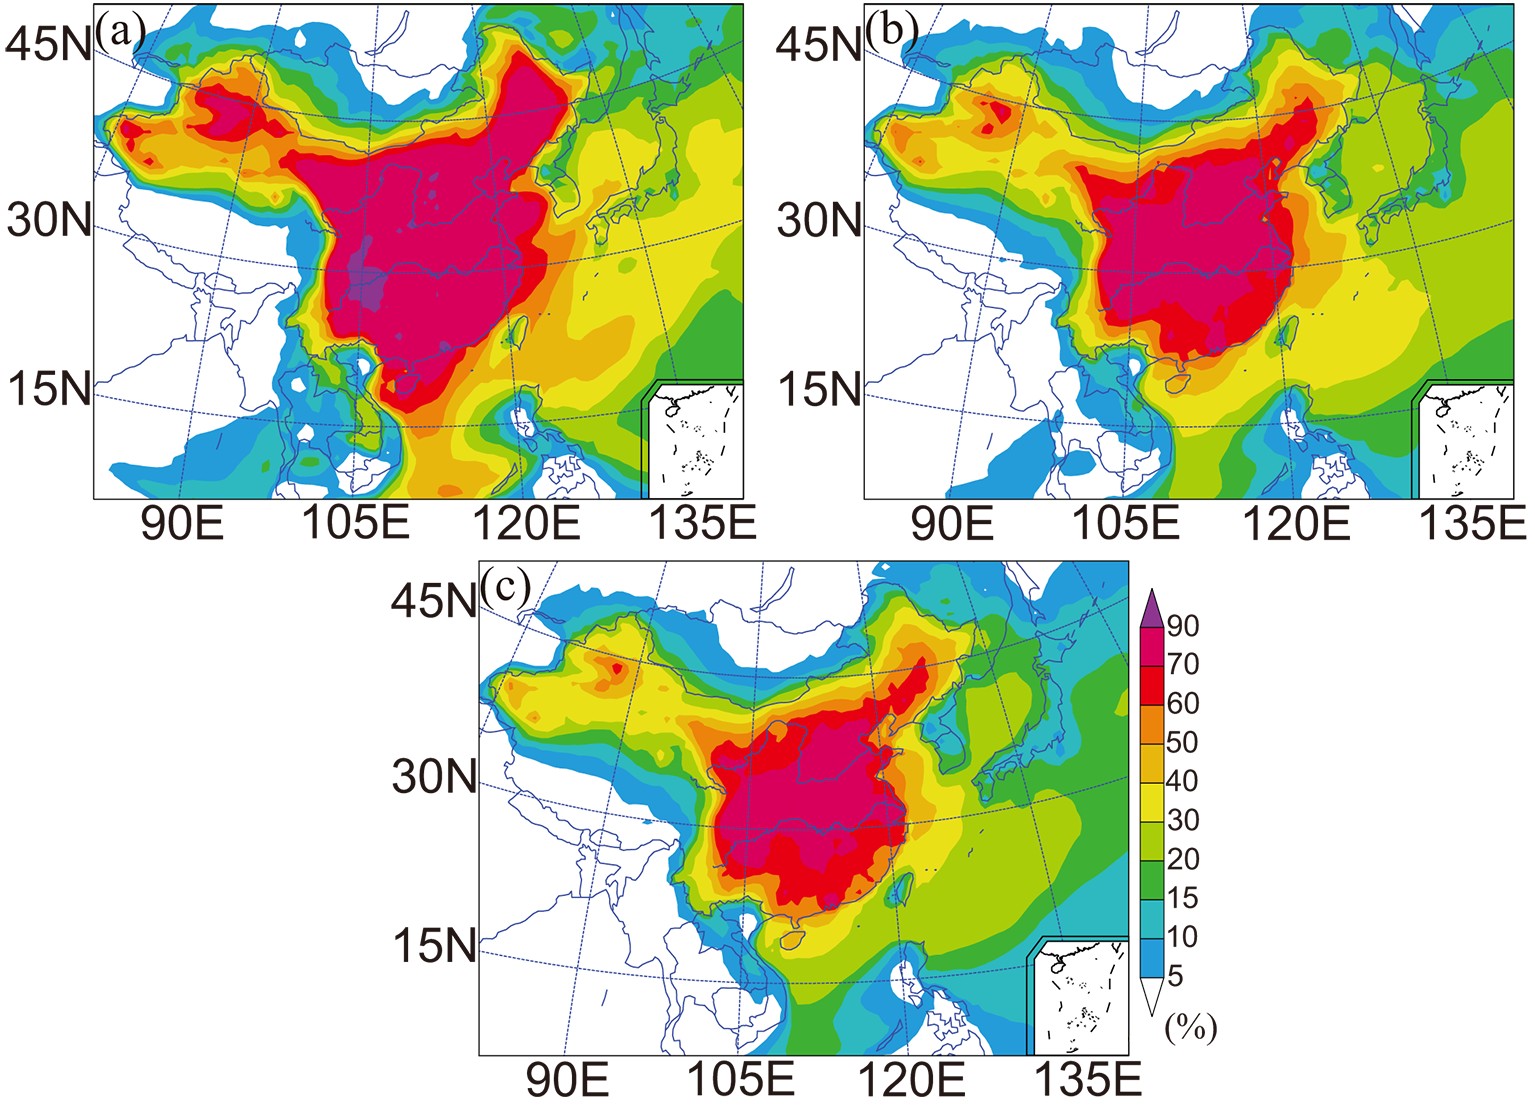
Figure5. Annual mean values of contribution (%) of PM2.5 from the emission sources in China in 2010 (a), 2015 (b), and 2017 (c).


In general, the mass burden of PM2.5 particles in China has decreased significantly, and the contribution from local anthropogenic emissions has also been declining due to the strict emission control measures. The transport contribution of Chinese anthropogenic emission to the PM2.5 mass burden in South Korea has also dropped significantly from 28.0% in 2010 to 15.7% in 2017. As reported by related research (https://data.worldbank.org/indicator/EN.ATM.PM25.MC.M3?locations=KR), the annual averaged PM2.5 mass concentration in South Korea was 29.80 μg m–3 in 2010 and decreased to 25.04 μg m–3 in 2017. The results of this study indicate that the annually-averaged mass concentration of PM2.5 in South Korea attributed to Chinese anthropogenic emission was 8.34 μg m–3 in 2010, and fell to 3.93 μg m–3 in 2017. This relatively low value further strongly suggests that China has achieved remarkable results regarding the control of atmospheric particulate pollution. It is worthy to note, however, that the transboundary contribution of pollutants could be affected by other factors such as altered meteorological field variables and local pollution levels. In future research, we will analyze the seasonal variations and other factors that may contribute to the PM2.5 mass burden.
Acknowledgements. This work is supported by the National Natural Science Foundation of China (Grant Nos. 41830109 and 42077203), and the Strategic Priority Research Program of the Chinese Academy of Sciences (Grant No. XDA19040204).

相关话题/Interannual Variation Transboundary