HTML
--> --> --> Figure1. (a) Stations (dots) with significant correlations between the JJA rainfall and the preceding NDJ(0) Ni?o3 SST index, and regressions (vectors; units: kg m?1 s?1) of the vertically integrated (from surface to 200 hPa) moisture flux with the NDJ(0) Ni?o3 SST index during 1979–2014. (b) Normalized JJA rainfall (blue line) averaged in the rectangular box in (a) and the NDJ(0) Ni?o3 SST index (red line). The gray shading in (a) denotes the topography (units: m). The magenta and the orange solid (hollow) dots represent positive (negative) correlations exceeding the 95% and the 99% confidence levels, respectively. Only flux anomalies that are significant at the 90% confidence level are plotted. The rectangular area denotes MACA.
ENSO is widely considered as an important factor for China’s summer rainfall (Fu and Ye, 1988; Huang and Wu, 1989; Shen and Lau, 1995; Chang et al., 2000; Wang et al., 2000; Wu et al., 2003, 2009, 2010; Xie et al., 2009; Ye and Lu, 2011; Kosaka et al., 2013; He and Wu, 2014; Zhang et al., 2016; He et al., 2017; Li et al., 2017). A low-level anomalous anticyclone over the tropical Northwest Pacific often develops in the El Ni?o mature phase and persists into the following summer (Zhang et al., 1996; Wang et al., 2000; Yang et al., 2007; Li et al., 2008; Xie et al., 2009; Stuecker et al., 2013). The anomalous anticyclone strengthens the northward vapor transport from the tropics to China, and is considered to be an important source of predictability for Chinese summer rainfall (Kosaka et al., 2013; Wang et al., 2013).
Using a newly released high-resolution dataset from 1979 to 2014, Hu et al. (2017) detected that a considerable number of stations in MACA show positive correlations of summer rainfall with the preceding winter Ni?o3 index during 1979–2014. They argued that ENSO could anchor its influence on the summer rainfall anomaly pattern in MACA via the orographic effects associated with anomalous atmospheric circulation. In central China, there are several east–west-oriented mountain ranges, including the Wushan, Bashan and Qinling Mountains and the Loess Plateau. In the post-El Ni?o summer, anomalous Northwest Pacific anticyclones intensify the moisture advection from the tropics, causing increased rainfall when arriving at these mountain ranges.
However, there are still some key issues to be addressed. Previous studies have implied that teleconnection between ENSO and remote areas is not always stable. For example, ENSO’s impact on the Northwest Pacific summer monsoon strengthens after the mid-1970s (Wang et al., 2008; Huang et al., 2010; Xie et al., 2010), and its relationship with the Indian Ocean SSTs and the Indian summer monsoon weakens in recent decades (Kumar et al., 2006; He and Wu, 2018). In addition, the midlatitude atmospheric internal modes, such as the low-frequency wave train, are as important factors as ENSO for the East Asian climate variability (Lu et al., 2002; Ding and Wang, 2005; Kosaka et al., 2009; Li and Sun., 2015; Hu et al., 2018). Does the relationship between ENSO and summer rainfall in central China experience significant interdecadal changes? If so, are there any other factors affecting the interannual variability of summer rainfall in MACA? These questions remain to be answered.
This study aims to address the above questions to gain insight into the mechanism of MACA summer rainfall variations. Firstly, we diagnose whether the relationship between ENSO and summer rainfall in MACA is stable in the period 1951–2018. Then, we investigate the principal sea surface temperature (SST) and the atmospheric modes related to the summer rainfall variability in MACA, and finally estimate the relative contributions of each factor.
3.1. ENSO’s impact on MACA summer rainfall
Figure 1a shows the stations with significant correlation between the June–August (JJA) mean rainfall and the preceding November–January [NDJ(0)] mean Ni?o3 (5°S–5°N, 90°–150°W) SST index during 1979–2014 based on the high-resolution dataset. Most stations with significant positive correlation above the 95% confidence level are located in MACA. The MACA summer rainfall anomalies should be partly caused by the ENSO-induced anomalous anticyclone from the Bay of Bengal to the Northwest Pacific, as it intensifies southwesterly vapor flux from the tropics to MACA and causes vapor convergence in the mountainous area (Hu et al., 2017). For convenience, we use a rectangular area of (28°–37°N, 103°–113°E) (shown in Fig. 1a) to represent MACA. In this area, 126 out of 430 stations show positive correlations above the 95% confidence level. It is clear that the JJA rainfall anomaly in MACA closely coincides with the NDJ(0) Ni?o3 SST anomaly, with the correlation reaching as high as 0.54 (above the 99% confidence level) (Fig. 1b). The evidence indicates that the summer rainfall in MACA is closely related to ENSO during 1979–2014.However, the relatively short record of the high-resolution rainfall dataset limits us to understand whether or not this ENSO–rainfall relationship has interdecadal changes. Here, another rainfall dataset with a coarse resolution that has a longer record from 1951 to 2018 is used, which contains 12 stations in the rectangular area of (28°–37°N, 103°–113°E). The distributions of stations in the two datasets are shown in Fig. 2. The 12-station-averaged JJA rainfall anomaly during 1951–2018 is shown in Fig. 3a, denoted as P index. The correlation of P index and the area-mean JJA rainfall anomaly based on the high-resolution dataset during 1979–2014 is as high as 0.87 (Fig. 2a), above the 99% confidence level. Thus, the P rainfall index is considered as a good proxy to represent the summer rainfall variability in MACA. To examine the evolution of the ENSO–rainfall relationship in a longer period, Fig. 3b shows the correlation in a 21-year sliding window between the NDJ(0) Ni?o3 SST index and the P rainfall index from 1951 to 2018. It is evident that the 21-year sliding correlation is weak (?0.1 to 0.3) before the mid-1970s and during the period of 1982–88, and it is significant at the 90% confidence level in most other periods. Here, another feature to be noted is that the correlation coefficient rises rapidly after the 2000s and it reaches up to 0.64 in 2008. The result denotes that the relationship between ENSO and the summer rainfall in MACA has experienced significant interdecadal changes.
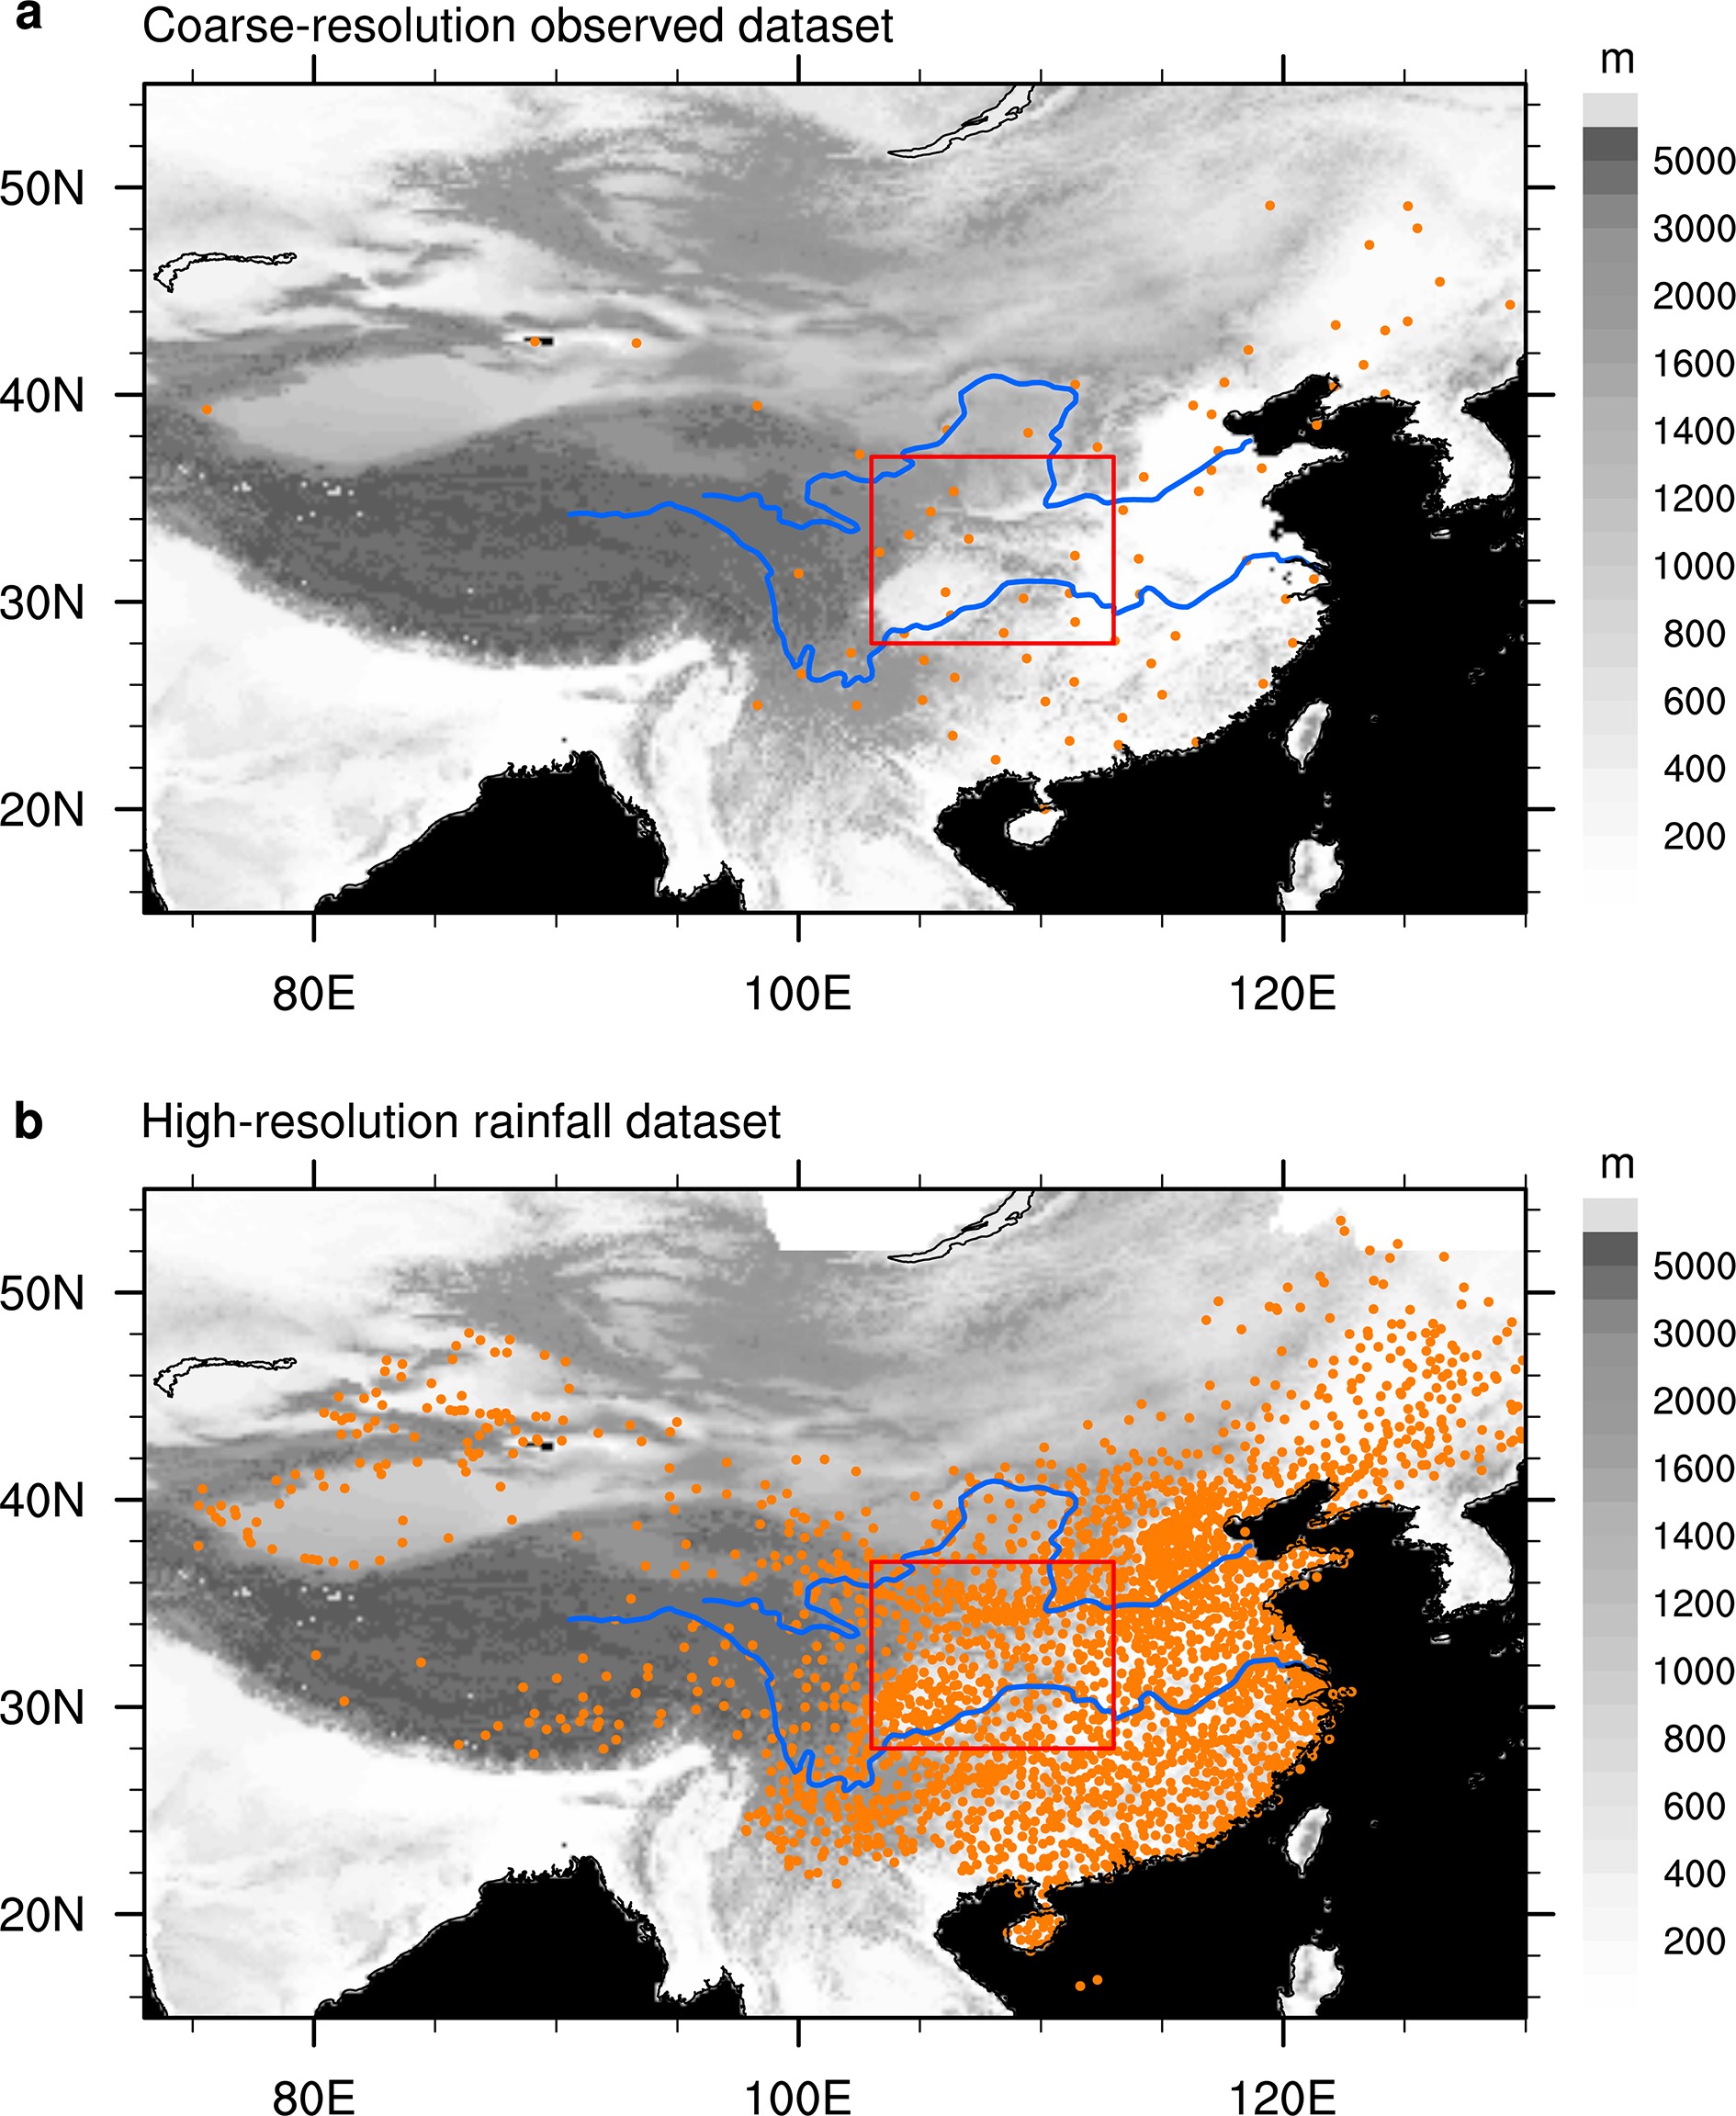 Figure2. The distribution of stations (orange dots) in the coarse-resolution observed dataset with 74 stations (a) and in the high-resolution rainfall dataset (b), superimposed on elevation (gray shading; units: m). Blue lines mark the Yellow and Yangtze rivers. The rectangular area denotes MACA.
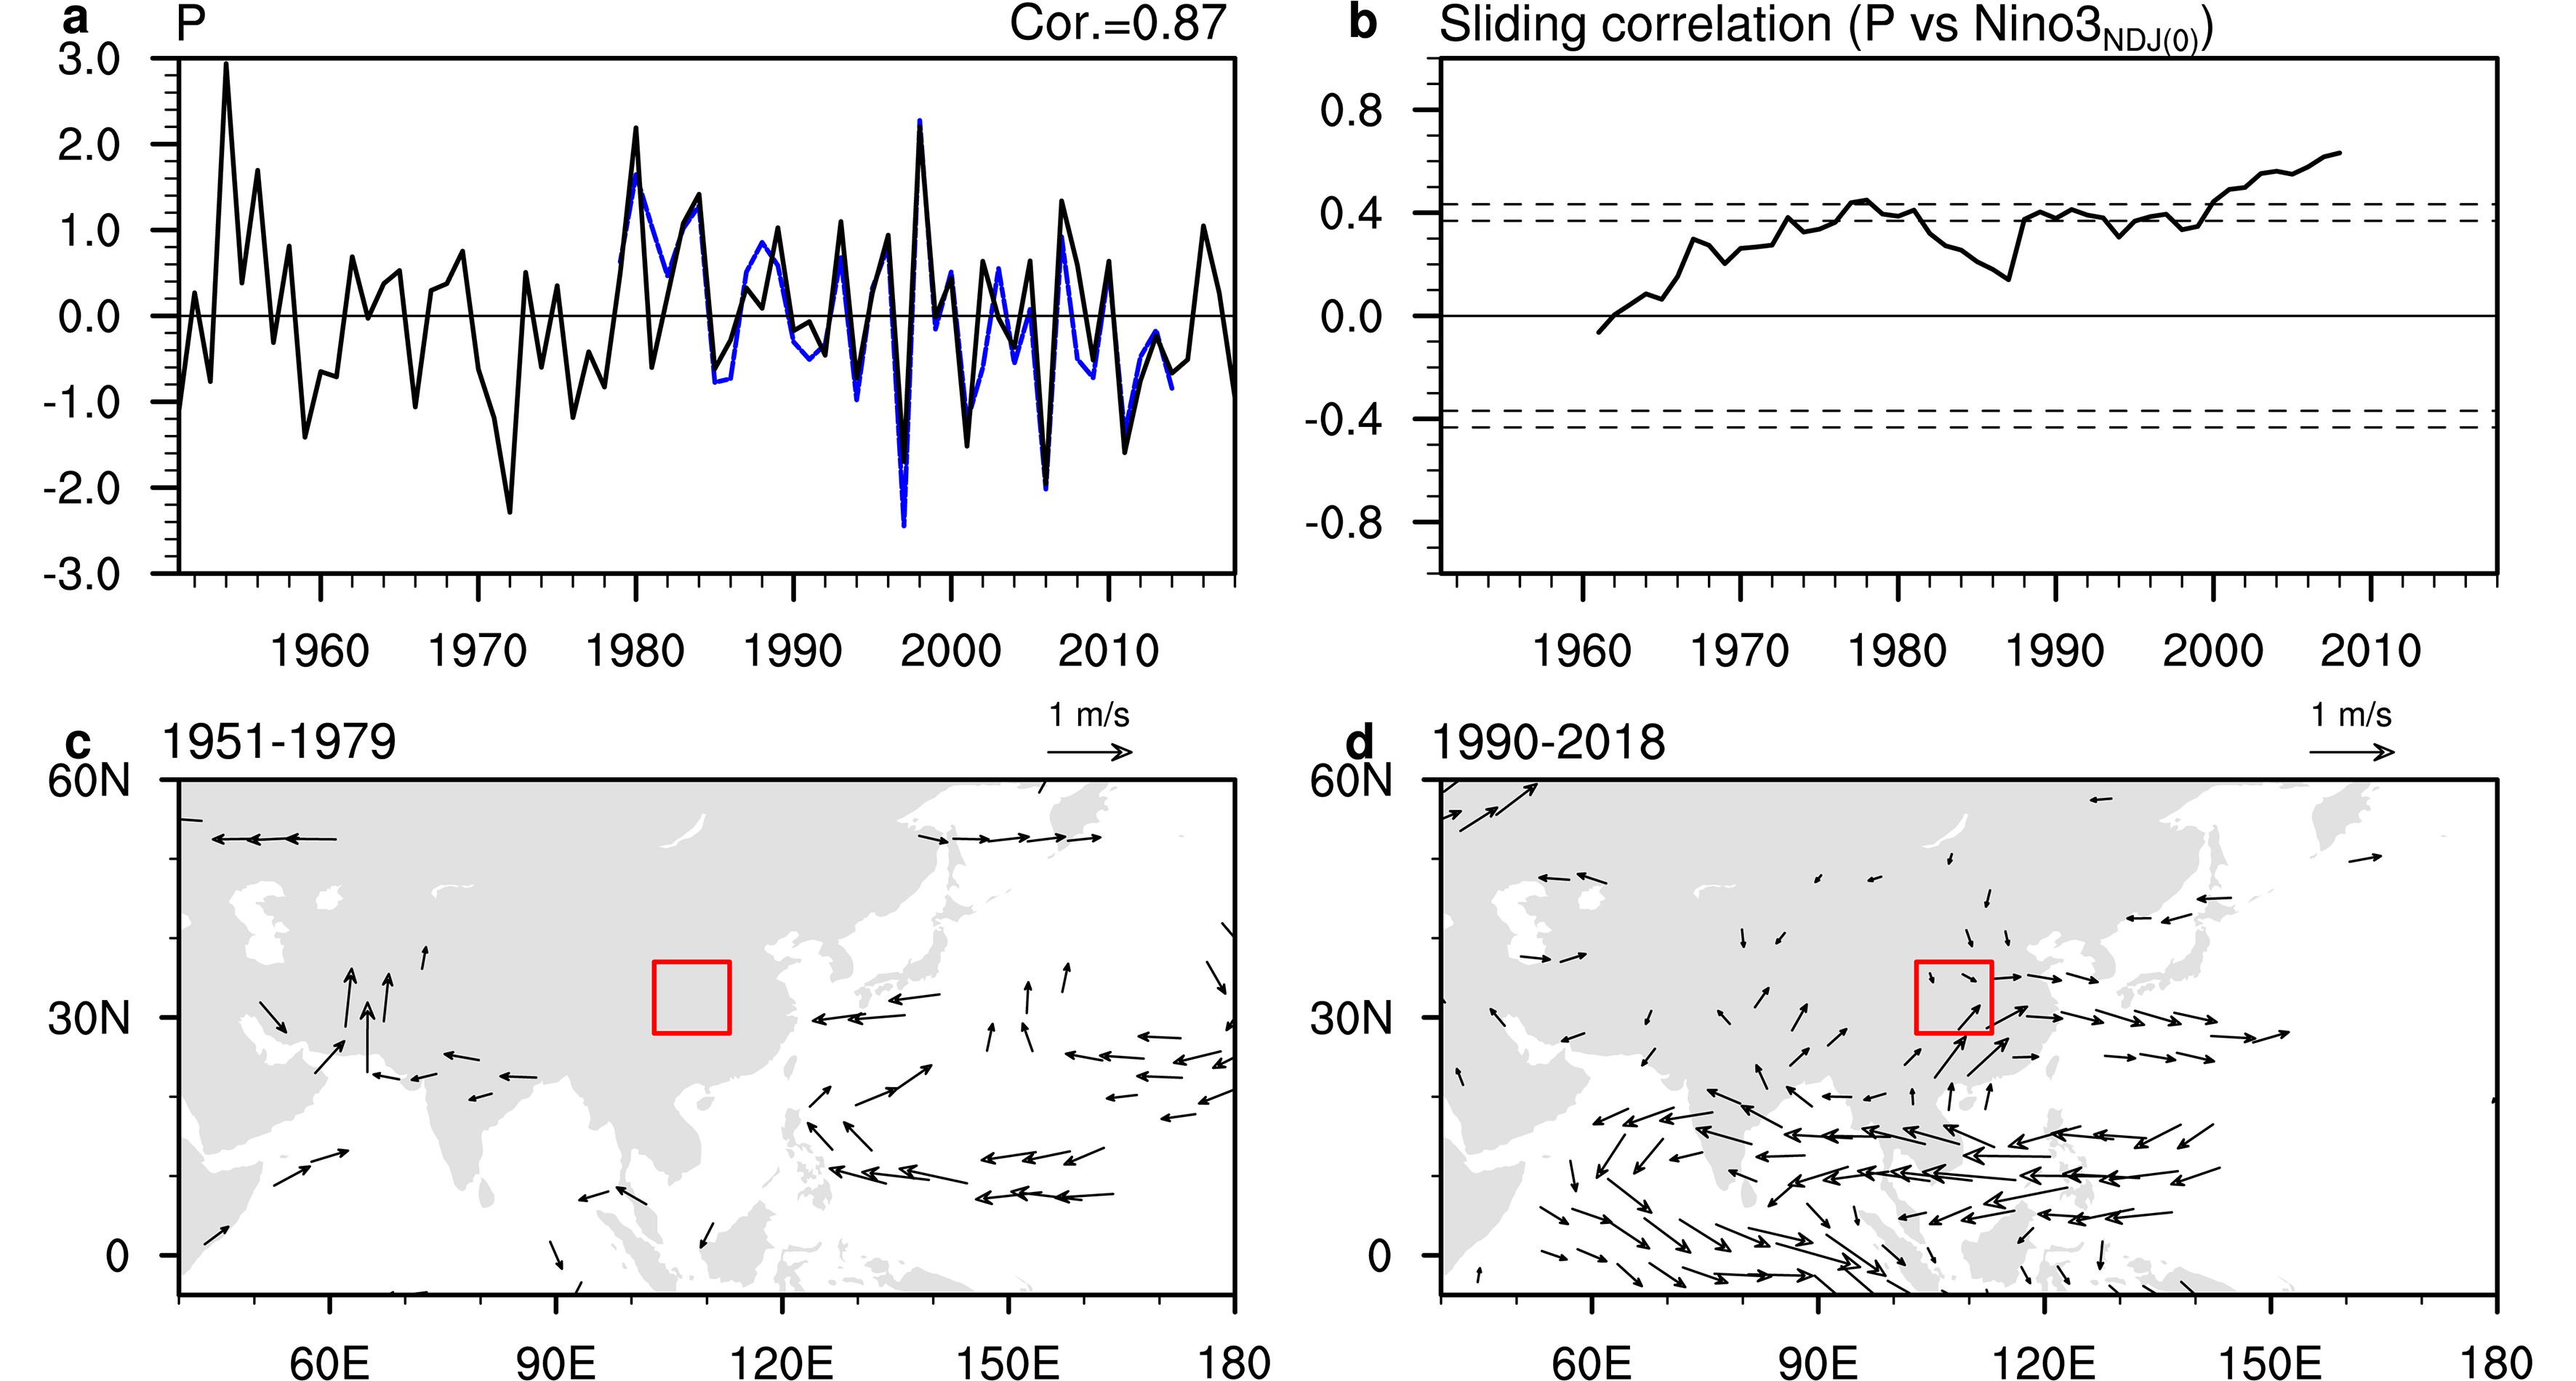 Figure3. (a) Normalized JJA rainfall anomalies averaged in the rectangular box of MACA derived from the coarse-resolution (black line) and the high-resolution (blue line) precipitation datasets, and their correlation is 0.87 during 1979–2014. (b) The 21-year sliding correlation between the normalized JJA rainfall anomaly averaged in the rectangular box derived from the coarse-resolution precipitation dataset and the NDJ(0) Ni?o3 SST index during 1951–2018, and the dotted horizontal lines denote the 95% and 99% confidence levels respectively. (c) Regressions (vectors; units: m s?1) of JJA mean winds at 850 hPa onto the NDJ(0) Ni?o3 SST index during 1951–79. (d) Regressions (vectors; units: m s?1) of JJA mean winds at 850 hPa onto the NDJ(0) Ni?o3 SST index 1990–2018. The rectangular area in (c) and (d) denotes MACA. Only wind anomalies that are significant at the 90% confidence level are plotted.
We further select two periods, 1951–79 and 1990–2018, to document the interdecadal change. The correlation coefficients between P index and the NDJ(0) Ni?o3 SST index during the two periods are 0.10 and 0.54, respectively. Figures 3c and d present the regression of JJA wind velocity at 850 hPa onto the NDJ(0) Ni?o3 SST index for 1951–79 and 1990–2018. Notable differences can be found between these two periods. During 1990–2008, the lower-level wind anomaly forms a dipole pattern over the Indian Ocean–western Pacific. A strong cyclonic anomaly develops along the tropical Maritime Continent and the Indian Ocean, and a significant anticyclonic anomaly extends from the subtropical Northwest Pacific to China. In this case, the anomalous anticyclone over the Northwest Pacific favors moisture transport from the tropics to MACA and causes increased rainfall via the orographic lifting effect (Hu et al., 2017). In contrast, the ENSO-related anomalous anticyclone over the Northwest Pacific is much weaker and locates far to the east during 1951–79. Consequently, the impact of ENSO on the summer rainfall in MACA is weaker in the pre-period than the post-period. The result is consistent with previous studies pointing out that ENSO’s impact on the Northwest Pacific anticyclone strengthens in the recent decades (Wang et al., 2008; Huang et al., 2010; Xie et al., 2010).
2
3.2. Principal modes for the summer rainfall variability
As shown in Fig 3a, ENSO’s teleconnection with the summer rainfall variability in MACA features significant interdecadal changes. This implies that the summer rainfall anomalies may also be governed by other factors. In this subsection, a statistical method called partial least-squares (PLS) regression (Abdi, 2010) is employed to identify the principal factors for the rainfall variability in MACA. PLS regression has been widely used to identify factors for East Asian climate variations (Wu and Yu, 2016).Evidence shows that East Asian summer climate is not only affected by the amplitude of the SST modes but also by the decaying or developing paces of them (Chen et al., 2016b; Jiang et al., 2017). To obtain the seasonally evolving principal SST patterns associated with the JJA rainfall variability in MACA, we conduct PLS regression by the following procedure. First, we construct a predictor array


The first SST mode

 Figure4. Seasonally varying SST anomalies (color shading; dotted areas pass the 95% confidence level; units: K) from the preceding winter [DJF(0)] to the following autumn (SON) in the first (a) and the second (b) leading SST PLS regression modes. The vectors in (a) are the regressions of JJA mean winds at 850 hPa onto the time series of the first leading SST PLS regression modes during 1951–2018. (c) Regression of 200 hPa JJA wind (vectors; only those exceeding the 90% confidence level are shown) and the correlation of the 500-hPa JJA omega field (gray shading) with the time series of the first leading v200 PLS regression mode (PSLv200) during 1951–2018. The dark (light) gray shading in (c) represents positive (negative) correlations above the 90% confidence level. The method of PLS regression is described in section 3.
The first two SST modes explain only about 39.6% of the total variance of the P rainfall index during 1951–2018, leaving a large fraction of unexplained variance. Observational evidence shows that low-frequency wave activities in the midlatitudes are another important source for East Asian summer climate variability (Lu et al., 2002; Ding and Wang, 2005; Kosaka et al., 2009). We thus further look for the principal atmospheric modes associated with the residual rainfall variability via PLS regression. The procedure is similar to that used to detect the SST modes. However, here, the predictor array

The regression (Fig. 4c) of JJA 200-hPa winds onto the PSL1v200 features as a circumglobal wave train structure, with cyclonic centers in Europe, the Middle East, East Asia, the west and east coast of North America, and anticyclonic centers over Kazakhstan, the central North Pacific and North America. Around MACA, there are significant anomalous westerly winds along the latitude of around 30°N from 90°E to 150°E, which may intensify warm advection from the climatological temperature maximum over the Tibetan Plateau, inducing additional upward motion (gray shading in Fig. 4c) in favor of increased rainfall in central China (Sampe and Xie, 2010; Hu et al., 2017). For convenience, this regression map is denoted as the first leading atmospheric mode. The correlation of PSL1v200 with PSL1SST is near zero, indicating the impacts from the first SST and the first atmospheric modes on MACA summer rainfall change are mutually orthogonal. The correlation of PSL1v200 with the P rainfall index is 0.54 (above the 99% confidence level) during 1951–2018, suggesting that the first atmospheric mode explains about 29% of the total rainfall variance.
2
3.3. Relative role of the SST and atmospheric modes
To quantitively evaluate the relative role of the two dominant modes in explaining the MACA summer rainfall variability, we calculate the component of rainfall change from these two modes. The component of rainfall linearly related to the first leading SST mode (Fig. 5a) is denoted by PSL1SST×0.54. Here, PSL1SST is the normalized time series of the SST mode and 0.54 is the regression coefficient of the rainfall index P onto the PSL1SST. Similarly, the linear component of rainfall related to the first leading atmospheric mode (Fig. 5b) is denoted by PSL1v200×0.54, and PSL1v200 is the normalized time series of the atmospheric mode and 0.54 is the regression value of the residual rainfall index Pr onto the PSL1v200. The contribution of the SST mode and the atmospheric mode are independent of each other because PSL1SST and PSL1v200 are mutually orthogonal during 1951–2015. The two modes both explain about 29% of the total rainfall variance during 1951–2018, suggesting their influences on summer rainfall in MACA is of equal importance. However, their influences in MACA summer rainfall change are noticeable in different years. For example, the rainfall anomalies in the years of 1959, 1960, 1961, 1961, 1989 and 1993 are mainly contributed by the atmospheric mode, while the rainfall anomalies in the years of 1997, 1998, 2007, 2010 and 2016 are largely due to the SST mode. The total contribution of the first SST mode and the atmospheric mode is denoted by PSLsum= PSL1SST×0.54+PSL1v200×0.54 (Fig. 5c). The combined index PSLsum is highly correlated with the rainfall index P, with the correlation coefficient up to 0.76 (above the 99% confidence level) during 1951–2018. Therefore, the two modes together can explain most year-to-year variance of MACA summer rainfall.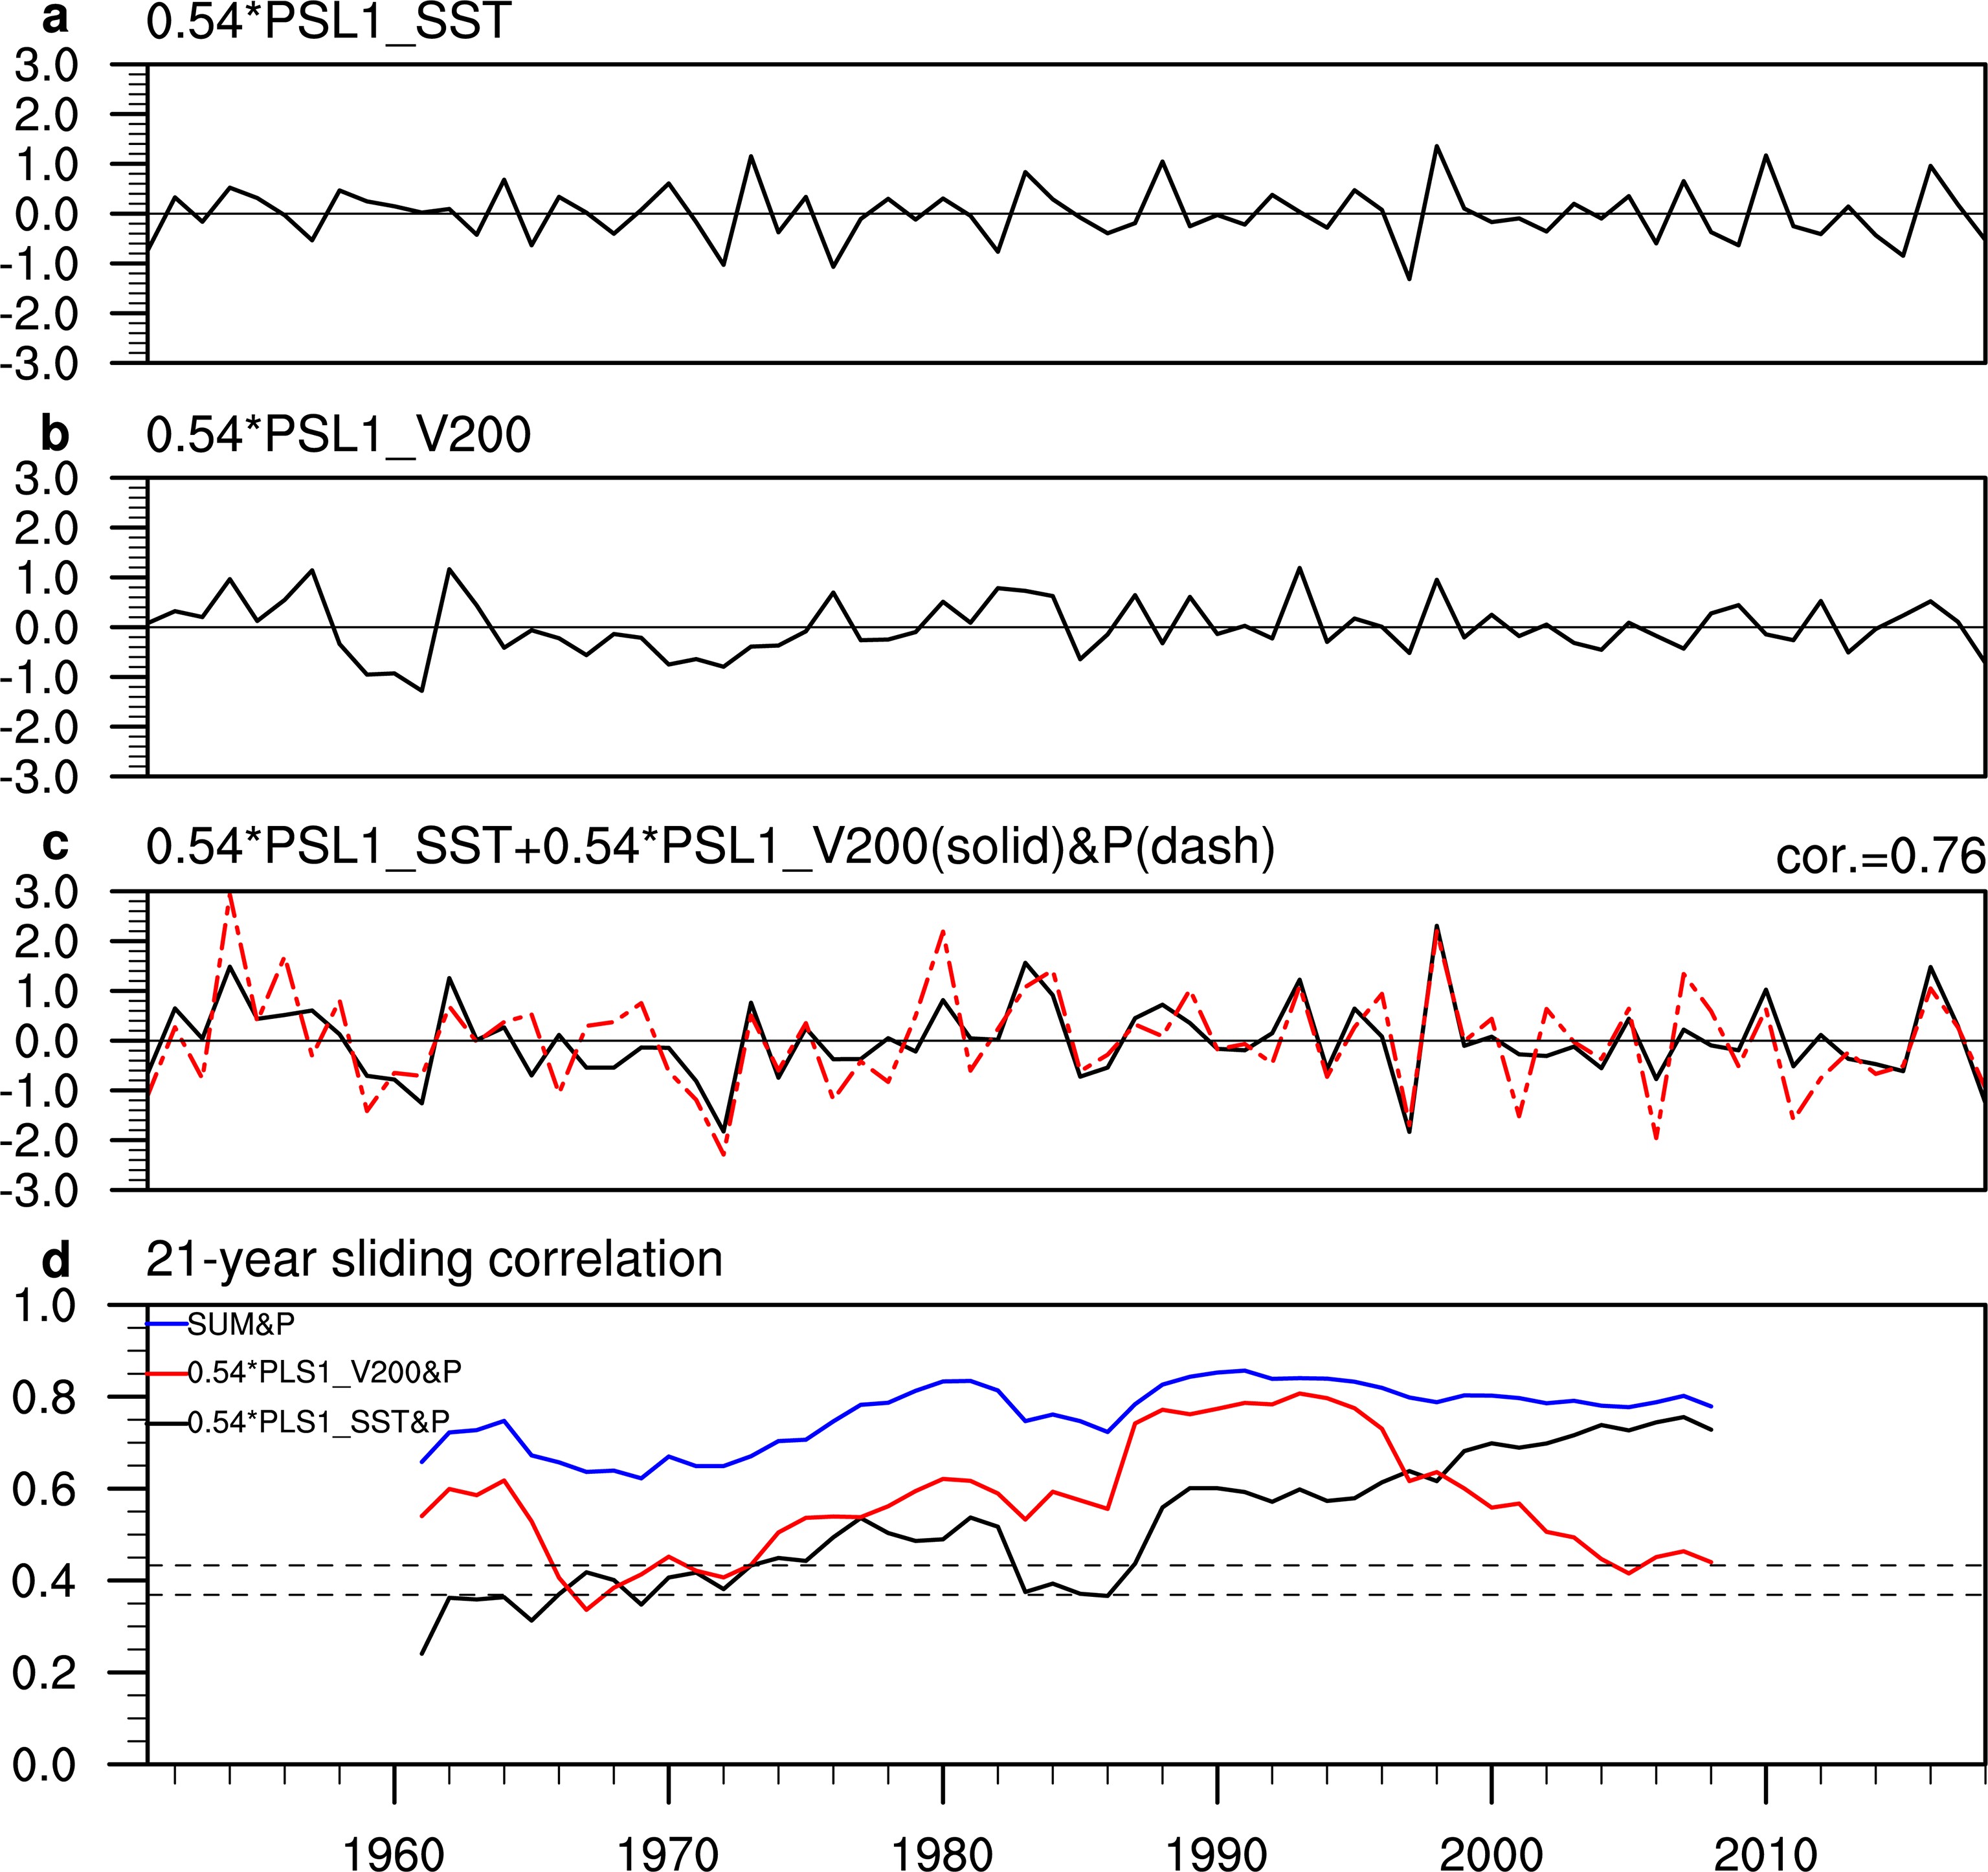 Figure5. Component of rainfall linearly related to the (a) first SST PLS regression modes (PSL1SST×0.54) and (b) first leading v200 PLS regression mode (PSL1v200×0.54). (c) Normalized P summer rainfall index (red dashed line) and the sum (black solid line) of PSL1v200×0.54 and PSL1SST×0.54. (d) 21-year sliding correlation of the P summer rainfall index with PSL1SST×0.54 (black line), PSL1v200×0.54 (red line) and PSL1SST×0.54+PSL1v200×0.54 (blue line) during 1951–2018, where the dotted horizontal lines denote the 95% and 99% confidence levels, respectively.
Figure 5d shows the 21-year sliding correlation of PSL1SST×0.54, PSL1v200×0.54 and PSLsum with the rainfall index P during 1951–2018. The correlation (black line) between PSL1SST×0.54 and the P rainfall index is above the 90% confidence level in most periods, especially after the mid-1960s. After 1986, it rises dramatically and reaches to 0.75 in 2008. Similarly, the 21-year sliding correlation (red line) between PSL1v200×0.54 and the rainfall index P also exceeds the 90% confidence level in most periods. However, it peaks around the early 1960s and the 1990s, and decreases dramatically after the late 1990s. The result shows that both the SST mode and the atmospheric mode influences on summer rainfall in MACA display substantial interdecadal change during 1951–2018. It is worth noting that in the recent decades the influence from the SST mode on summer rainfall in MACA increases while the role of the atmospheric mode decreases, suggesting evolved roles of the SST and atmospheric modes over time. The 21-year sliding correlation of the P rainfall index (black line) with the combined index PSL_sum ranges from 0.62 to 0.86 through the whole period, which is higher and more stable than that with PSL1SST×0.54 and PSL1SST×0.54 alone. In addition, we calculate the sliding correlations of PSL1SST and PSL1v200 with the NDJ(0) Ni?o3.4 SST index during 1951–2018 (Fig. 6). The relationship between the NDJ(0) Ni?o3.4 SST index and the SST mode is tight and stable during 1951–2018, with the 21-year sliding correlations above 0.6 in most periods. Consequently, the interdecadal changes in ENSO’s impact on MACA summer rainfall are consistent with the interdecadal changes in the relationship between rainfall and the SST mode. The relationship between the NDJ(0) Ni?o3.4 SST index and the atmospheric mode is weak, suggesting their impacts on MACA summer rainfall are generally independent of each other.
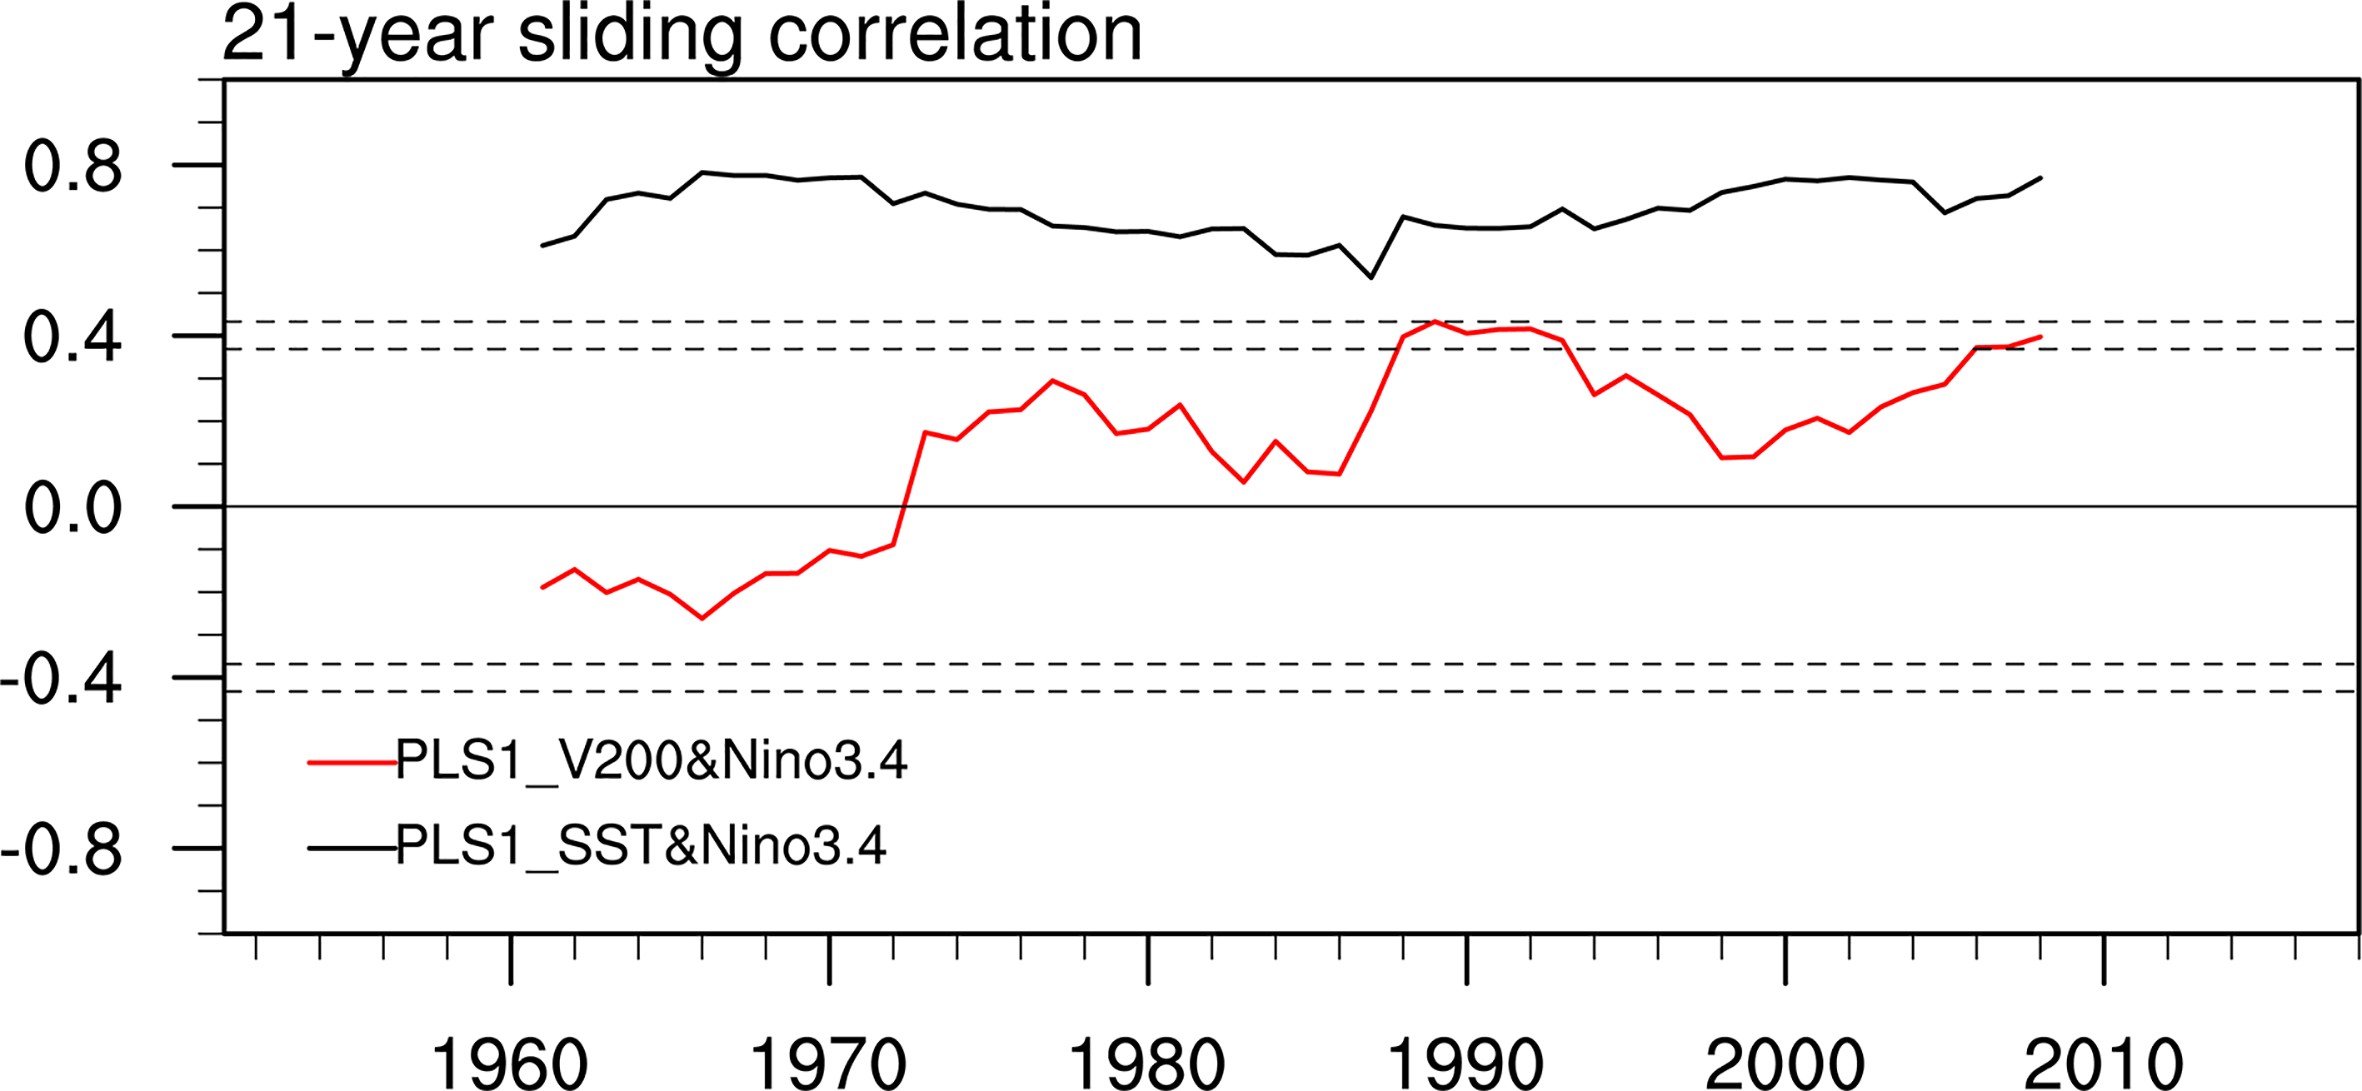 Figure6. 21-year sliding correlation of the NDJ(0) Ni?o3 SST index with PSL1SST (black line) and PSL1v200 (red line) during 1951–2018. The dotted horizontal lines denote the 95% and 99% confidence levels, respectively.
According to the PLS regression analysis, we identified the dominant SST and atmospheric circulation modes that contribute to the JJA rainfall variability in MACA. The SST mode features as a seasonal transition from an El Ni?o-like warming in the preceding winter to a La Nina-like cooling in the following autumn. The time series of the first SST mode presents a higher correlation with the P rainfall index than the NDJ(0) Ni?o3 SST index. It signifies that the summer rainfall variability in MACA is mainly contributed by ENSO events with a rapid phase transition. ENSO’s seasonal phase transitions should be considered for the rainfall prediction in MACA. The atmospheric circulation mode features as a circumglobal wave train structure in the Northern Hemisphere. The contributions of the first SST mode and the first atmospheric mode are mutually independent, and they explain the majority of the rainfall variance with a contribution of 29%, respectively.
Both the contributions of the SST mode and the atmospheric mode have experienced interdecadal change during 1951–2018. The 21-year sliding correlation of the JJA rainfall index with the time series of the first SST mode generally rises gradually from 0.25 in 1961 to 0.75 in 2008, and the correlation with the time series of the first atmospheric mode peaks around the 1990s and declines afterward. The result suggests that the influence of the SST mode on the summer rainfall anomaly in MACA is strengthened, while the influence of the atmospheric mode decreases during recent decades. There may be some possible reasons for the interdecadal changes. First, ENSO amplitudes enhance after the late 1970s, so the relation between eastern Pacific SST and the summer monsoonal circulation over the East Asian–Northwest Pacific region becomes tighter (Wang et al., 2008). Second, the interdecadal change is partly due to changes in the tropical Indian Ocean (TIO) response to ENSO (Huang et al., 2010; Xie et al., 2010). After the late 1970s, the El Ni?o-induced TIO warming persists larger than that before. Third, the decadal change may be partly due to the rise of influences from the Atlantic Ocean SST during recent decades (Yu et al., 2015; Wang et al., 2017; Wang and Yu, 2018). Given the increasing importance of ENSO’s role since the recent decades, monitoring ENSO’s amplitude and its phase transition may help summer rainfall prediction in MACA.
Acknowledgements. This study was jointly supported by the National Key R&D Program of China (2019YFA0606703), the Strategic Priority Research Program of Chinese Academy of Sciences (XDA20060502), the Strategic Priority Research Program of Chinese Academy of Sciences (Grant No. XDA20060502), the National Natural Science Foundation of China (Grant Nos. 41425086, 41661144016, 41706026, 41506003 and 41731173), and the State Key Laboratory of Tropical Oceanography, South China Sea Institute of Oceanology, Chinese Academy of Sciences (Project No. LTO 1704). The authors declare no competing interests.
