HTML
--> --> -->El Ni?o?Southern Oscillation (ENSO) is one of the prominent teleconnection patterns in the atmosphere?ocean system (Neelin et al., 1998). It is an essential factor associated with sea surface temperature anomalies (SSTAs) and has significantly influenced land climate variabilities (Qian et al., 2013; Hu et al., 2016; Tian et al., 2016). For instance, Cayan et al. (1999) found that both daily precipitation and streamflow in winter exhibit strong and systematic responses to the two phases of ENSO in the western United States. The effects of El Ni?o on streamflow have also been extensively investigated (Zhang et al., 2007; Ouyang et al., 2014). Zhang et al. (2007) indicated there is a high possibility that convective precipitation will escalate, potentially causing massive flooding in the lower reaches of the Yangtze River basin during El Ni?o years. Furthermore, the possible physical mechanisms involved in the effect of equatorial Pacific SSTAs on the terrestrial climate have been discussed as well. Wang et al. (2000) indicated that the large-scale western North Pacific (WNP) anomalous anticyclone is the key system that has bridged the equatorial central Pacific (CP) warming and weakened the East Asian winter monsoon. Lin and Lu (2009) demonstrated that the ENSO-related WNP anticyclonic anomaly in the lower troposphere may bring about increased precipitation over the Yangtze River basin, and a southward shift of the Asian jet stream in the upper troposphere may lead to decreased precipitation over the Huaihe and Yellow river basins.
Recent studies have argued that another type of El Ni?o exists, in which the maximum SSTAs appear over the central equatorial Pacific instead of over the eastern equatorial Pacific as with traditional El Ni?o (Ashok et al., 2007; Kug et al., 2009; Ren and Jin, 2011). This type is referred to as CP El Ni?o, and the traditional El Ni?o is referred to as eastern Pacific (EP) El Ni?o. Since the 1970s, CP El Ni?o has occurred more frequently than EP El Ni?o (Ashok et al., 2007). In addition, the ratio of CP El Ni?o to EP El Ni?o events may continue to increase along with global warming, based on climate model projections (Yeh et al., 2009). To date, there have been several studies that have investigated the impacts of these two types of El Ni?o on different climate elements, such as atmospheric convection, global mean temperature, and tropical cyclones (Weng et al., 2009; Wang et al., 2013; Banholzer and Donner, 2014; Yeh et al., 2014). Previous research has also addressed the variations in streamflow under these two types of El Ni?o. In the Mississippi River basin, Liang et al. (2014) showed that EP and CP El Ni?o have opposite impacts on spring soil moisture and the soil water table. Liang et al. (2016) analyzed rivers globally and found that the streamflow in Asian rivers exhibits more complex responses to these different types of El Ni?o, and the regional precipitation is the determining factor of changes in river discharge. Yuan et al. (2016) also pointed out that CP SST shows statistically significant negative influences on the entire Yellow River basin. The above studies indicate that El Ni?o is a pivotal factor that influences the variability of streamflow.
However, little is still known about the separate responses of streamflow in different river basins of East China to EP and CP El Ni?o, as well as the possible physical mechanisms behind those relationships. To address these issues, analyses of the relationships between the two types of El Ni?o and long-term observed streamflow over the Yellow and Yangtze river basins (the major river basins of East China) were carried out, and the possible physical mechanisms behind the relationships were investigated by analyzing the large-scale atmosphere?ocean circulation patterns during EP and CP El Ni?o years. The results of this study contribute to our understanding of land surface hydrological changes, which occur under different large-scale circulation patterns in the earth system, and therefore to improving the accuracy of land surface hydrological predictions.
This paper is organized as follows. Section 2 describes the data and methods used in this study. Section 3 analyzes the observed streamflow and El Ni?o indices, and the relationship between summer streamflow over the Yellow and Yangtze river basins and the two types of El Ni?o events. Section 4 discusses the possible mechanisms behind the abovementioned relationships. Finally, conclusions are drawn in section 5.
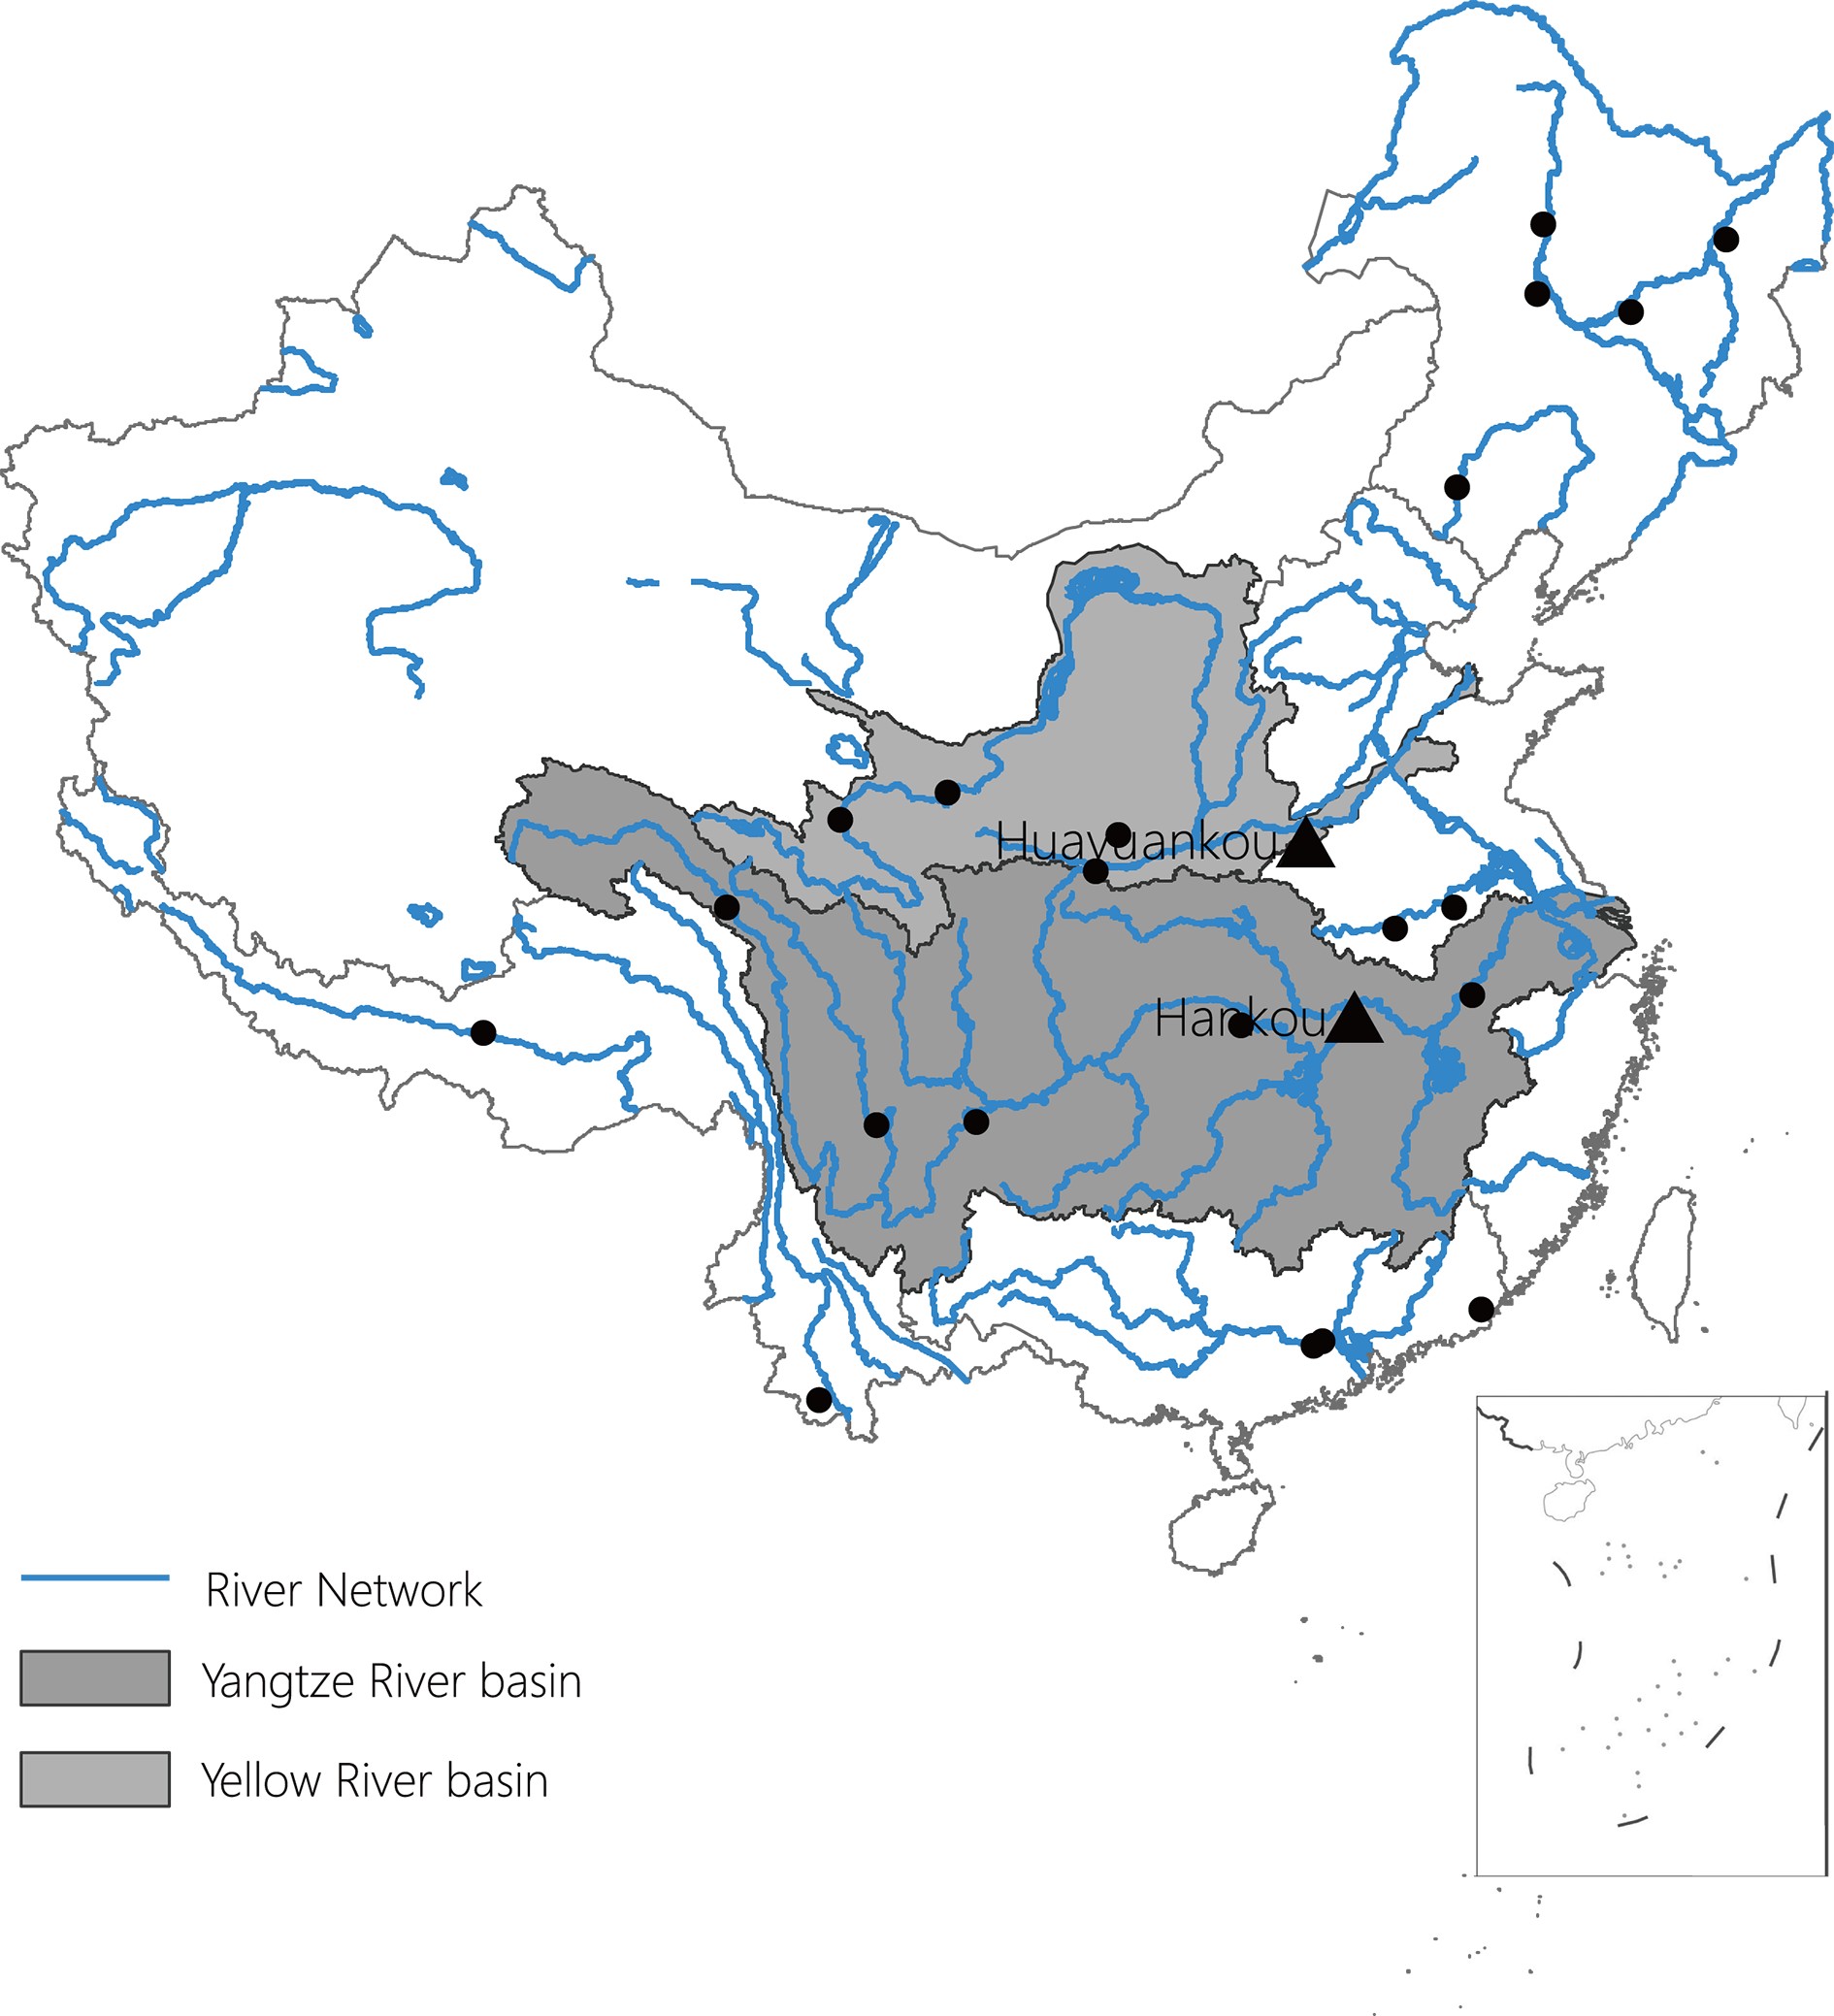 Figure1. Locations of the Yellow and Yangtze River basins and the 23 hydrological stations (black spots), among which the black triangle symbols denote the hydrological stations of Huayuankou and Hankou. Blue lines denote the main river network.
Several Ni?o indices (e.g., Ni?o3, and Ni?o3.4 and Ni?o4) have been defined based on sea surface temperature in different regions of the equatorial Pacific, and widely used in research (e.g., Ashok et al., 2007; Kug et al., 2009; Ren and Jin, 2011). In order to express the two different types of El Ni?o, i.e., EP and CP El Ni?o, we used the Ni?o3 index (hereafter referred to as the EP index) to represent EP El Ni?o (Trenberth, 1997) and the El Ni?o Modoki index (hereafter referred to as the CP index) to represent CP El Ni?o (Ashok et al., 2007). The EP index was obtained from NOAA’s Climate Prediction Center
The CP index was defined according to the method of Ashok et al. (2007):
where [SSTA]C, [SSTA]W and [SSTA]E are the regionally averaged SSTA values over (10°S?10°N, 165°E?140°W), (15°S?5°N, 110°?70°W) and (10°S?20°N, 125°?145°E), respectively. Both the EP and CP indices were calculated from the ERSST.v4 dataset, and the relevant regions are denoted in Figs. 2c and d. To define the two types of El Ni?o, we defined typical EP (CP) El Ni?o events when the amplitude of the anomalous EP (CP) index was equal to or greater than 0.8 times its standard deviation (0.8 STD). Based on this approach, there were three EP El Ni?o years (1983, 1998 and 2007) and five CP El Ni?o years (1991, 1992, 1995, 2003 and 2005) from 1980 to 2008. These EP and CP El Ni?o years were in accordance with previous results (e.g., Ashok et al., 2007; Wang et al., 2013). Aside from the chosen EP and CP years, the remaining years are referred to as “normal” years.
 Figure2. The winter time-series of (a) EP index and (b) EP index, and composite SSTAs in (c) EP and (d) CP El Ni?o years (units: ℃) for 1980?2008. The dash-dotted line in (a, b) denotes the corresponding 0.8 STD, and the areas of the black solid boxes in (c, d) are used to define the EP and CP El Ni?o index, respectively.
The Yellow and Yangtze river basins are two major river basins in East China, and two hydrological stations (e.g., Huayuankou and Hankou) are located in the lower reaches of each river basin, respectively. Therefore, these hydrological stations were selected to represent the two abovementioned river basins. The methods of linear correlation and regression analysis were used to explore the relationship between streamflow and the two types of El Ni?o years (positive index years). Composite analysis was applied to reinforce our results. All statistical significance tests for correlation and regression were performed using a two-tailed Student’s t-test. The seasonal anomalies were the departures from their respective climatic states for the study period (i.e., 1980?2008), and linear trends were extracted before analysis. For simplicity, the terms “winter” and “summer” are used to represent December?January?February (DJF) and the following June?July?August, respectively.
3.1. Long-term summer streamflow variations
To illustrate the evolution of streamflow, Fig. 3 shows the time series of summer streamflow anomalies for the two major river basins of East China from 1980?2008 in EP and CP El Ni?o years. The majority of the river basins’ streamflow anomalies display above-normal streamflow in EP years, but complicated variabilities in CP years, in which the streamflow varies in different river basins. Specifically, the anomalous streamflow displays as positive in EP years over the two river basins (based on the Huayuankou and Hankou hydrological stations). In contrast, in all CP years except 2005, the anomalous streamflow shows as negative at Huayuankou hydrological station, whereas it does not display such clear change at Hankou hydrological station (slightly positive). The composite anomalous streamflow in both EP and CP years is also presented in Fig. 3. It is clear that, over the Yellow River basin, the anomalous streamflow is above (below) the multi-year average, with a mean volume of 642.84 m3 s?1 (?276.48 m3 s?1) in EP (CP) years. Meanwhile, over the Yangtze River basin, the anomalous streamflow is positive in EP years, with a mean volume of 8207.96 m3 s?1, and in CP years it also shows as slightly positive, with a volume of 1111.86 m3 s?1. Figure3. Annual summer streamflow anomalies in the two river basins during 1980?2008: (a) Huayuankou hydrological station; (b) Hankou hydrological station. The right-most part in the plots shows the composite volume of the streamflow in EP and CP years (units: m3 s?1). The red (blue) asterisks indicate the EP (CP) El Ni?o years. Note that the streamflow data at Huayuankou hydrological station are missing for 2008.
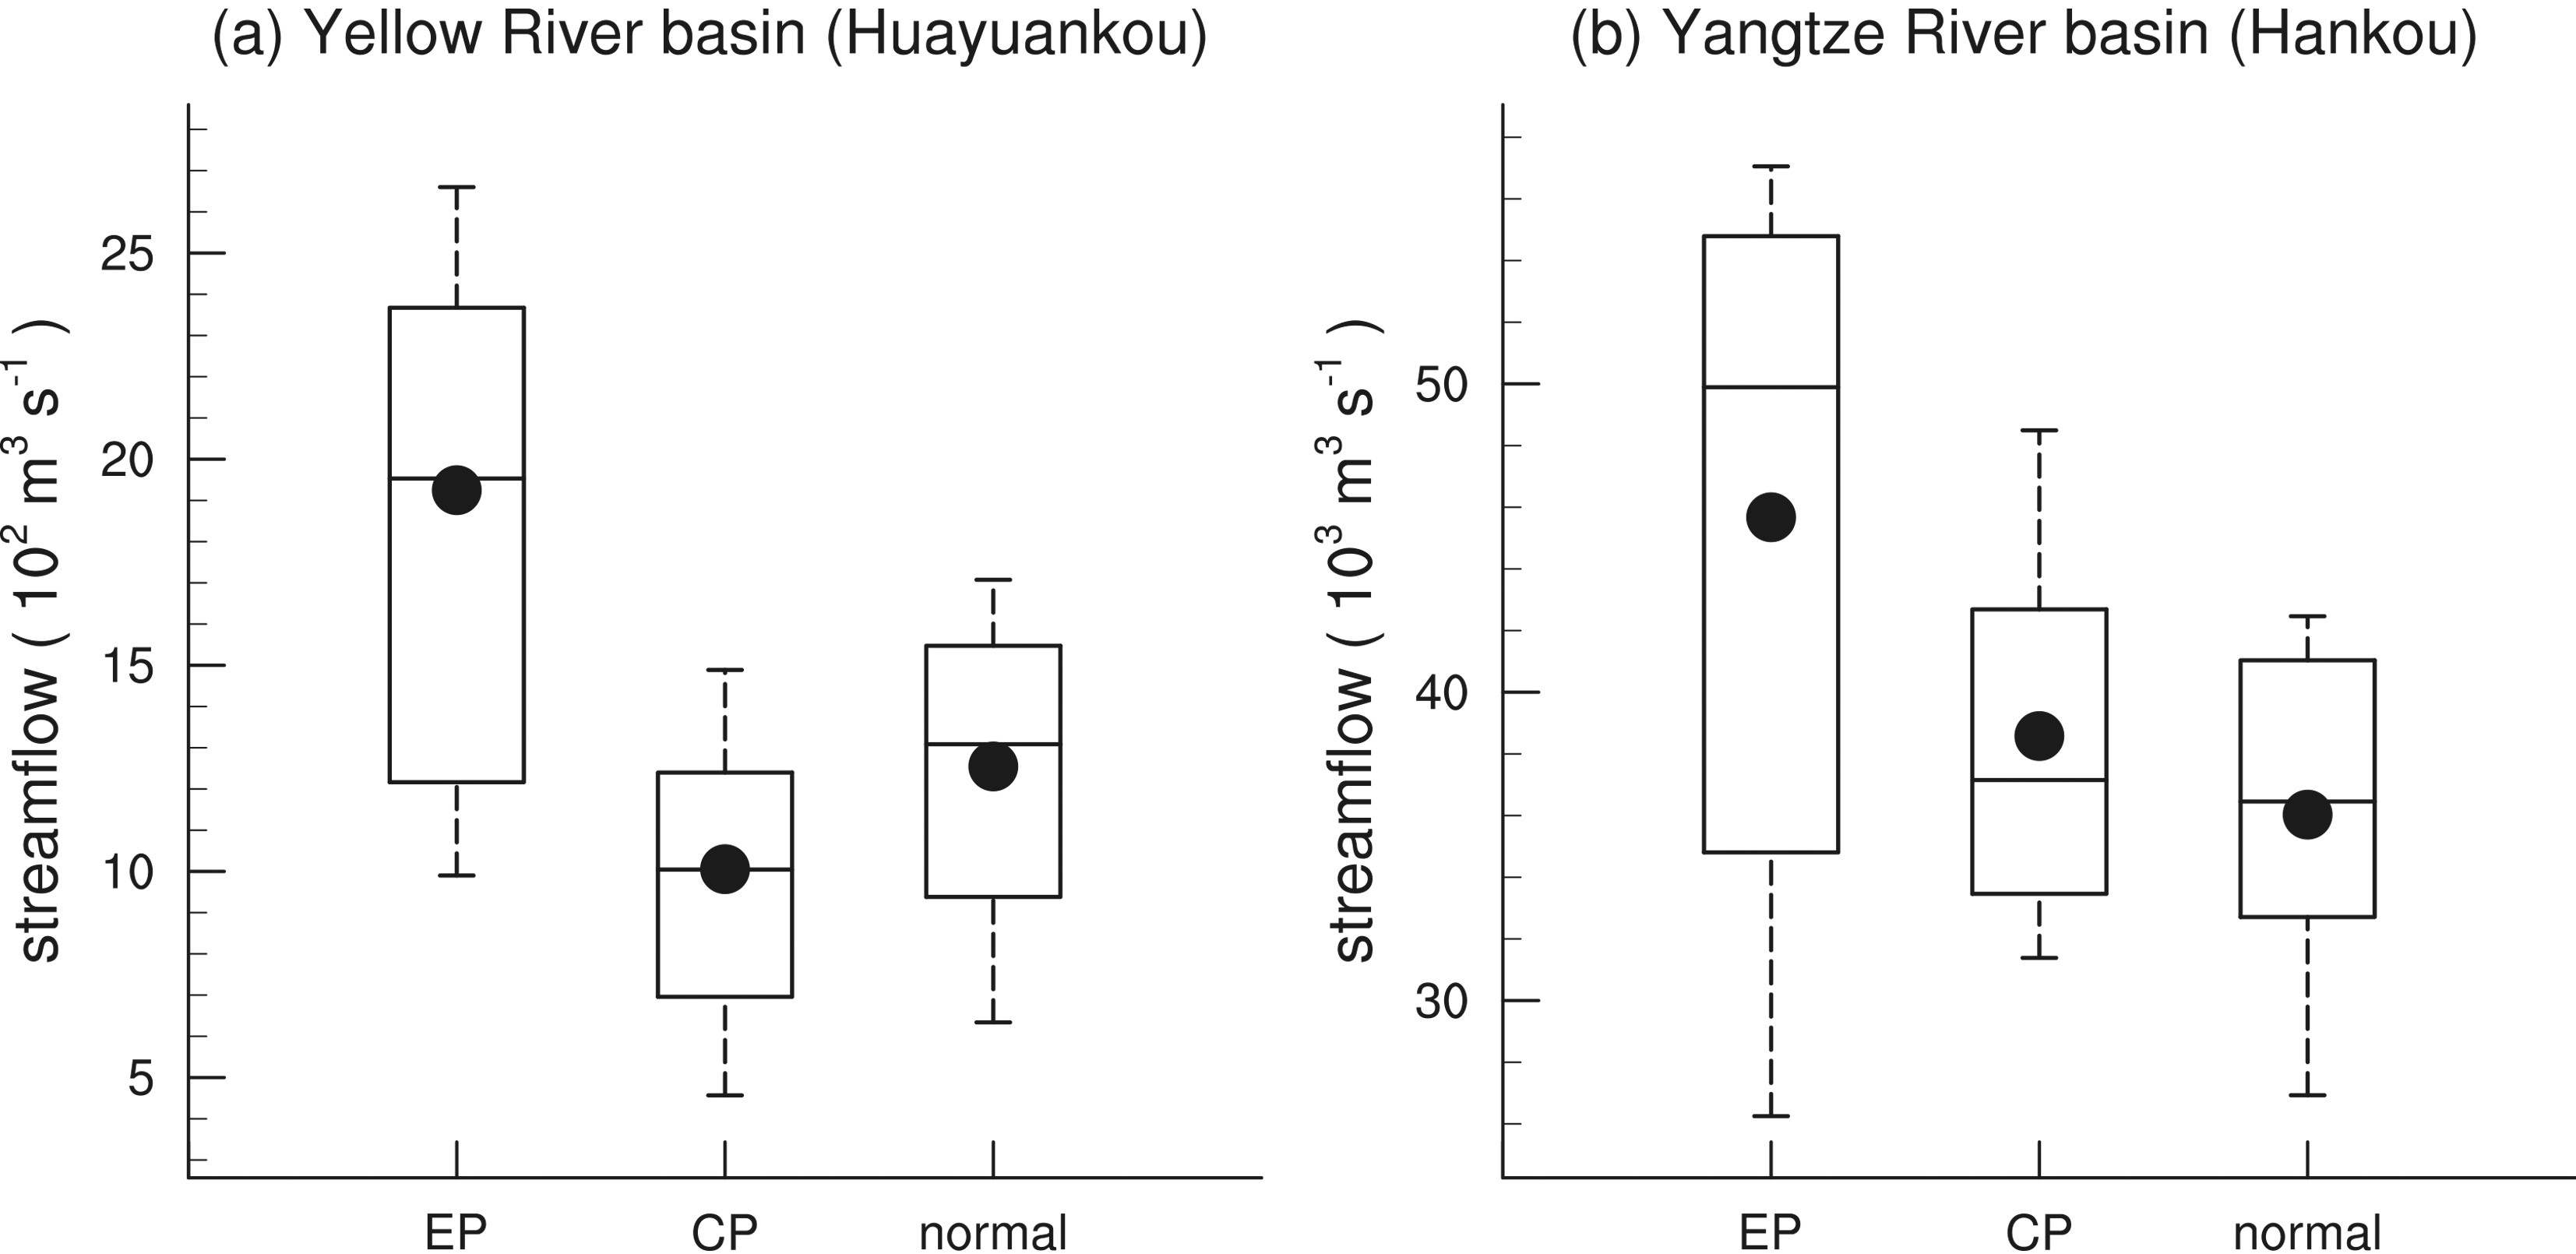 Figure4. The mean and percentiles of summer streamflow over the Yellow and Yangtze river basins for EP, CP and normal years. The top (bottom) of the whiskers represents the 90th (10th) percentile; the top (bottom) of the boxes represents the 75th (25th) percentile; the middle line represents the 50th percentile; and the black dot in the boxes represents the mean volume of streamflow.
Figure 4 shows the mean and percentiles of summer streamflow over the Yellow and Yangtze river basins for EP, CP and normal years. Consistent with Fig. 3, the amplitude of the streamflow volume at Huayuankou hydrological station is far smaller than that at Hankou hydrological station. At Huayuankou hydrological station (Fig. 4a), the mean volume is lowest in CP years, highest in EP years, and in-between in normal years. Moreover, the 90th percentile of the volume of streamflow (1488.74 m3 s?1) in CP years is even lower than the median volume (1953.08 m3 s?1) in EP years and the 75th percentile of the volume (1547.29 m3 s?1) in normal years, indicating that during CP years the streamflow is smallest and there might be a high probability of hydrological drought. At Hankou hydrological station (Fig. 4b), the mean streamflow volume in EP years is abundant and far greater than that in CP and normal years, and its amplitude range spans widely. The mean volume (45675.1 m3 s?1) is less than the median volume (49893.0 m3 s?1), implying that more than 50% of samples are higher than the average, and the 90th percentile of the volume reaches 57055.3 m3 s?1. Large volumes of streamflow are likely to cause riverbanks to collapse and cause flooding over the related river basin.
Figure 5 is a scatterplot of the normalized summer streamflow anomaly against the EP and CP indices, with the lines of best fit (determined by the least-squares method) shown for the warm and cold phases of the EP and CP indices, respectively. It can be seen from Fig. 5 that changes in streamflow are asymmetrical in (both EP and CP) La Ni?a and El Ni?o years over the Yellow River basin, but symmetrical over the Yangtze River basin. The negative Ni?o index is slightly correlated with the streamflow. The following discussions mainly focus on the warm phases. At Huayuankou hydrological station (Figs. 5a and c), the correlation coefficient of the streamflow anomaly with the EP index is 0.39, and that with the CP index is ?0.37. At Hankou hydrological station (Figs. 5b and d), the correlation coefficients of the streamflow anomaly with the EP and CP indices are 0.72 and 0.48, respectively. All the correlation coefficients are statistically significant at the 90% confidence level.
 Figure5. Normalized EP index values plotted against the normalized summer streamflow anomaly at (a) Huayuankou hydrological station (over the Yellow River basin) and (b) Hankou hydrological station (over Yangtze River basin). (c, d) As in (a, b) but for the CP index. Square symbols denote the EP or CP years’ streamflow anomalies. The lines of best fit for positive and negative Ni?o index (EP and CP index, respectively) values (Slope) and the correlation coefficients (R) are shown at the bottom of each plot. The correlation coefficients all pass the significance test at the 90% confidence level.
Consequently, Figs. 3-5 all show that the anomalous summer streamflow over the Yellow River basin is positive in EP years but negative in CP years, while over the Yangtze River basin it is positive in both EP and CP years, despite the composite streamflow anomaly in CP years being only slightly positive during 1980?2008.
2
3.2. Impacts of the two types of El Ni?o on summer precipitation and ET
The above analyses show distinctly different changes of observational streamflow in EP and CP years over the Yellow and Yangtze river basins, respectively. In this subsection, we further analyze the connection between these two types of El Ni?o and the changes in surface hydrology elements, especially summer streamflow.Streamflow at a downstream station mainly depends on the rainfall over the entire upstream area in the river basin, which is triggered by evaporation, soil moisture, human activities, and so on (Gardner, 2009). Precipitation is an essential water source of streamflow and it is necessary for it to be taken into account when analyzing the variations of streamflow. Figure 6 shows the correlation between the two Ni?o indices and anomalous precipitation and the distributions of the composite anomalous precipitation in EP and CP years. Significant positive correlations between precipitation and the EP index are found primarily in the middle of mainland China between 25°N and 35°N, where the Yangtze River basin is located. The basin-average correlation coefficient is significantly positive (0.52) over the Yangtze River basin, whereas it is non-significantly negative over the Yellow River basin. The correlation coefficients between the CP index and streamflow (Fig. 6b) show that the Yellow River basin is dominated by negative correlation and the basin-average correlation coefficient is ?0.31, while most of the Yangtze River basin shows non-significant positive correlation. Figures 6c and d display the distributions of composite anomalous precipitation. They are consistent with the correlation maps. During EP years, the Yangtze River basin is dominated by positive anomalous precipitation (basin average: 0.69 mm d?1), whereas slightly negative anomalous precipitation appears in the middle reaches of the Yellow River basin (0.08 mm d?1). In CP years, clear negative anomalies appear in southern China, with some of them in the region south of the Yangtze River basin. The basin-average precipitation anomaly is –0.14 mm d?1 over the Yangtze River basin and 0.06 mm d?1 over the Yellow River basin, which are similar to those in EP years.
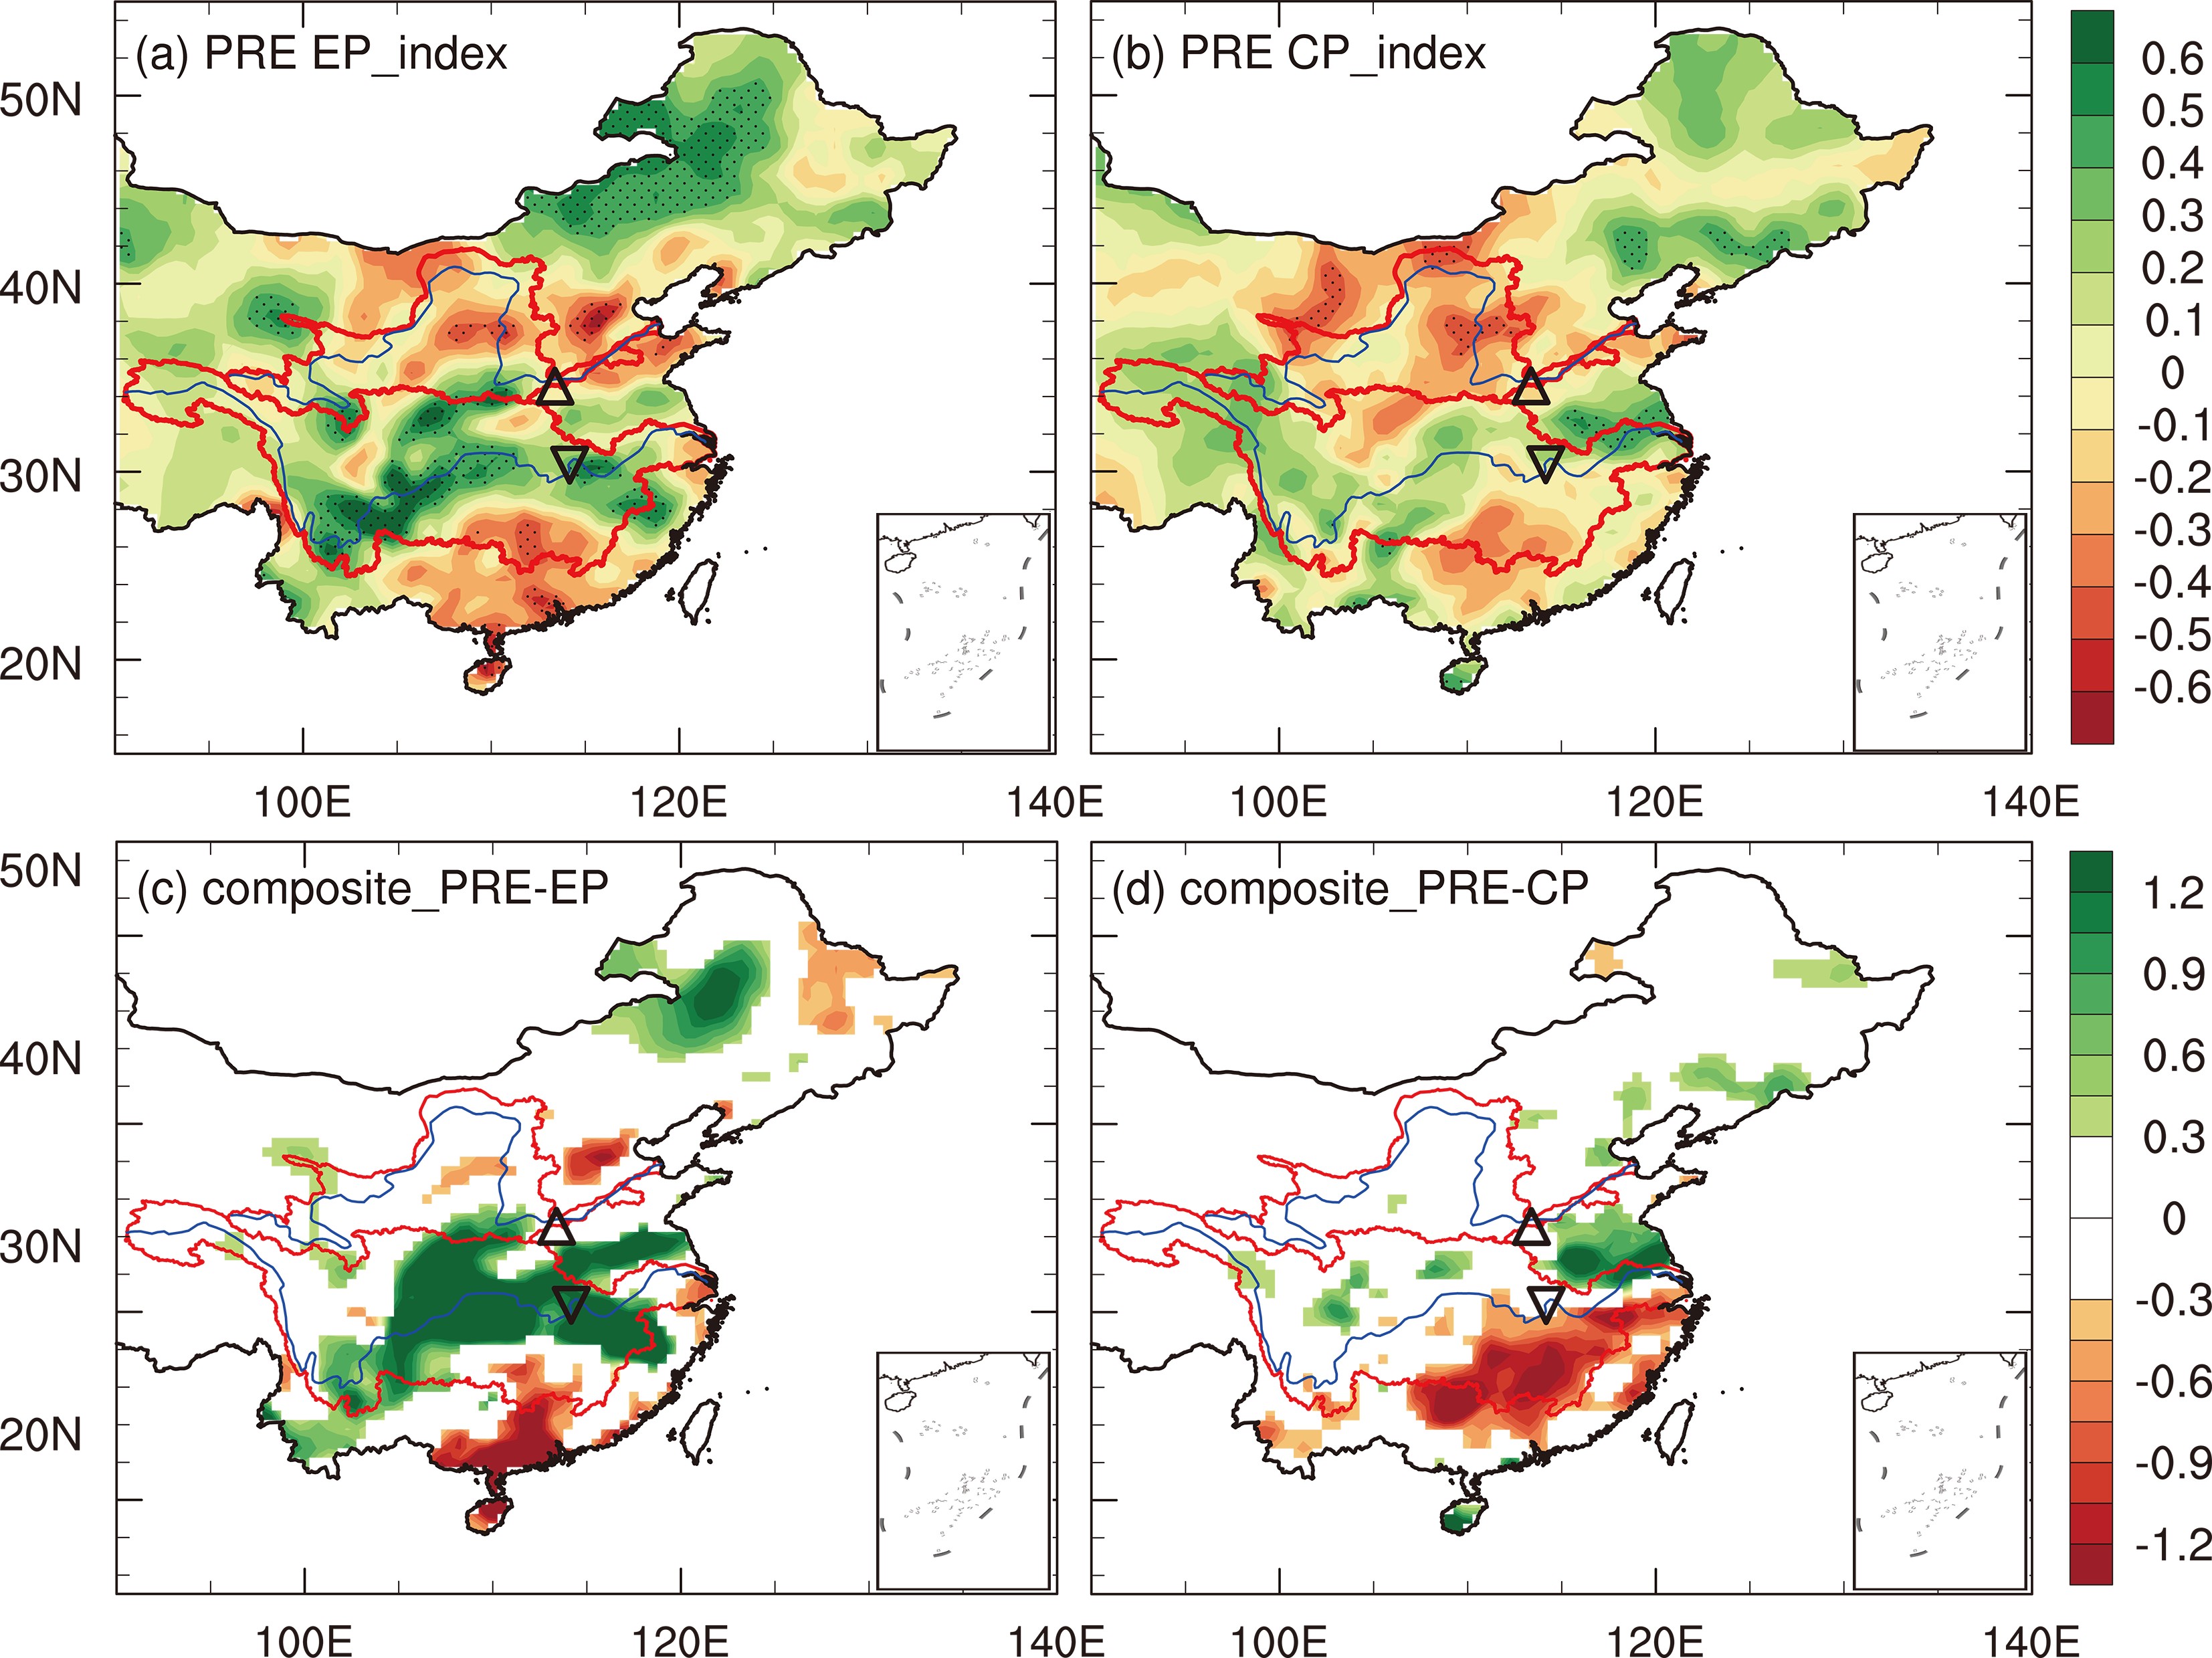 Figure6. (a, b) Correlation of anomalous summer precipitation with (a) EP index and (b) CP index. Dotted regions are significant at the 90% confidence levels. Black (inverted) triangles denotes (Hankou) Huayuankou hydrological station. The red curves surrounding regions are the ranges of the two river basins. (c, d) Composite maps of anomalous summer precipitation in (c) EP and (d) CP years, but with the lower anomalies (?0.3 to 0.3 mm d?1) left blank (units: mm d?1).
Apparently, over the Yellow River basin in both EP and CP years, the area-average precipitation anomalies are very small and nearly the same, indicating that precipitation is not the only factor affecting streamflow over this basin. Actually, in arid and semiarid areas, the contributions of ET to streamflow are similarly, if not more, important than those of precipitation (Sun et al., 2017). Thus, we further discuss the changes in ET over these two river basins. Figure 7 shows the same distribution maps as Fig. 6, but based on the PM-MOD ET dataset. On the whole, the correlations between ET and the EP index are negative, but between ET and the CP index they are positive over the mainland. The correlation centers all appear in Northeast China. The Yellow River basin, which can mainly be classed as arid/semiarid, displays negative correlation with the EP index (Fig. 7a; basin-average correlation: ?0.22), indicating that in EP years the ET will be reduced and more soil water will be retained. In CP years, most parts of the Yellow River basin display non-significant negative correlation (Fig. 7b). Likewise, the composite distributions of ET are also in accordance with the distribution patterns of correlation. The Yellow River basin shows negative ET anomalies (basin average: ?0.05 mm d?1) in EP years, and positive ET anomalies (basin average: 0.02 mm d?1) in CP years. The characteristic changes in ET over the Yangtze River basin show similar features as those over the Yellow River basin, but the area-average values are higher than those over the Yellow River basin (the anomalous ET average value is ?0.18 mm d?1 in EP years and 0.07 mm d?1 in CP years). However, it should be noted that there are no ground observations of ET over a large area, and model-simulated ET usually contains large uncertainties (e.g., Wang et al., 2016). Thus, we also used LandFlux-EVAL to verify the results from the PM-MOD dataset. It was found that both ET datasets have consistent characteristics of variation, but the magnitude of LandFlux-EVAL is higher than that of PM-MOD in China. A more detailed comparison of the two ET datasets is provided in the supplemental material [Fig. S1 and Table S1 in the electronic supplementary material (ESM)].
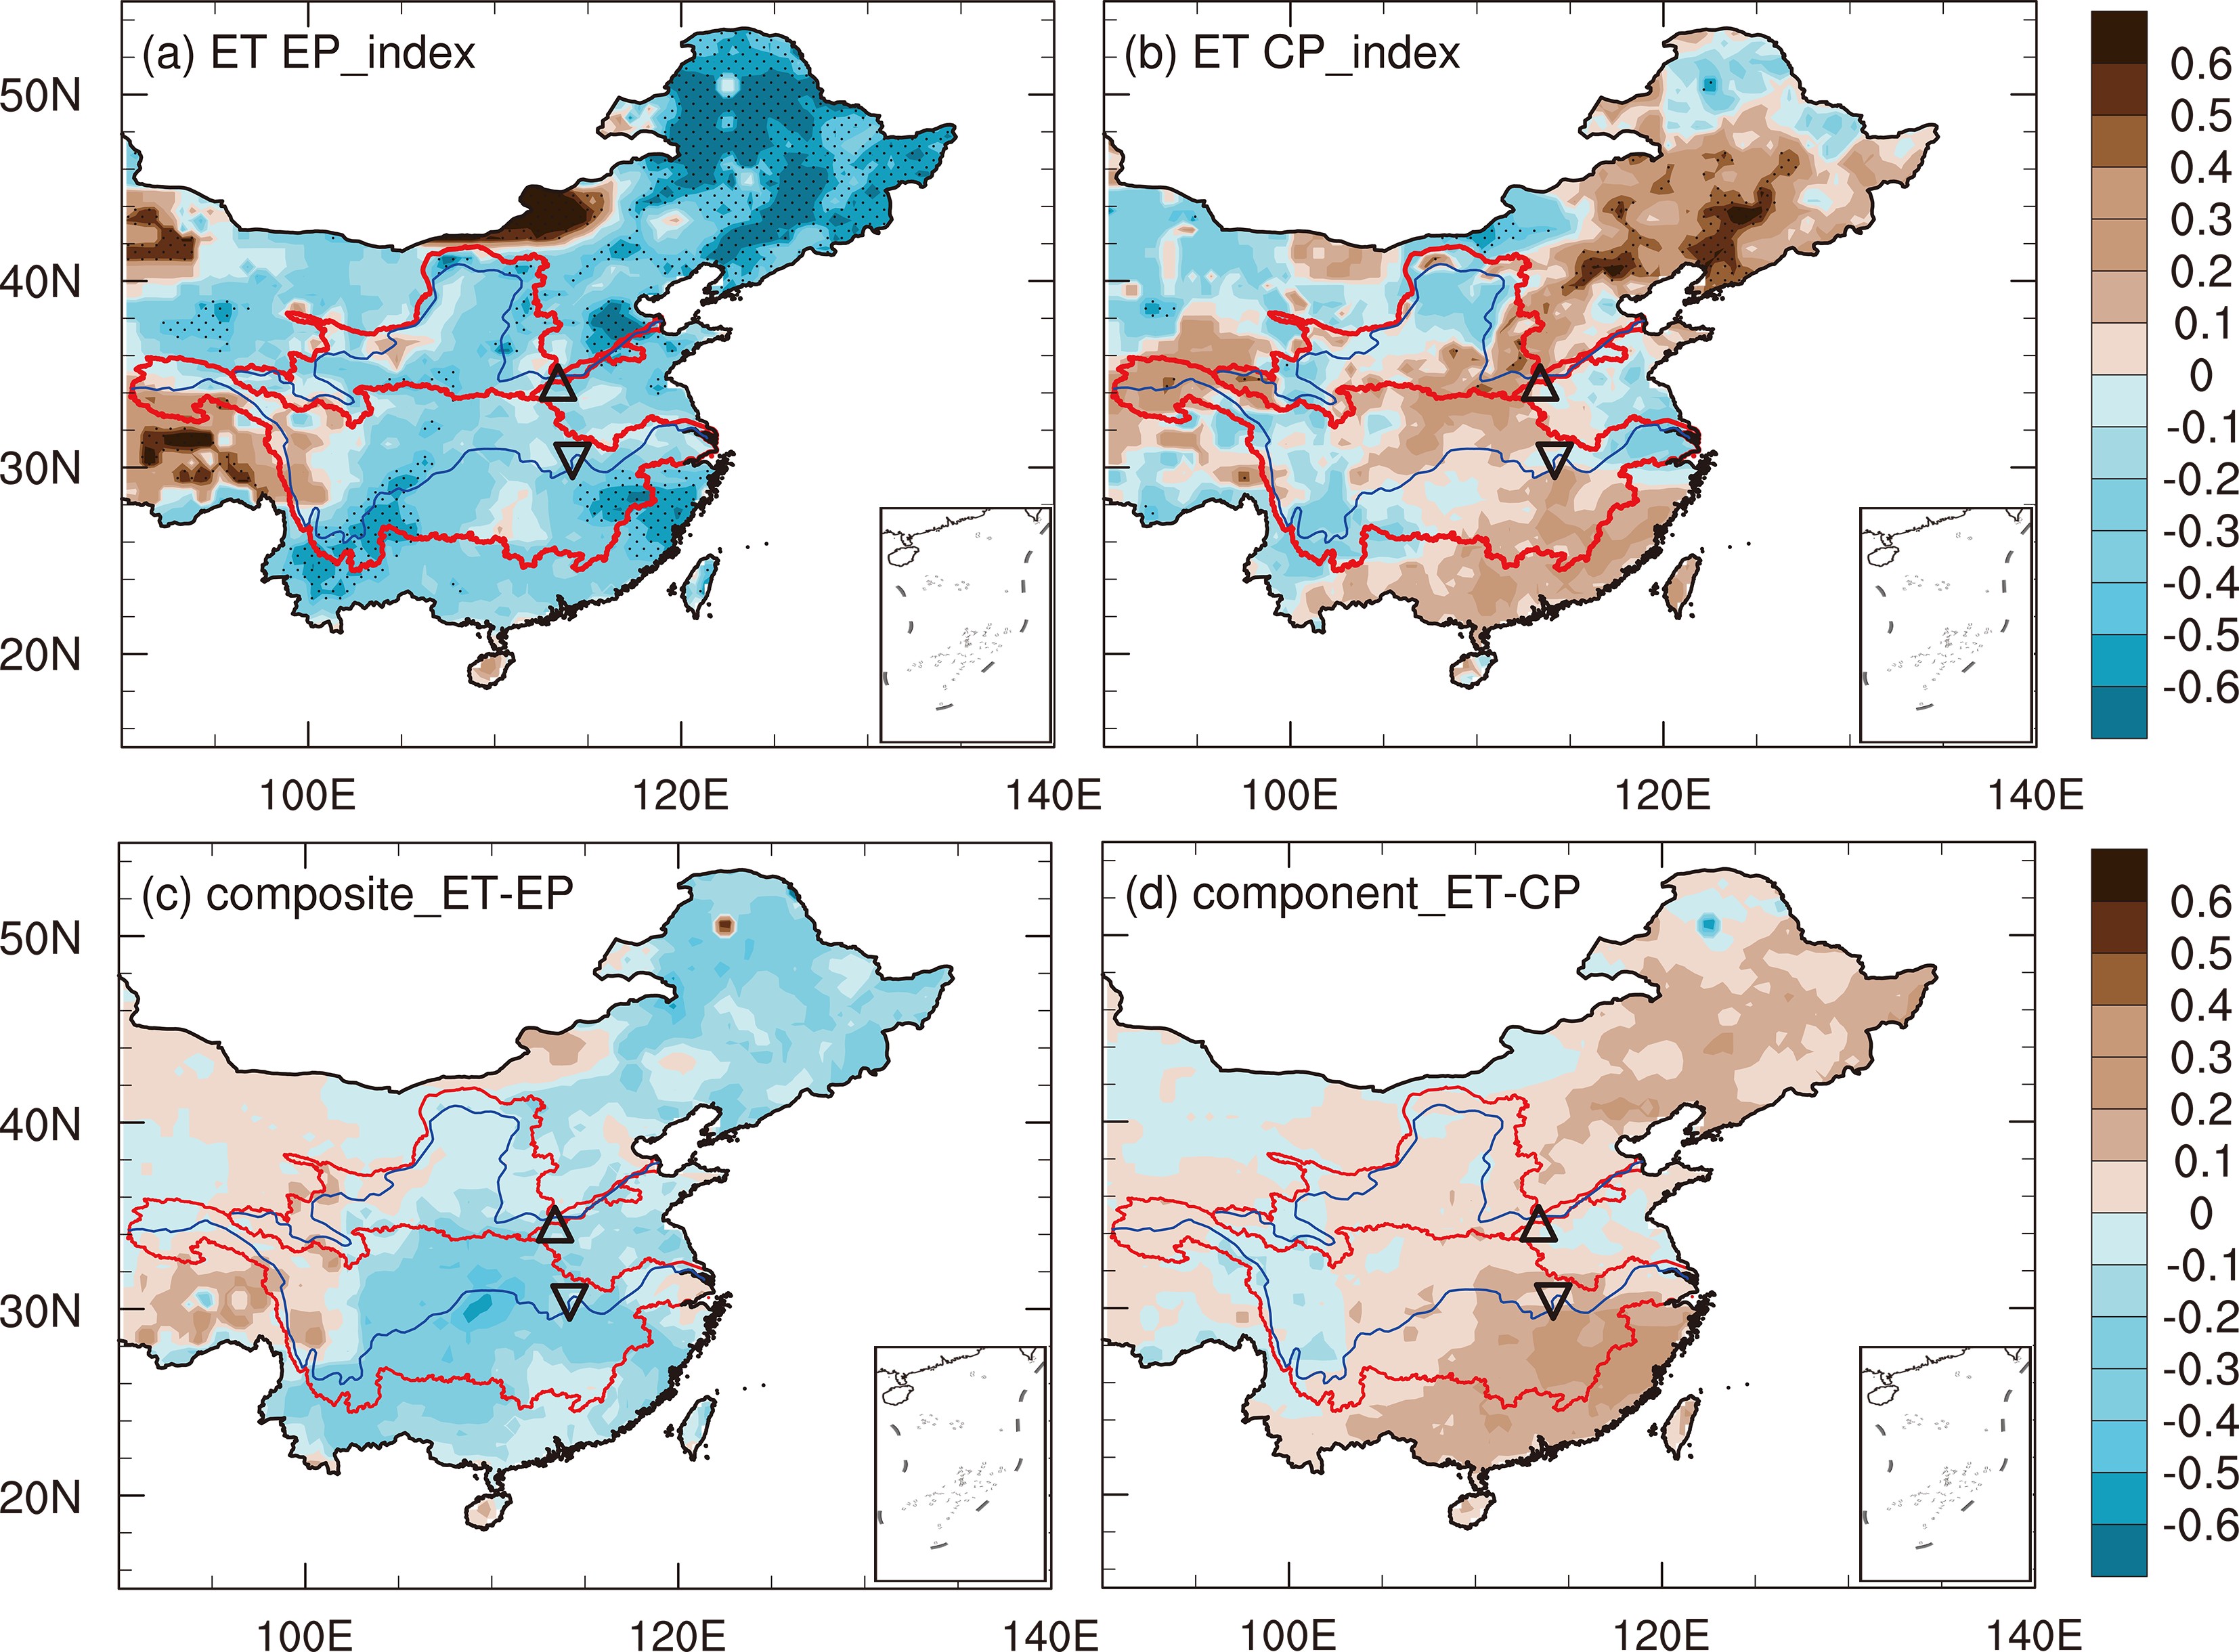 Figure7. As in Fig. 6. but for ET (units: mm d?1).
Moreover, we also analyzed the surface air temperature as compared with the ET (Fig. S2 in ESM). Over the humid regions, ET is more dependent on temperature than precipitation, while over the arid and semiarid regions precipitation and temperature are of equal importance for ET and other soil hydrological variables (Wang and Zeng, 2011). As a typical humid region, the Yangtze River basin usually has enough soil water for evaporation. The ET and temperature exhibit consistent changes and higher temperature would induce more ET. The Yellow River basin belongs to the arid/semiarid region and soil is usually dry and contains less moisture, which limits ET. Rising temperature would increase the atmospheric moisture demand, and then further enhance the process of ET. From our analyses, compared to normal years, the Yellow River basin displays less precipitation, lower temperatures and reduced ET in EP years, while there is less precipitation and higher temperatures and ET in CP years.
The above results indicate that the streamflow in the lower reaches is affected by precipitation, ET and temperature in the entire river basin. Over the Yellow River basin, both precipitation and ET play equal roles in the streamflow, and negative anomalous precipitation, ET and temperature will induce positive streamflow anomalies in EP years. Similar results have been obtained in a previous study (e.g., Liu and Cui, 2011). In CP years, negative streamflow anomalies appear in the lower reaches of the Yellow River basin because of low precipitation and large ET. A positive CP index is accompanied by negative precipitation anomalies and positive ET and temperature anomalies. Over the Yangtze River basin, the streamflow in the lower reaches will increase when a positive EP index occurs with positive precipitation anomalies and negative ET anomalies, due to the river basin having a larger water input and smaller water output. Similarly, the changes of the positive CP index values usually accompany positive precipitation anomalies and negative ET anomalies, leading to positive streamflow anomalies.
2
4.1. Anomalous water vapor transport
Moisture transport is an essential factor for precipitation and subsequently for streamflow. To examine the moisture transport during EP and CP years, we performed a correlation analysis of the vertically integrated water vapor transport flux (WVTF) anomalies from the surface to 300 hPa with the two Ni?o indices (Fig. 8). It is obvious that, in both EP and CP years (Figs. 8a-d), there are two clear moisture transport belts, located north (transport towards the east) and south (transport towards the west) of 20°N, respectively. In the mid-latitudes (50°?60°N), there is a transport belt towards the west. As a result, near 20°N (south of 30°N) is mainly occupied by an anticyclone, and near 40°N (north of 30°N) by a cyclone.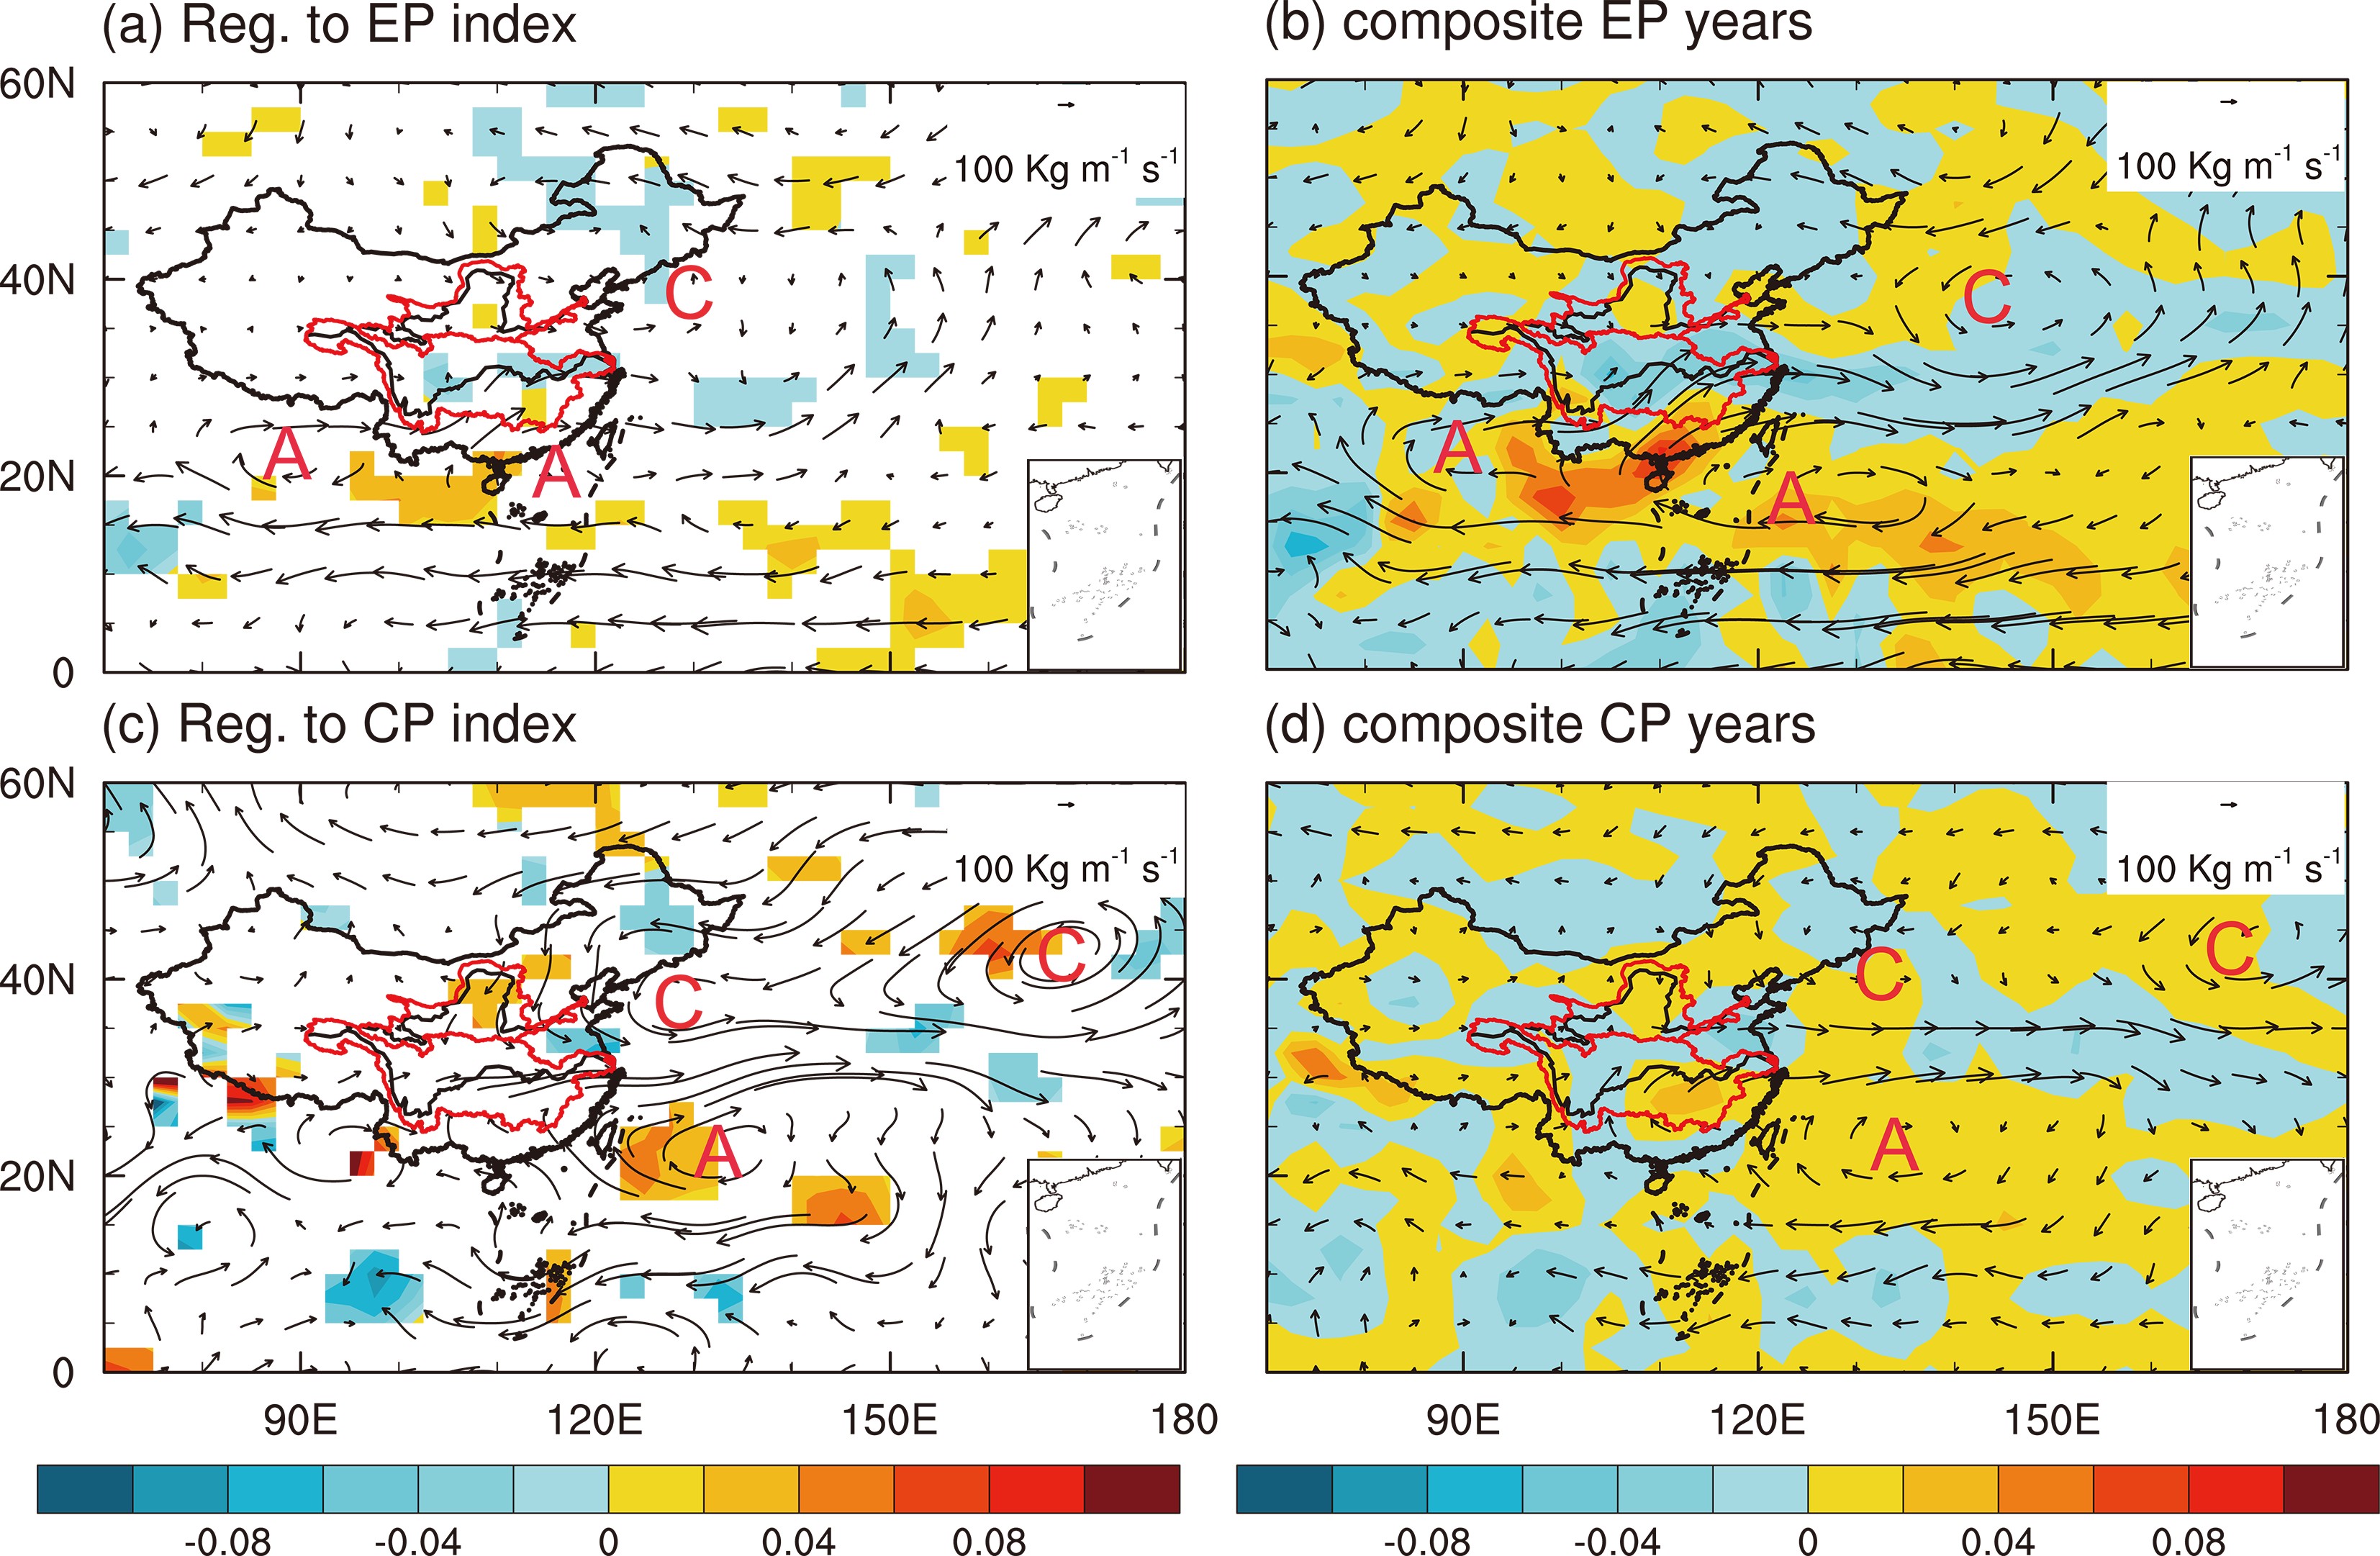 Figure8. Regression of the summer vertically integrated WVTF anomalies (from the surface to 300 hPa) (vector arrows) and the convergence of WVTF (contours) with positive (a) EP and (c) CP index values, and the composite patterns in (b) EP and (d) CP years. Only those results that surpass the 80% confidence level in the regression of convergence are drawn in the maps. The letter “A” represents “anticyclone” and the letter “C” represents “cyclone”. The red curves surrounding regions indicate the ranges of the two river basins.
In EP years, the anticyclone south of 30°N becomes strong and presents two anticyclonic centers (Figs. 8a and b): one over South China, and the other over the northern Bay of Bengal. Meanwhile, north of 30°N, a cyclonic center lies over the Japan Sea. Such a pattern exists clearly in both the composite and regression maps. The anomalous anticyclone is able to bring abundant water vapor through the Indochina Peninsula (bypassing the South China Sea) to southeastern Asia, which will then be transported to the land area of South China. Meanwhile, the anomalous cyclone over the Japan Sea shows a significant WVTF channel from the Northwest Pacific to the Mongolian Plateau, and finally arrives in the Yellow River basin. Moreover, there is significant moisture convergence over the Yangtze River basin, while over the Yellow River basin there is only a small area that shows significant moisture divergence, with other areas characterized by slight moisture convergence. Therefore, such a pattern is favorable for WVTF from the low- to midlatitude sea to the Yangtze River basin, but it is unremarkable for the Yellow River basin. In CP years, the cyclone located north of 30°N becomes robust and shows two cyclonic centers, over the west of the Japan Sea and east of the Kamchatka Peninsula, respectively (Figs. 8c and d). Also, the anticyclone appears over the West Philippines. Such a pattern would suppress the water vapor transport from low latitudes to the land area of East China. The moisture divergence is apparent over the Yellow River basin and southeast coastal area. Figure 8 also shows that there is good consistency with the distribution of both precipitation and the convergence/divergence of water vapor in the two types of El Ni?o years. For instance, in EP years, the precipitation displays a positive anomaly over the Yangtze River basin and North China, where the water vapor significantly converges (Figs. 8a and b). In CP years, the area with profound increasing precipitation is mainly located over the Huaihe River basin, where water vapor is significantly converging (Figs. 8c and d). It is worth noting that, over the Yellow River basin, there is a distinct WVTF from the Mongolian Plateau and strong water vapor divergence. The above patterns reduce the precipitation over the Yellow River basin in CP years. Similarly, over South China, the water vapor anomaly shows as significantly positive and the precipitation anomaly is negative, in accordance with the obvious water vapor divergence. Furthermore, we analyzed the characteristics of vertical and horizontal motions of the atmosphere, to investigate the possible reasons of such a phenomenon.
2
4.2. Anomalous atmospheric circulation changes
The spatial distributions of the regressed and composite GPH and omega anomalies are plotted for both EP and CP El Ni?o years in Fig. 9. The same patterns as those in Fig. 8 are also apparent in the GPH anomaly fields. These GPH patterns present as an anomalous high-pressure center around 20°N and an anomalous low-pressure center around 40°?50°N. The anomalous low-pressure center corresponds with ascending motion and the anomalous high-pressure center indicates sinking motion. Moreover, in the mid-latitudes the anomalous westerlies are also closely associated with ascending motion. Specifically, in EP years, the anomalous westerlies are located east of 90°E, where the Yangtze and Yellow River basins are (Figs. 9a and b); whereas, in CP years, the westerlies shift east and become narrow and weakened, resulting in the convective activity only being evident over the Huaihe River basin (Figs. 9c and d). Moreover, in the low latitudes in EP years (Figs. 9a and b), South China is dominated by sinking motion, and a high-pressure center is apparent from the anomalous GPH map, which is closely associated with the western Pacific subtropical high (WPSH). The composite WPSH (Fig. S3 in ESM) shifts westward to 115°E in EP years, as compared with CP years (130°E) and normal years (135°E). It prevails over the South China Sea and part of South China, where descending motion is dominant, and southwesterly flow prevails in the north of the WPSH. Such characteristics are consistent with the precipitation changes in South China and the water vapor transport path and its divergence process. Therefore, the changes in local precipitation are affected by both water vapor and the vertical movement.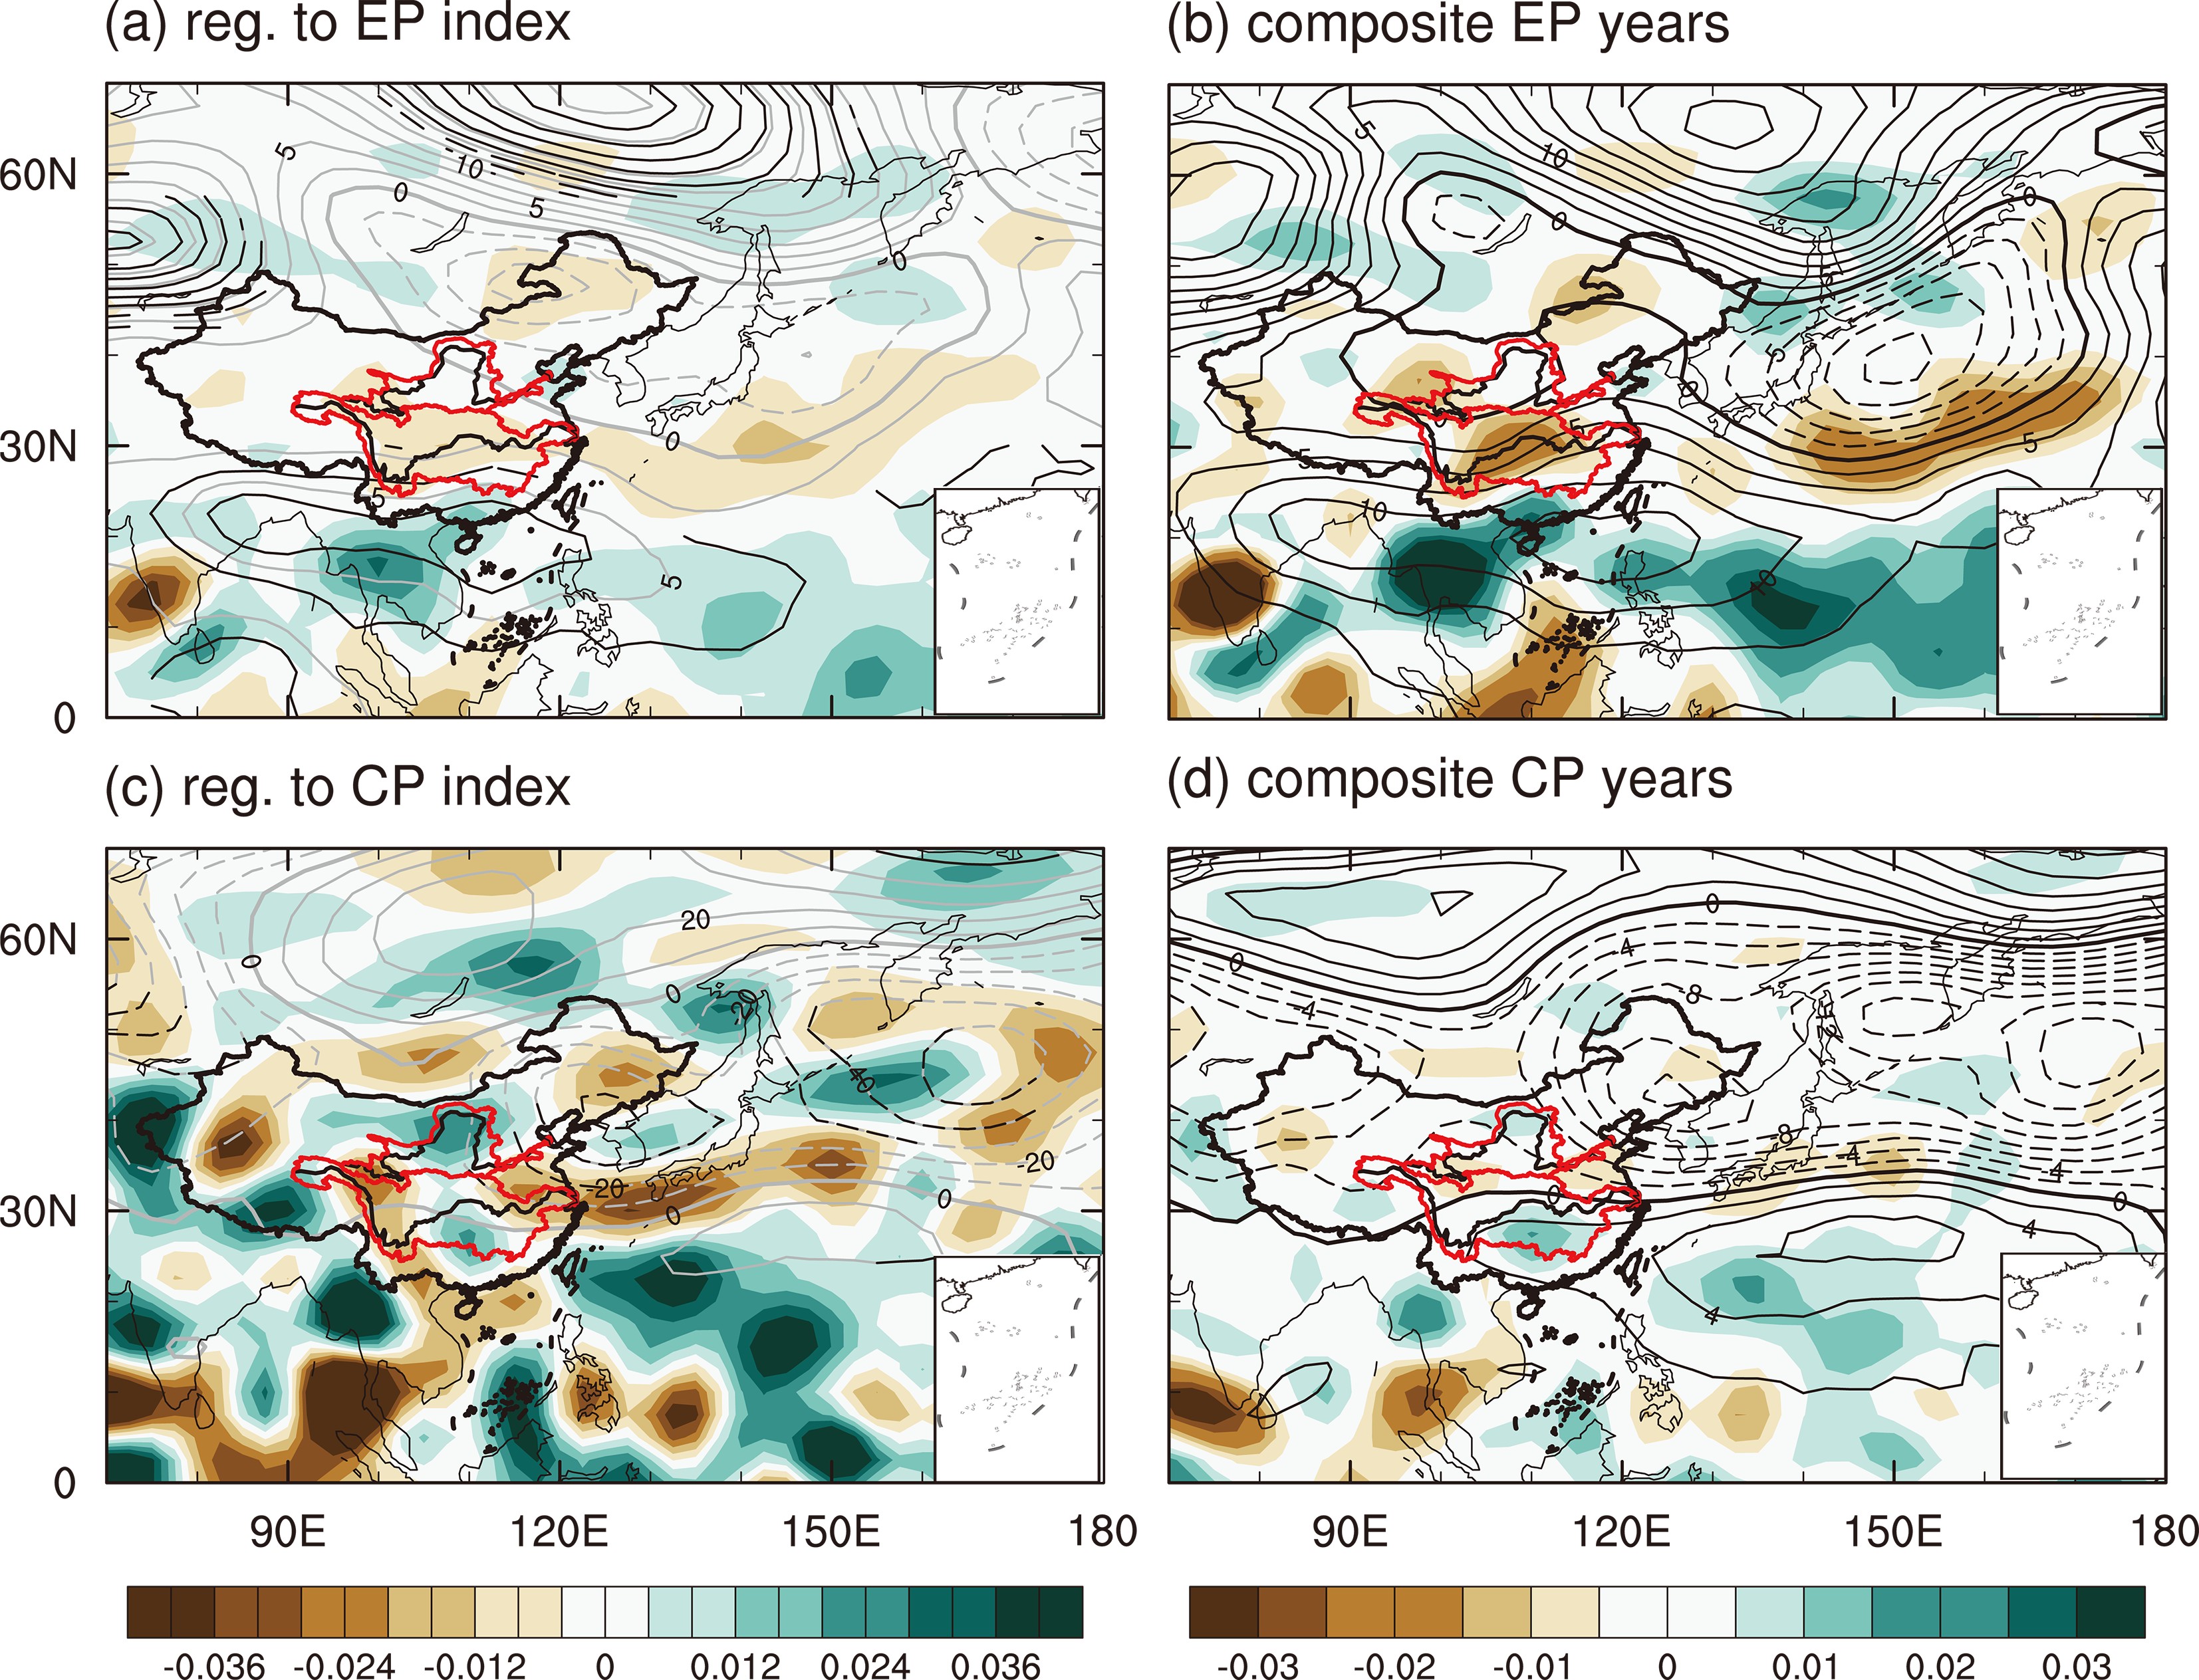 Figure9. Similar to Fig. 8. but for the GPH (contours; units: gpm) and omega (shading; units: m s?1) 500-hPa anomalies. Dashed lines represent negative values, solid lines represent positive values. In regression maps [(a) and (c)], only regions passing the 90% confidence level are plotted (shading) and overlaid by black lines (contour).
Combined analyses of the distributions of ET, temperature and vertical movement illustrate that they have a good and consistent relationship over land. In general, the area with rising motion corresponds to the strong convective zone, which is a favorable condition for the generation of clouds. Clouds can prevent radiation reaching the Earth’s surface, subsequently reducing the surface radiation heating. Thus, there is always negative anomalous ET and temperature where rising motion dominates; whereas, areas of sinking motion correspond to clear-sky and cloudless weather, with more solar radiation reaching the surface and the induction of positive anomalous ET and temperature. Figure 10 displays the average meridional (100°?115°E) latitude?pressure/height distribution of the rising/sinking motion over the two river basins. The area between 25°N and 35°N approximately corresponds to the location of the Yangtze River basin, and the area between 35°N and 45°N is roughly the Yellow River basin. Apparently, in EP years, the Yangtze River basin is dominated by deep rising motion, while the Yellow River basin is dominated by shallow rising motion under 500 hPa and sinking motion above 500 hPa. Accordingly, the anomalous ET and temperature over both the Yangtze and Yellow river basins are obviously negative. In CP years, the deep sinking center is over the Yellow River basin, and a shallow rising center occurs over the Yangtze River basin, corresponding to the positive ET and temperature anomalies over the Yellow River basin but slightly negative ET and temperature anomalies over the Yangtze River basin.
 Figure10. Vertical?horizontal cross-section regression patterns averaged along 100°?115°E for summer vertical wind anomalies with (a) EP and (c) CP index values, and the composite patterns of vertical wind averaged along 100°?115°E in (b) EP and (d) CP years. Only regions passing the 90% confidence level are plotted.
Therefore, we find that EP and CP El Ni?o influence the lower reaches of both river basins’ streamflow through influencing the summer climate (e.g., precipitation, ET and temperature). Both the moisture conditions and the dynamic conditions are vitally important to the above relationships.
The summer streamflow in the Yellow and Yangtze river basins shows different characteristics in the two types of El Ni?o years. Generally, the linkage of EP El Ni?o events is more evident than that of CP El Ni?o; streamflow shows a positive anomaly during EP years, but changes diversely in CP years across different river basins. For example, the streamflow anomaly appears as dramatically negative over the Yellow River basin, whereas it is slightly positive over the Yangtze River basin, in CP years. Analyses of precipitation and ET show different weights of the effects on the streamflow over the two river basins. Over the Yellow River basin, the changes in ET are more important than precipitation, while over the Yangtze river basin the change in precipitation is the main reason for streamflow changes.
The large-scale anomalous atmospheric circulation shows obviously different characteristics in EP and CP El Ni?o years. Overall, the anomalous atmospheric circulation shows a significant cyclone north of 30°N and an anticyclone south of 30°N. Such a spatial distribution may affect the water vapor transport path and modify the distribution of sinking/ascending motion, as well as the dynamic conditions of precipitation. In EP years, the anticyclone reinforces and emerges as two anticyclonic centers: one over South China, and the other over the northern Bay of Bengal. Meanwhile, the cyclone north of 30°N lies over the Japan Sea. Such a pattern is in accordance with a special atmospheric circulation in which the water vapor transported to the Yangtze River basin is enhanced, but does not arrive at the Yellow River basin. Meanwhile, the WPSH extends to 110°E and occupies South China, leading to negative precipitation anomalies but positive ET and temperature anomalies. The westerlies at 500 hPa shift southward and the distribution of vertical movement shows ascent over the Yangtze and Yellow river basins, which is favorable for convective movement, inducing the decreasing ET and temperature. However, in CP years, the cyclone becomes robust and shows two cyclonic centers over the western Japan Sea and east of the Kamchatka Peninsula, respectively. Accordingly, the atmospheric circulation shows less water vapor entering East China, and westerlies become narrow and weakened. At the same time, the vertical movement is one of sinking motion over two river basins, especially the Yangtze River basin. The above situation will cause a decrease in precipitation but an increase in ET and temperature. Such a phenomenon is more pronounced over the Yellow River basin, which will then induce the streamflow to diminish obviously.
In this paper, we present detailed analyses of the relationship between summer streamflow and two types of El Ni?o over the Yellow and Yangtze River basins. However, it should be pointed out that, due to the limitation of the streamflow data length, during the study period of 1980?2008, EP El Ni?o occurred only three times and CP El Ni?o only five. One might therefore be concerned that the results could be biased in terms of distinguishing the impacts from the background climatology. To make the results more robust, when we performed the correlation/regression analyses, we selected years with positive EP or CP indices, and the composite analyses were from the pre-selected cases based on the thresholds described in section 2. Therefore, we are confident that our results are sufficiently convincing. Wu et al. (2016) mentioned that hydrometeorological hazards (especially flooding) will always be a concern because of the huge economic losses and damage to property that they cause. Therefore, it is crucial to enhance our ability to predict such hazards. With this in mind, the results presented here might help us to better understand the influence of different types of El Ni?o events on land surface hydrological processes, and subsequently lead to advancements in the potential to forecast El Ni?o-related hydrometeorological disasters.
Acknowledgements. This work was supported by the Key Project of the Ministry of Science and Technology of China (Grant No. 2016YFA0602401) and the National Natural Science Foundation of China (Grant No. 41875106). The authors would like to acknowledge the Data Center for Resources and Environmental Sciences, Chinese Academy of Sciences, for providing the China River Valley datasets, which are available for free at their website (http://www.resdc.cn). Other datasets used in this study have been acknowledged in the paper.
Electronic supplementary material: Supplementary material is available in the online version of this article at
