HTML
--> --> -->Huang (1986) found that a subtropical jet would “jump” northward twice each year, with the first jump of about 7° latitude during March?April and the second one of about 4° during July?August. Accompanying this phenomenon, the ridge of the western North Pacific subtropical high (WNPSH) moves northward by about 7° latitude during spring and 5° during June?July. The pre-summer rainfall period coincides with the first simultaneous northward movements of the subtropical jet and WNPSH. This period is dominated by southwesterly winds, which can transport ample warm and moist air of tropical origin for the generation of rainfall over South China.
Previous studies have indicated that warm-season rainfall over South China exhibits substantial intraseasonal variability, with low-frequency modes in both rainfall and atmospheric circulations (Chen and Sui, 2010; Yang et al., 2010, 2014; Gu et al., 2013; Hong and Ren, 2013). A 30?60-day periodic variation appears to occur under the influences of the Madden?Julian Oscillation (Lin et al., 2008; Zhang et al., 2009) and Mascarene and Australian highs (Zhang et al., 2011), while a 10?20-day periodic variation can be traced to atmospheric perturbations over middle to higher latitudes and tropical regions (Tong et al., 2007; Cao et al., 2012; Pan et al., 2013; Chen and Jian, 2015). Cao et al. (2012) attributed the low-frequency rainfall over South China to the juxtaposition of a lower-level west-to-northwestward propagating low-frequency anticyclone near 150°E (with an accompanying cyclone over the SCS) with the westward extension of the WNPSH. Pan et al. (2013) emphasized the roles of a lower-tropospheric anomalous anticyclone encircling the Tibetan Plateau interacting with a southeastward-propagating wave train in the middle to upper troposphere.
Recently, some studies have begun to note the importance of 3?8-day synoptic disturbances in generating heavy rainfall. Liu et al. (2014) claimed that Rossby wave trains at higher latitudes, cyclonic and anticyclonic anomalies downstream of the Tibetan Plateau, and the WNPSH, played different roles in producing the summer 2003 heavy rainfall over the Yangtze?Huaihe River Basin (YHRB) during the mei-yu season. Li and Zhou (2015) indicated that the location and strength of the intraseasonal oscillation and the synoptic disturbances play a decisive role in controlling the severity and duration of the heavy precipitation events over South China during summer, in which wind variations contribute more than humidity variations to changes in moisture divergence. However, few studies have focused on the relationship between pre-summer rainfall and synoptic distances until a very recent study by Huang et al. (2018), who found a dominant frequency mode at the synoptic scale (i.e., 3?8 days) with well-defined positive rainfall anomalies over South China. They traced some disturbances accounting for extreme rainfall events over South China to the development of cyclonic anomalies downstream of the Tibetan Plateau. Given the frequent passage of tropical and higher-latitude disturbances at different scales (likely up to monthly) across South China and the upstream influences of high topography and the SCS (Jiang et al., 2017), we may hypothesize their different roles in determining the general generation and persistence of the pre-summer heavy rainfall over South China. Therefore, the major objectives of this study are to (1) investigate what low frequencies of disturbances contribute more significantly to the pre-summer heavy rainfall over South China on the daily mean rainfall basis, and (2) examine where these disturbances originate and what their roles are. The above objectives are achieved by performing a spectral analysis of pre-summer rainfall events occurring during the years of 2008?15, and then exploring the roles of different frequency modes in two representative heavy rainfall episodes over South China.
The next section describes the data and methodology. The spectral characteristics of pre-summer rainfall over South China during 2008?15 are also presented. Section 3 shows the selection of two heavy-rainfall episodes over South China and provides a brief overview of the associated rainfall events. Section 4 analyzes the temporal evolution of mean flow structures and the different roles of synoptic, quasi-weekly and quasi-monthly disturbances in influencing the two heavy rainfall episodes. A summary and concluding remarks are given in the final section.
Large-scale meteorological conditions associated with the pre-summer rainfall events are analyzed using the National Centers for Environmental Prediction Final Global Analysis dataset with 1° × 1° grid resolution at six-hourly intervals. For our study, the daily mean fields are calculated by averaging the original six-hourly data. Besides, the daily mean interpolated outgoing longwave radiation (OLR) data from NOAA are used to represent large-scale tropical convective activity, with a horizontal resolution of 2.5° latitude ×2.5° longitude.
To identify the prominent temporal characteristics of rainfall events over South China, a spectral analysis of the above-mentioned daily averaged data is performed with the fast Fourier Transform, following Liu et al. (2014). A temporal mean is first removed, and then a smoothing with a 10% tapered window is applied to the perturbation time series. The statistical significance of power spectra is tested, based on the power spectrum of the red noise according to Gilman et al. (1963). In addition, a bandpass filter (Duchon, 1979) is used to extract the periodical disturbances from the raw daily rainfall and circulation field, so as to better identify the temporal evolution of their structures corresponding to the generation of heavy rainfall over South China.
The pre-summer rainfall season over South China is one of the most prominent rainfall periods in China. The spatial distribution of the daily mean rainfall during April to June of 2008 to 2015 is given in Fig. 1, showing three local maxima: one in North Guangxi, and the other two in the north-central region and southeastern coastal region of Guangdong Province, respectively. Given the dominant rainfall amounts associated with the latter two local maxima, we select the region (21°?25°N, 112°?117°E) shown by a dashed box in Fig. 1 as the target area, which includes most of Guangdong Province and its coastal waters. Then, the power spectra of the area-averaged daily mean rainfall during the pre-summer rainy season (i.e., from 1 April to 30 June) for the years 2008?15 are calculated and Markov’s red-noise spectrum and 95% upper confidence bound are applied, respectively (Fig. 2), in order to understand the frequency characteristics of rainfall over the target region. In Cao et al. (2013), Wang et al. (2014) and Wei et al. (2017), they all take the red-noise spectrum as the confidence limit. In addition, the 95% upper confidence bound is another higher confidence limit.
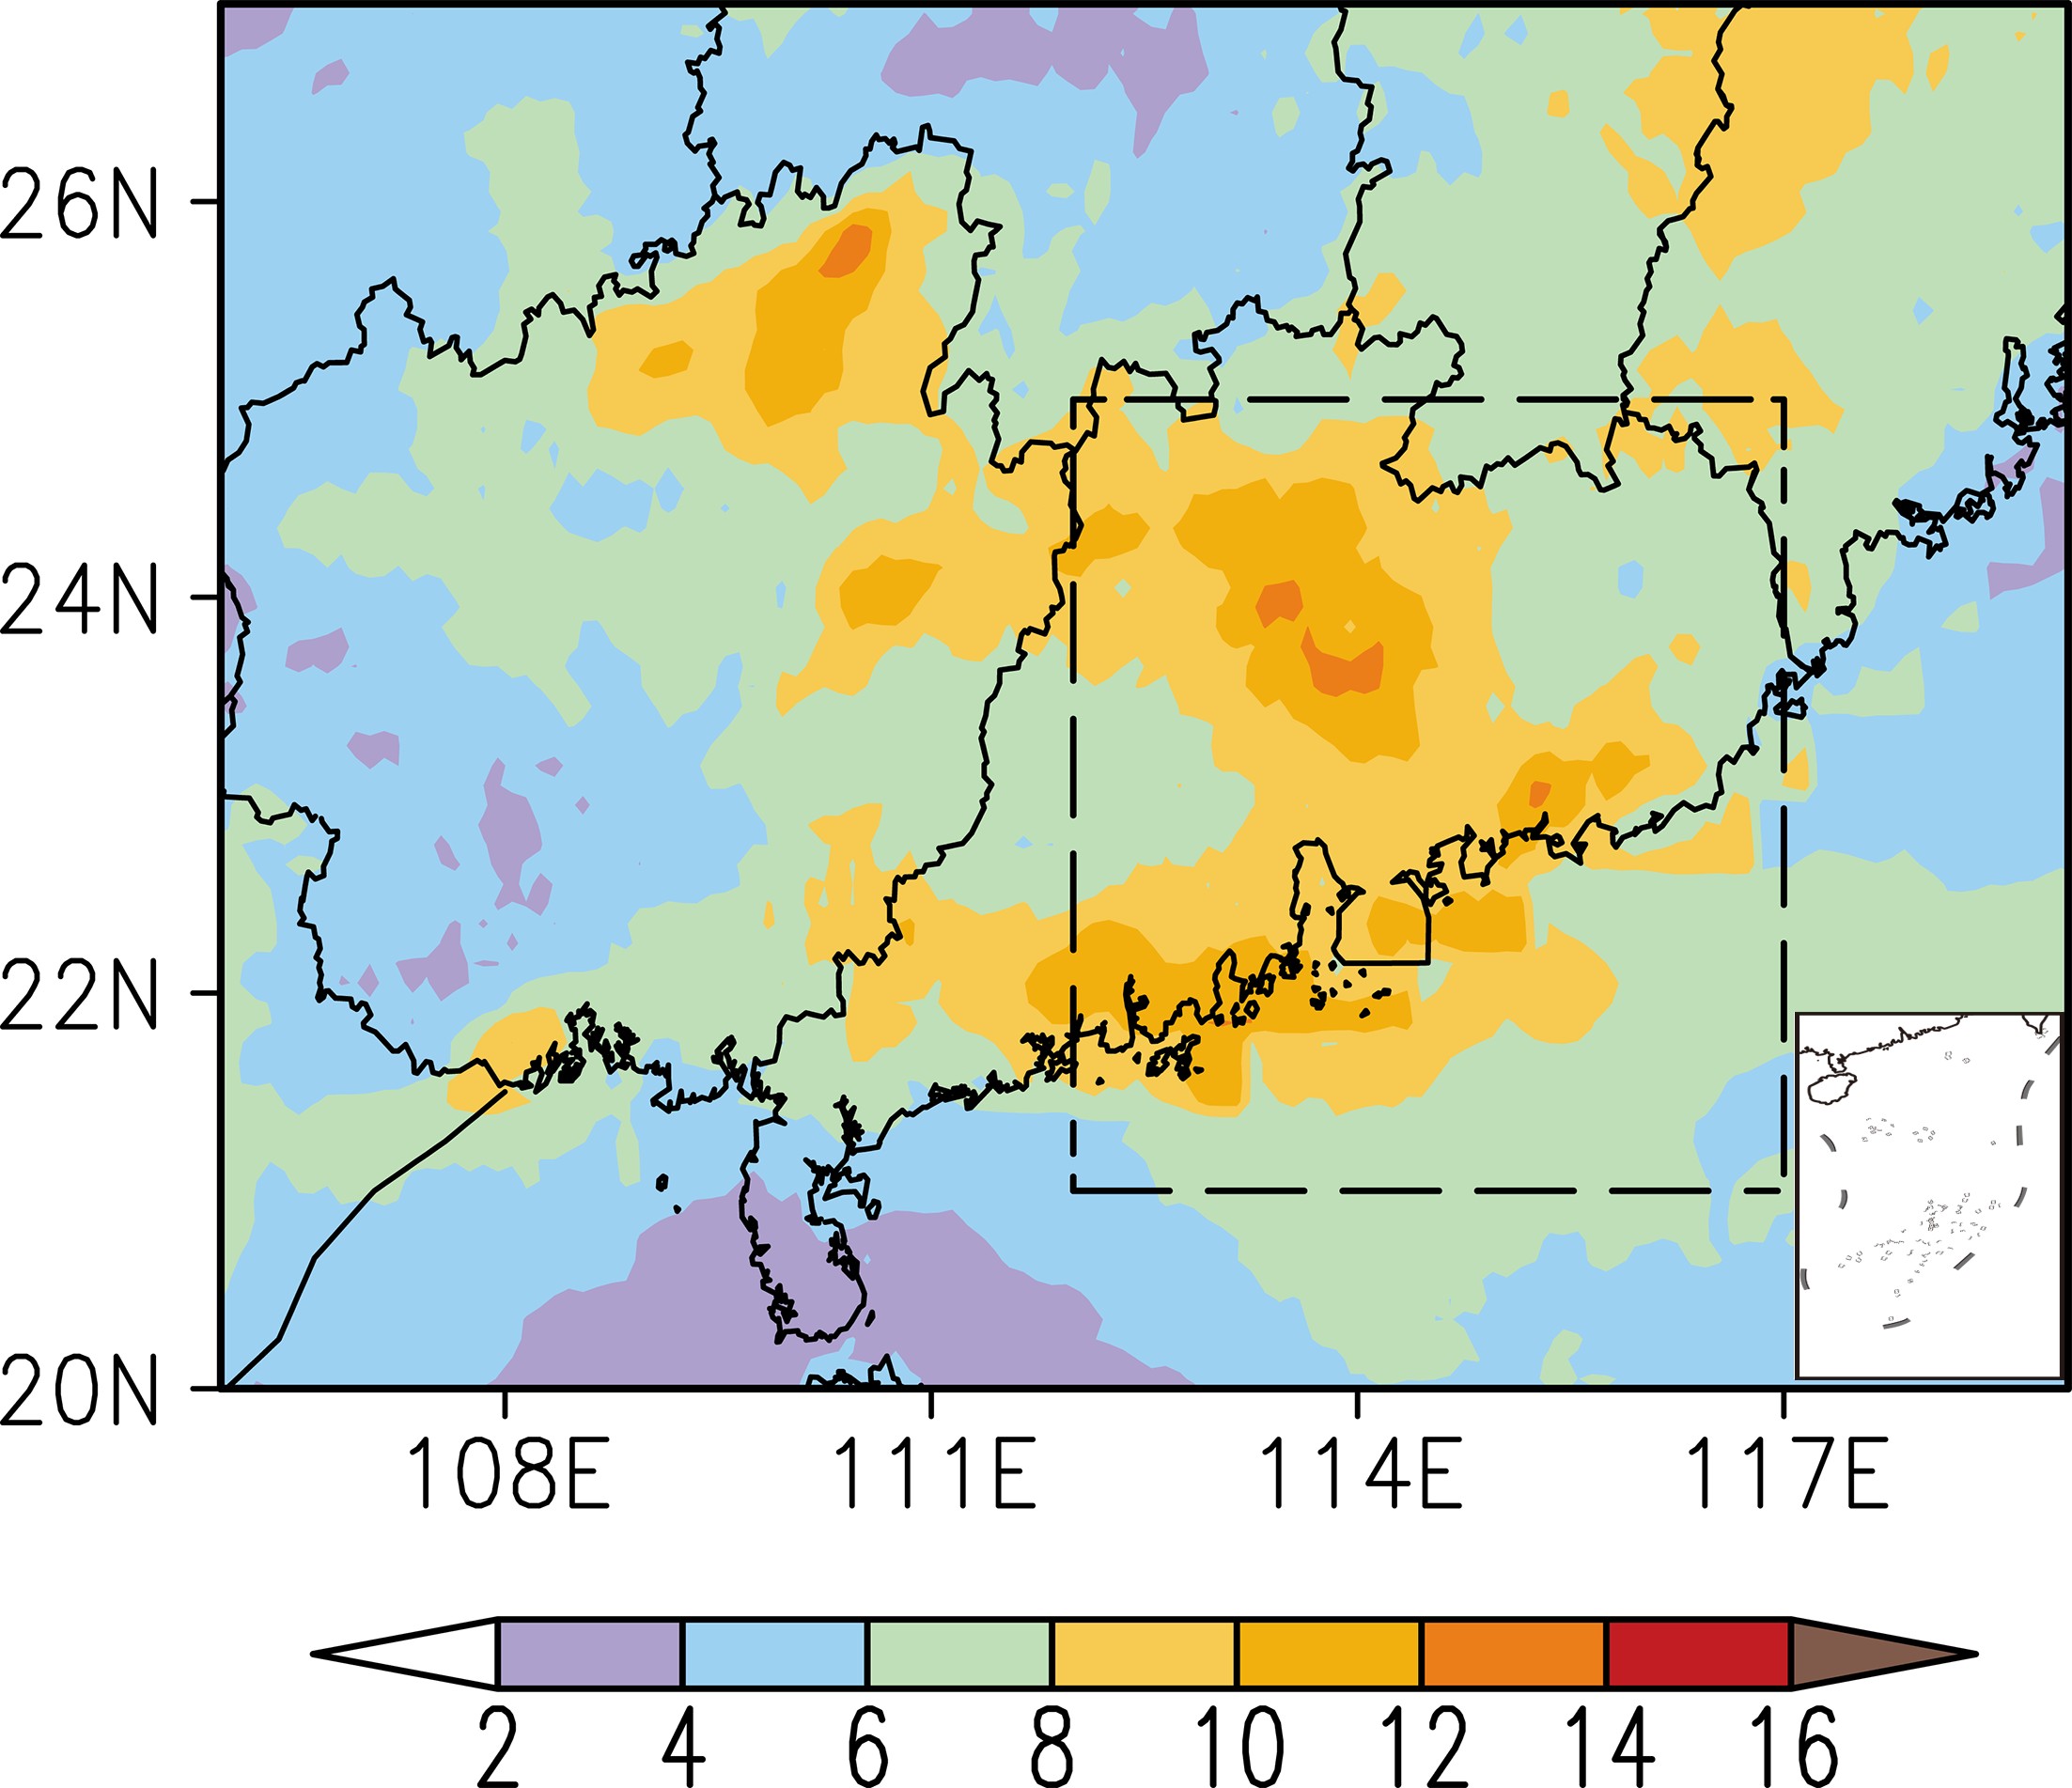 Figure1. Horizontal distribution of the daily mean rainfall (shading; units: mm) during the pre-summer months (April?June) of 2008?15. The dashed box (21°?25°N, 112°?117°E) is used to define the target domain of interest, similarly for the rest of figures.
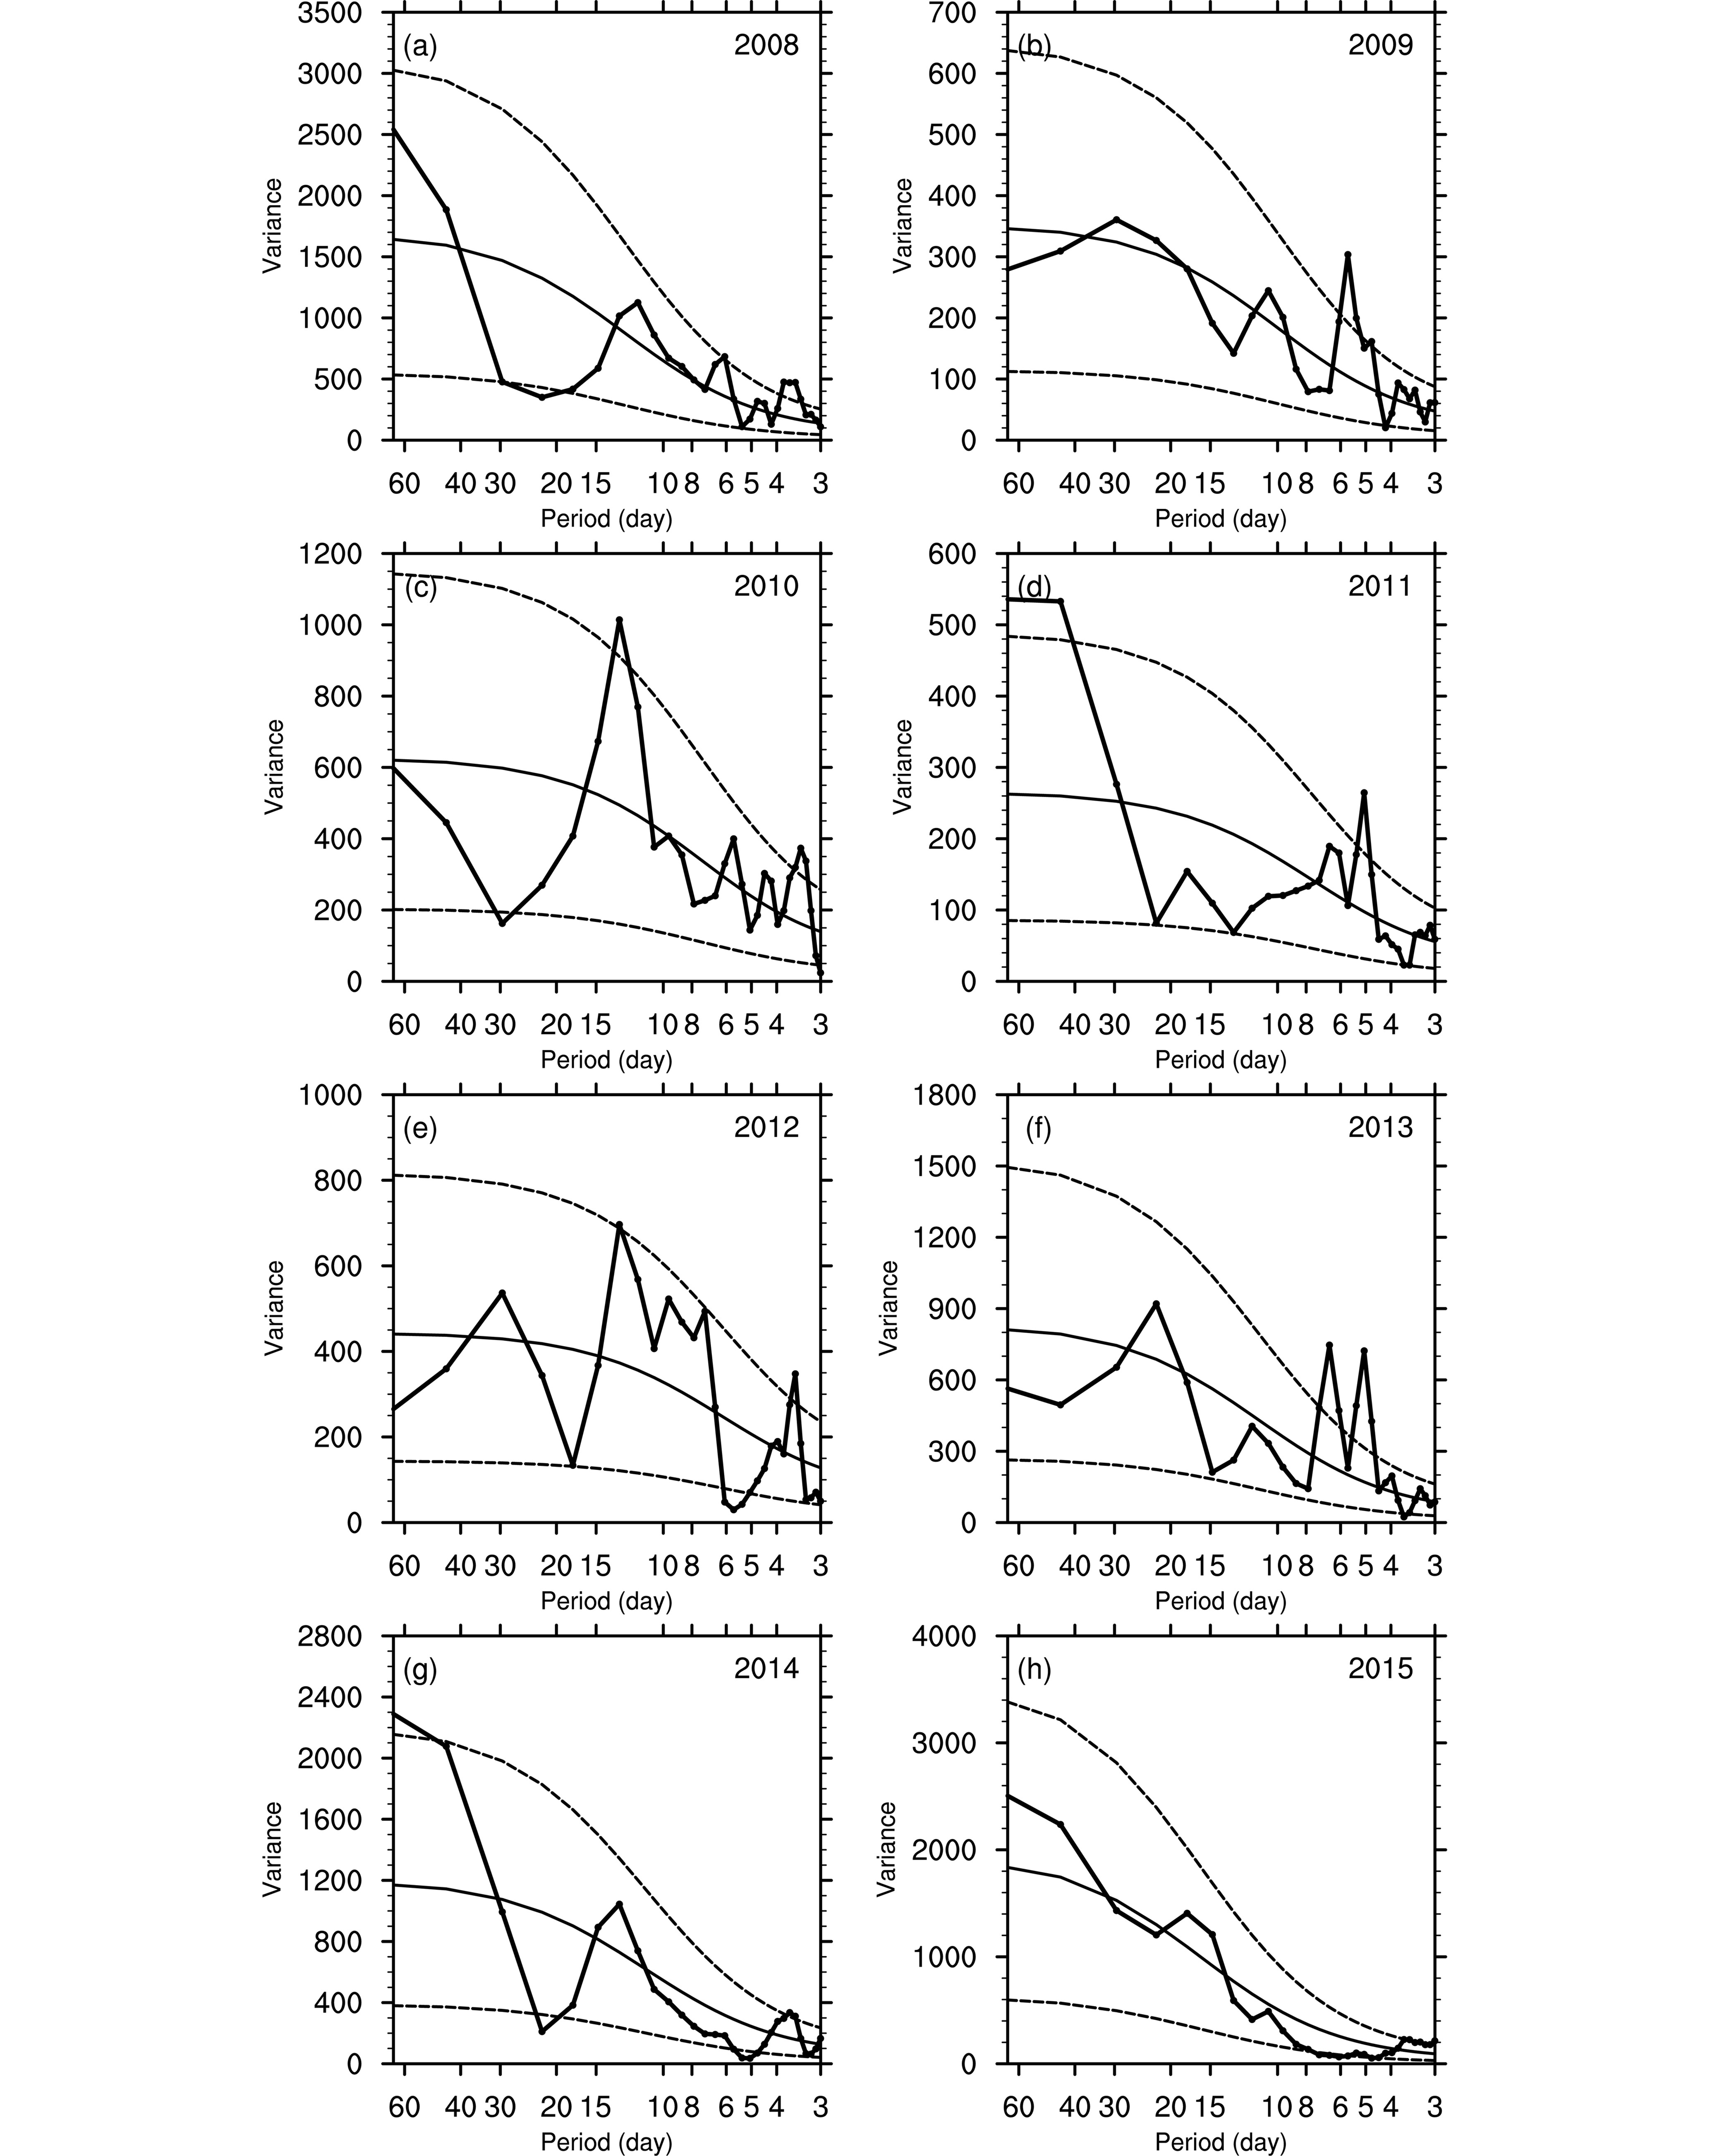 Figure2. Power spectra of the daily mean rainfall over the target domain with the calculated spectrum (solid lines with dots), Markov red-noise spectrum (solid lines), 95% upper and 5% lower (dashed lines) confidence bounds during the months of April?June 2008?15. Note that different scales in ordinates are used for different years. (a) 2008; (b) 2009; (c) 2010; (d) 2011; (e) 2012; (f) 2013; (g) 2014; (h) 2015.
Despite their different magnitudes and frequency characteristics, 3?8 days (i.e., the synoptic scale) appears to be the dominant frequency band, as compared to the 95% upper confidence bound for all the eight pre-summer periods. In addition, 10?20 days (i.e., the quasi-biweekly scale) can be identified as a secondary frequency band, which is also significant against the red-noise background for five pre-summer periods (i.e., 2008, 2010, 2012, 2014, 2015). The above analysis indicates that the synoptic and quasi-biweekly disturbances are the two most dominant modes in these years’ pre-summer rainfall over South China on the daily mean basis. A further examination of Fig. 2 also reveals that the frequency band at 15?40 days (i.e., the quasi-monthly scale) are significant during the pre-summer periods of 2009 and 2013. This scale of disturbance (15?35 days) has been found to be related to Yangtze River rainfall over eastern China during the summer of 1991 by Mao and Wu (2006), and later further explored by Mao et al. (2010), who pointed out that this time scale of summer Yangtze River rainfall arises in response to intraseasonal variations in the WNPSH. We should note that the 10?20-day and 15?40-day modes overlap with each other and thus cannot be examined at the same time. To our knowledge, the impact of quasi-monthly disturbances on heavy rainfall over South China has not been examined in the literature. Thus, in the next two sections, we examine how the three dominant modes contribute to the development of pre-summer rainfall over South China through two representative case studies: one is mainly contributed by synoptic and quasi-biweekly disturbances, and the other is mainly influenced by synoptic and quasi-monthly disturbances.
To intuitively examine the contributions of synoptic, quasi-biweekly and quasi-monthly disturbances to the heavy rainfall events, the area-averaged daily rainfall series against the 3?8-day, 10?20-day or 15?40-day bandpass-filtered rainfall anomalies over the target domain are shown in Figs. 3a and c for the above two rainfall episodes. For the first rainfall episode of interest, the synoptic-scale and quasi-biweekly filtered rainfall variances contribute 35.2% and 15.1% to the total rainfall variance during the period of 6?10 May 2014 (Fig. 3a), respectively. Moreover, one can see prominent synoptic-scale (i.e., 6?10 May) and quasi-biweekly (i.e., 3?15 May) processes involved in this rainfall episode, whose wettest phase matches well with the heaviest rainfall on 8 May (cf. Figs. 3a and e). For the second rainfall episode of interest, the persistent rainfall events occur during 19?23 May 2013, and they are dominated by synoptic-scale disturbances with about 49.3% variance contributions to the total rainfall variance, and quasi-monthly disturbances with 23.2% variance contributions. Prominent synoptic-scale (i.e., 19?23 May) and quasi-monthly (i.e., 11?30 May) processes are involved in this rainfall episode, whose wettest phase matches well with the heaviest rainfall on 21 May 2013 (cf. Figs. 3c and e).
 Figure3. (a) Time series of the area-averaged daily mean rainfall (gray bars; units: mm; left ordinate) and 10?20-day (dashed lines) and 3?8-day (solid lines) bandpass-filtered daily mean rainfall anomalies (units: mm; right ordinate) during the one-month period of 26 April to 25 May 2014. (b) Spatial distribution of the temporally averaged daily rainfall (units: mm) during the period 6?10 May 2014. (c) As in (a) but for 15?40-day (dashed lines) and 3?8-day (solid lines) bandpass-filtered daily mean rainfall anomalies during the period 1?30 May 2013. (d) As in (b) but during the period 19?23 May 2013. (e) Diagram of eight phases during one life cycle of the phase analysis. The phase 3 (7) is crossed by a horizontal line, which represents transition from a dry (wet) state to a wet (dry) state.
Figures 3b and d show the spatial distribution of the temporally averaged daily rainfall peaked on 8 May 2014 and 21 May 2013, respectively. One can see that the 6?10 May 2014 rainfall episode is mainly distributed over the Pearl River Delta of Guangdong Province, whose local maximum daily mean rainfall amount exceeds 70 mm (Fig. 3b). In contrast, the 19?22 May 2013 rainfall episode is linearly distributed along the coastline over Southeast China with another branch extending to the SCS, whose rainfall region with local maximum rainfall amount over 70 mm is comparatively small (Fig. 3d). Thus, the above two rainfall episodes of different geographical and morphological characteristics are selected herein to examine what their dominating circulation anomalies are, and then trace where they originate from.
It is important to realize that the above two rainfall episodes must be produced by different types of mesoscale convective systems (MCSs) associated with different larger-scale circulations (e.g., Miao et al., 2018, Fig. 1). The lower-frequency disturbances under study provide favorable large-scale forcing that influences the general period and distribution of regional persistent heavy rainfall. In fact, many previous studies have indicated that coastal precipitation over South China is closely related to land and sea breezes, low-level jets, coastal orography and slow-propagating weak baroclinic disturbances (Chen et al., 2016, 2017; Du and Rotunno, 2018; Du and Chen, 2019). For example, Chen et al. (2016) illustrated that the nocturnal offshore rainfall over the South China coastal region is induced by a convergence line between the low-level monsoonal wind and the land breezes. Du and Rotunno (2018) pointed out that the two propagation modes (onshore and offshore) of the diurnal rainfall cycle near the coastline are associated with inertia?gravity waves, in terms of speed and phase. It is the background wind that changes the pattern of the inertia?gravity waves and further affects the diurnal propagation. Du and Chen (2019) showed that the initiation of a heavy-rain-producing MCS that occurred over the southern coast of China on 10?11 May 2014 was associated with the convergence between a synoptic-scale low-level jet and a boundary-layer jet. This means that most of the remaining variances in the selected two rainfall episodes may be explained by mesoscale processes that could not be resolved herein and the interactions across different scales.
2
4.1. The heavy rainfall episode that peaked on 8 May 2014
Figure 4 shows the daily mean flows at 850 hPa, and the daily mean geopotential height field and precipitable water during 6?8 May 2014. It is evident that on the heavy rainfall day of 8 May, South China is dominated by warm and moist southwesterly to southerly flows of tropical origin (even from the Indian Ocean) in the lower troposphere (Fig. 4c). The southwesterly flow is associated with the WNPSH, whose axis extends from the central North Pacific to midwest Indian Ocean. This southwesterly flow turns cyclonically in the north of the target domain to a more southerly flow at about 25°N and southeasterly flow at higher latitudes, as an anticyclone (denoted by “A”) moves to the middle-east of China, which strengthens the supply of warm and moist air by southwesterlies to the target domain (cf. Figs. 4b and c). At 500 hPa, South China is located ahead of a weak trough axis with prevailing west-southwesterly winds extending from the southeast of the Tibetan Plateau (Fig. 4f). Clearly, the juxtaposition of midlevel quasi-geostrophic lifting, albeit weak, with the lower-level southwesterly warm and moist air from the SCS and Indian Ocean helps pre-condition a favorable environment for heavy rainfall production. The favorable environment, though relatively weak, appears to account for the generation of a near-zonally oriented rainfall belt, which is consistent with the mean flow at 500 hPa (cf. Figs. 4a, b and 4d, e). The rainfall pattern occurring on 8 May looks more like a warm-sector rainfall episode. In particular, precipitable water in the upstream regions reaches more than 50 mm, implying the presence of considerable water vapor available for the generation of heavy rainfall. Note that although the precipitable water pattern in the vicinity looks similar during the period of May 7?8, the moisture flux, the product of water vapor and horizontal winds, increases with increasing southwesterly flows (Figs. 4a-c), with its peak flux on 8 May. Ultimately, it is the moisture flux convergence that determines the amount of rainfall over the region.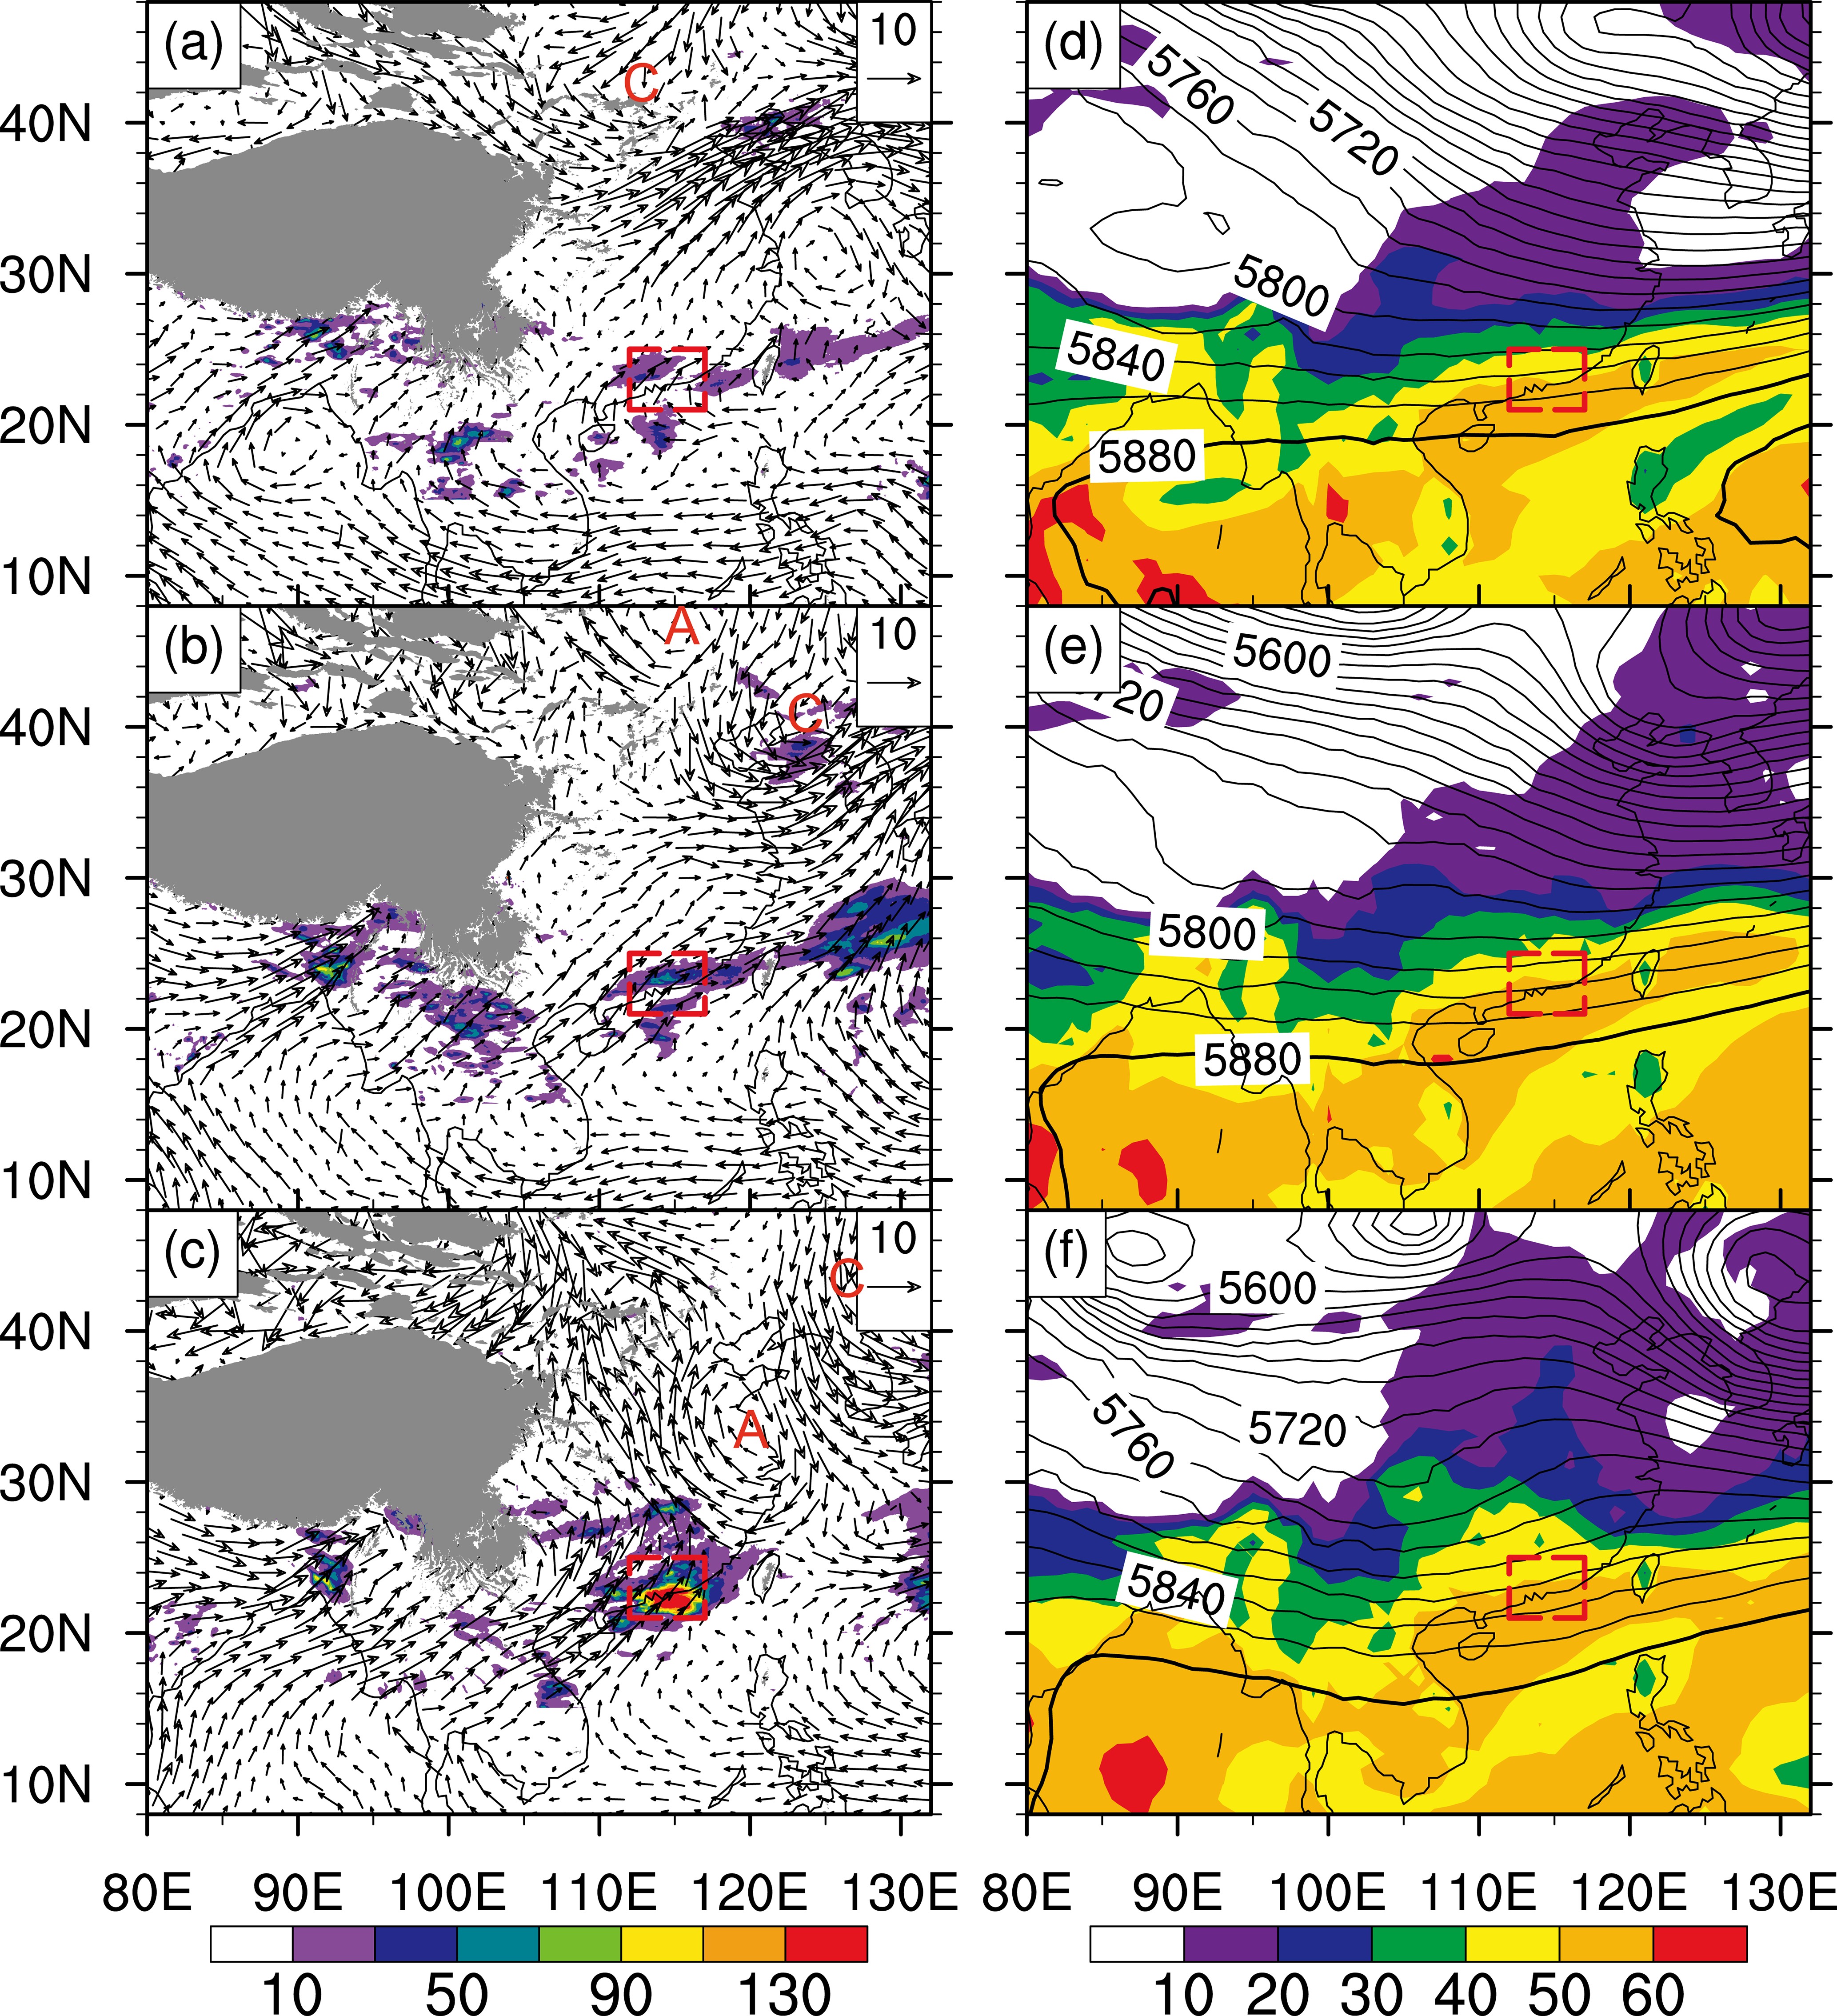 Figure4. Temporal evolution of (a?c) the daily mean 850-hPa wind vectors (units: m s?1), superimposed with daily mean rainfall (shaded; units: mm), and (d?f) the daily mean 500-hPa geopotential height (solid lines; units: gpm) and precipitable water (shaded; units: mm) during the period 6?8 May 2014. The thick solid line refers to the 5880-m geopotential isoline at 500 hPa. The gray shading represents topography greater than 1600 m. (a, d) 6 May; (b, e) 7 May; (c, f) 8 May. The inner box dashed in red denotes the target area, similarly for the rest of figures. The capital letter “A” (“C”) represents anticyclone (cyclone), similarly for the rest of figures.
However, the above favorable mean flow conditions, resulting from the interaction of several atmospheric weather systems, are significantly different when they are traced back two days earlier, i.e., 6 May (Fig. 4a). That is, the anticyclone, which accounts for the cyclonic turning of the southwesterly flow, originates from Mongolia, west of an extratropical cyclone (denoted by “C”) (Fig. 4b). It grows in amplitude as it intrudes southeastward (Figs. 4b and c). Meanwhile, the WNPSH retreats equatorward, as indicated by the 5880-m geopotential isoline at 500 hPa (Figs. 4d-f), but strengthens, as it extends more into the Bay of Bengal—similarly for the strengthened southwesterly flow, as indicated by the horizontal wind vectors. At 500 hPa, South China is governed by westerly flow, with the southeastward intrusion of colder and drier air on the northern side of the Tibetan Plateau on 6 May (Fig. 4d). This southeastward intrusion, as indicated by a dry pocket (shown in blue shades) of precipitable water, helps hydrostatically strengthen the midlevel trough (cf. Figs. 4e and f).
After seeing the evolution of large-scale mean flows in relation to the generation of the heavy rainfall episode that peaked on 8 May 2014, we can now examine what circulation anomalies at the quasi-biweekly and synoptic scales are involved. For this purpose, Figs. 5 and 6 show the filtered quasi-biweekly (10?20-day) and synoptic scale (3?8-day) disturbances, respectively, in different phases at 850 hPa and 200 hPa in association with the filtered rainfall. In the driest phase (i.e., phase 1, or P1) of the quasi-biweekly scale (Fig. 5, left column), South China is dominated by northeasterly anomalies, with an anticyclonic anomaly (A1) on the southeast side of the Tibetan Plateau, and a cyclonic anomaly (C) and an anticyclonic ridge (A2) over the SCS. Although the anticyclonic (A1) and cyclonic (C) anomalies gradually move eastward to eastern-central China and the Bashi Strait, respectively, from P2 to P3, the northeasterly anomaly still dominates South China. Only after the midlatitude anticyclonic anomaly (A1) migrates into the Sea of Japan and the anticyclonic ridge (A2) strengthens into an anticyclonic anomaly in P4 does a large-scale southwesterly anomaly associated with A2 begin to prevail on the southeast side of the Tibetan Plateau. As a result, South China is influenced by the weak northeasterly and weak southwesterly anomalies, which are associated with the above-mentioned anticyclonic anomaly (A1) and summer monsoon, respectively. The anticyclonic anomaly (A2) over the SCS helps strengthen the southwesterly monsoonal flow across South China and generate a confluence zone along the coastline.
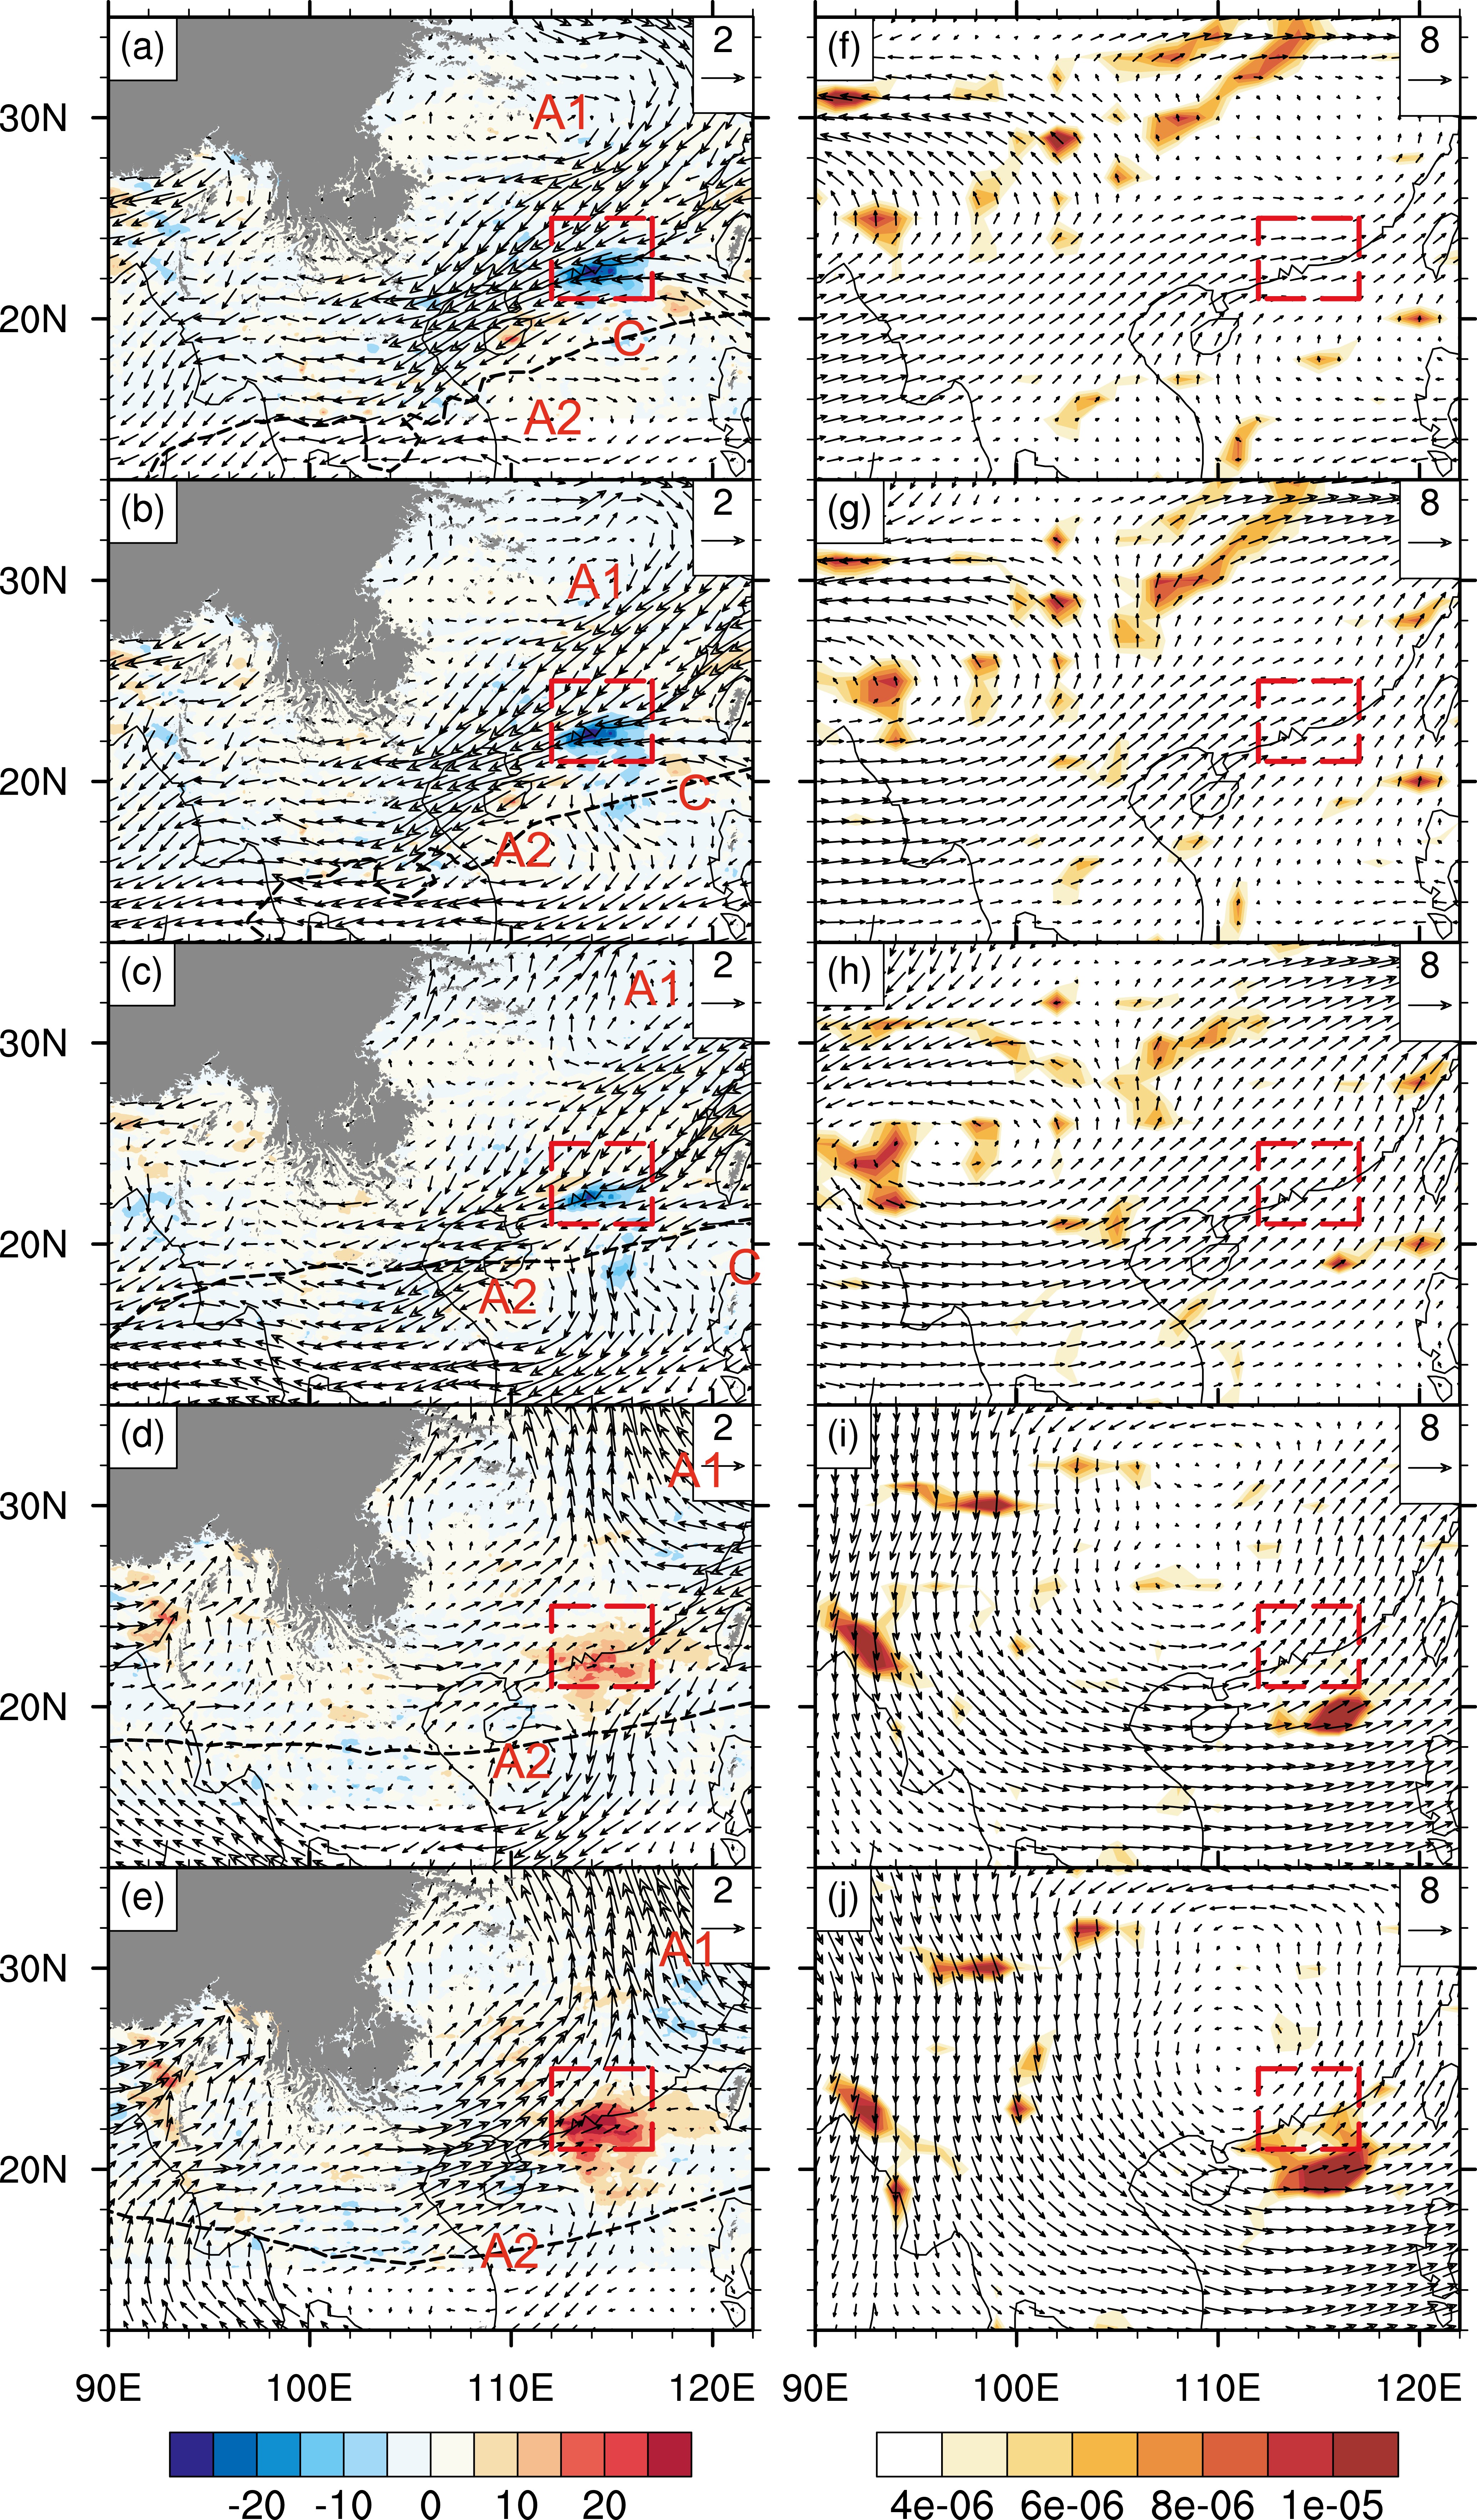 Figure5. (a?e) Phase evolution of the quasi-biweekly bandpass-filtered daily mean 850-hPa wind vector (units: m s?1) superimposed with quasi-biweekly rainfall rate anomalies (shaded; units: mm d?1). Black-dashed lines refer to the 5880-m geopotential isoline at 500 hPa. (f?j) As in (a?e) except for the quasi-biweekly bandpass-filtered daily mean 200-hPa wind vector (units: m s?1) and the corresponding divergence (shaded; units: s?1). (a, f) P1 on 3 May; (b, g) P2 on 4 May; (c, h) P3 on 5 May; (d, i) P4 on 7 May and (e, j) P5 on 8 May 2014. A1, A2 represent anticyclone, C represents cyclone.
 Figure6. (a?c) Phase evolution of the 3?8-day bandpass-filtered (a) daily mean 850-hPa wind vector (units: m s?1) superimposed with 3?8-day bandpass-filtered rainfall rate anomalies (shaded; units: mm d?1). Black-dashed lines refer to the 5880-m geopotential isoline at 500 hPa. (d?f) Temporal evolution of the 3?8-day bandpass-filtered daily mean 200-hPa wind vector (units: m s?1), the total wind speeds (dashed line; units: s?1) and divergence (shaded; units: s?1). (a, d) P1 on 6 May; (b, e) P3 on 7 May; (c, f) P5 on 8 May 2014.
In the wettest phase (i.e., P5), the southwesterly anomaly reaches a larger intensity than before, but gradually weakens from the southwestern to northeastern part in the target domain. Furthermore, this anomalous flow together with the trailing anomalous easterly flow of the anticyclonic anomaly (A1) leads to an intense southeast?northwest-oriented convergence zone where heavy rainfall is distributed on its southern side (see P5 in Fig. 5). It follows that the converging warm and moist air masses at the quasi-biweekly scale contribute positively to the generation of this heavy rainfall episode.
The quasi-biweekly filtered fields in the upper troposphere show the migration of a cyclonic anomaly into the study area from the west during P1?P5 (Fig. 5, right column), which gives rise to the presence of south-to-southwesterly anomalies over South China. In P4, a pronounced divergence region is observed between Hainan and Taiwan, and in P5 it expands toward the southern coastal region, where diffluent horizontal wind vectors are evident. This upper-level diffluence is closely collocated with the lower-tropospheric convergence area. Thus, such a tropospheric juxtaposition tends to generate a favorable upward motion for the generation of the present heavy rainfall episode.
On the synoptic time scale, the lower troposphere from P1 to P3 exhibits a southeastward propagating anticyclonic anomaly (i.e., A), which originates from the lee side of the Yungui Plateau at P1 and dominates South China with two centers in P3 (Fig. 6, left column). This scenario is different from that of a pre-summer heavy rainfall mode found by Huang et al. (2018). In P5, however, this anticyclonic anomaly moves southeastward into the SCS. This displacement allows a cyclonical turning of northeasterly anomalous flows (with likely cold air), associated with a higher-latitude anticyclonic anomaly, over the target domain, thereby assisting in lifting the southwesterly warm and moist air for the generation of the heavy rainfall episode that peaked on 8 May 2014.
The upper troposphere at the synoptic time scale shows the southeastward propagation of a cyclonic anomaly, which is similar to but much better organized than that at the quasi-biweekly scale, with the presence of an upper-level jet stream around 35°N. South China is located over the southern entrance region of the jet stream, where favorable divergence can be seen as expected (Uccellini and Johnson, 1979). In P5, the cyclonic anomaly moves close to the heavy rainfall region, where significant diffluence is present, like that on the quasi-biweekly time scale (cf. Figs. 6 and 5).
To further see the contribution of quasi-biweekly and synoptic disturbances to the heavy rainfall production, the latitude?height cross sections of divergence along 115°E in P5 for the two different scales of disturbances are given in Fig. 7. One can see evident convergence in the 850?400-hPa layer with two convergence centers in the vertical direction, and divergence aloft, implying the presence of favorable deep local upward motion for the rainfall generation. This should also be expected from Figs. 5 and 6, showing isentropic lifting as a warm and moist air parcel moves northward in the southwesterly flow (Raymond and Jiang, 1990; Zhang and Zhang, 2012). In general, the amplitudes of convergence and divergence of the 3?8-day filtered disturbances are twice more than those of the 10?20-day filtered disturbances. This suggests the more important dynamical forcing of the synoptic scale disturbances than the quasi-biweekly ones in influencing the persistent heavy rainfall event.
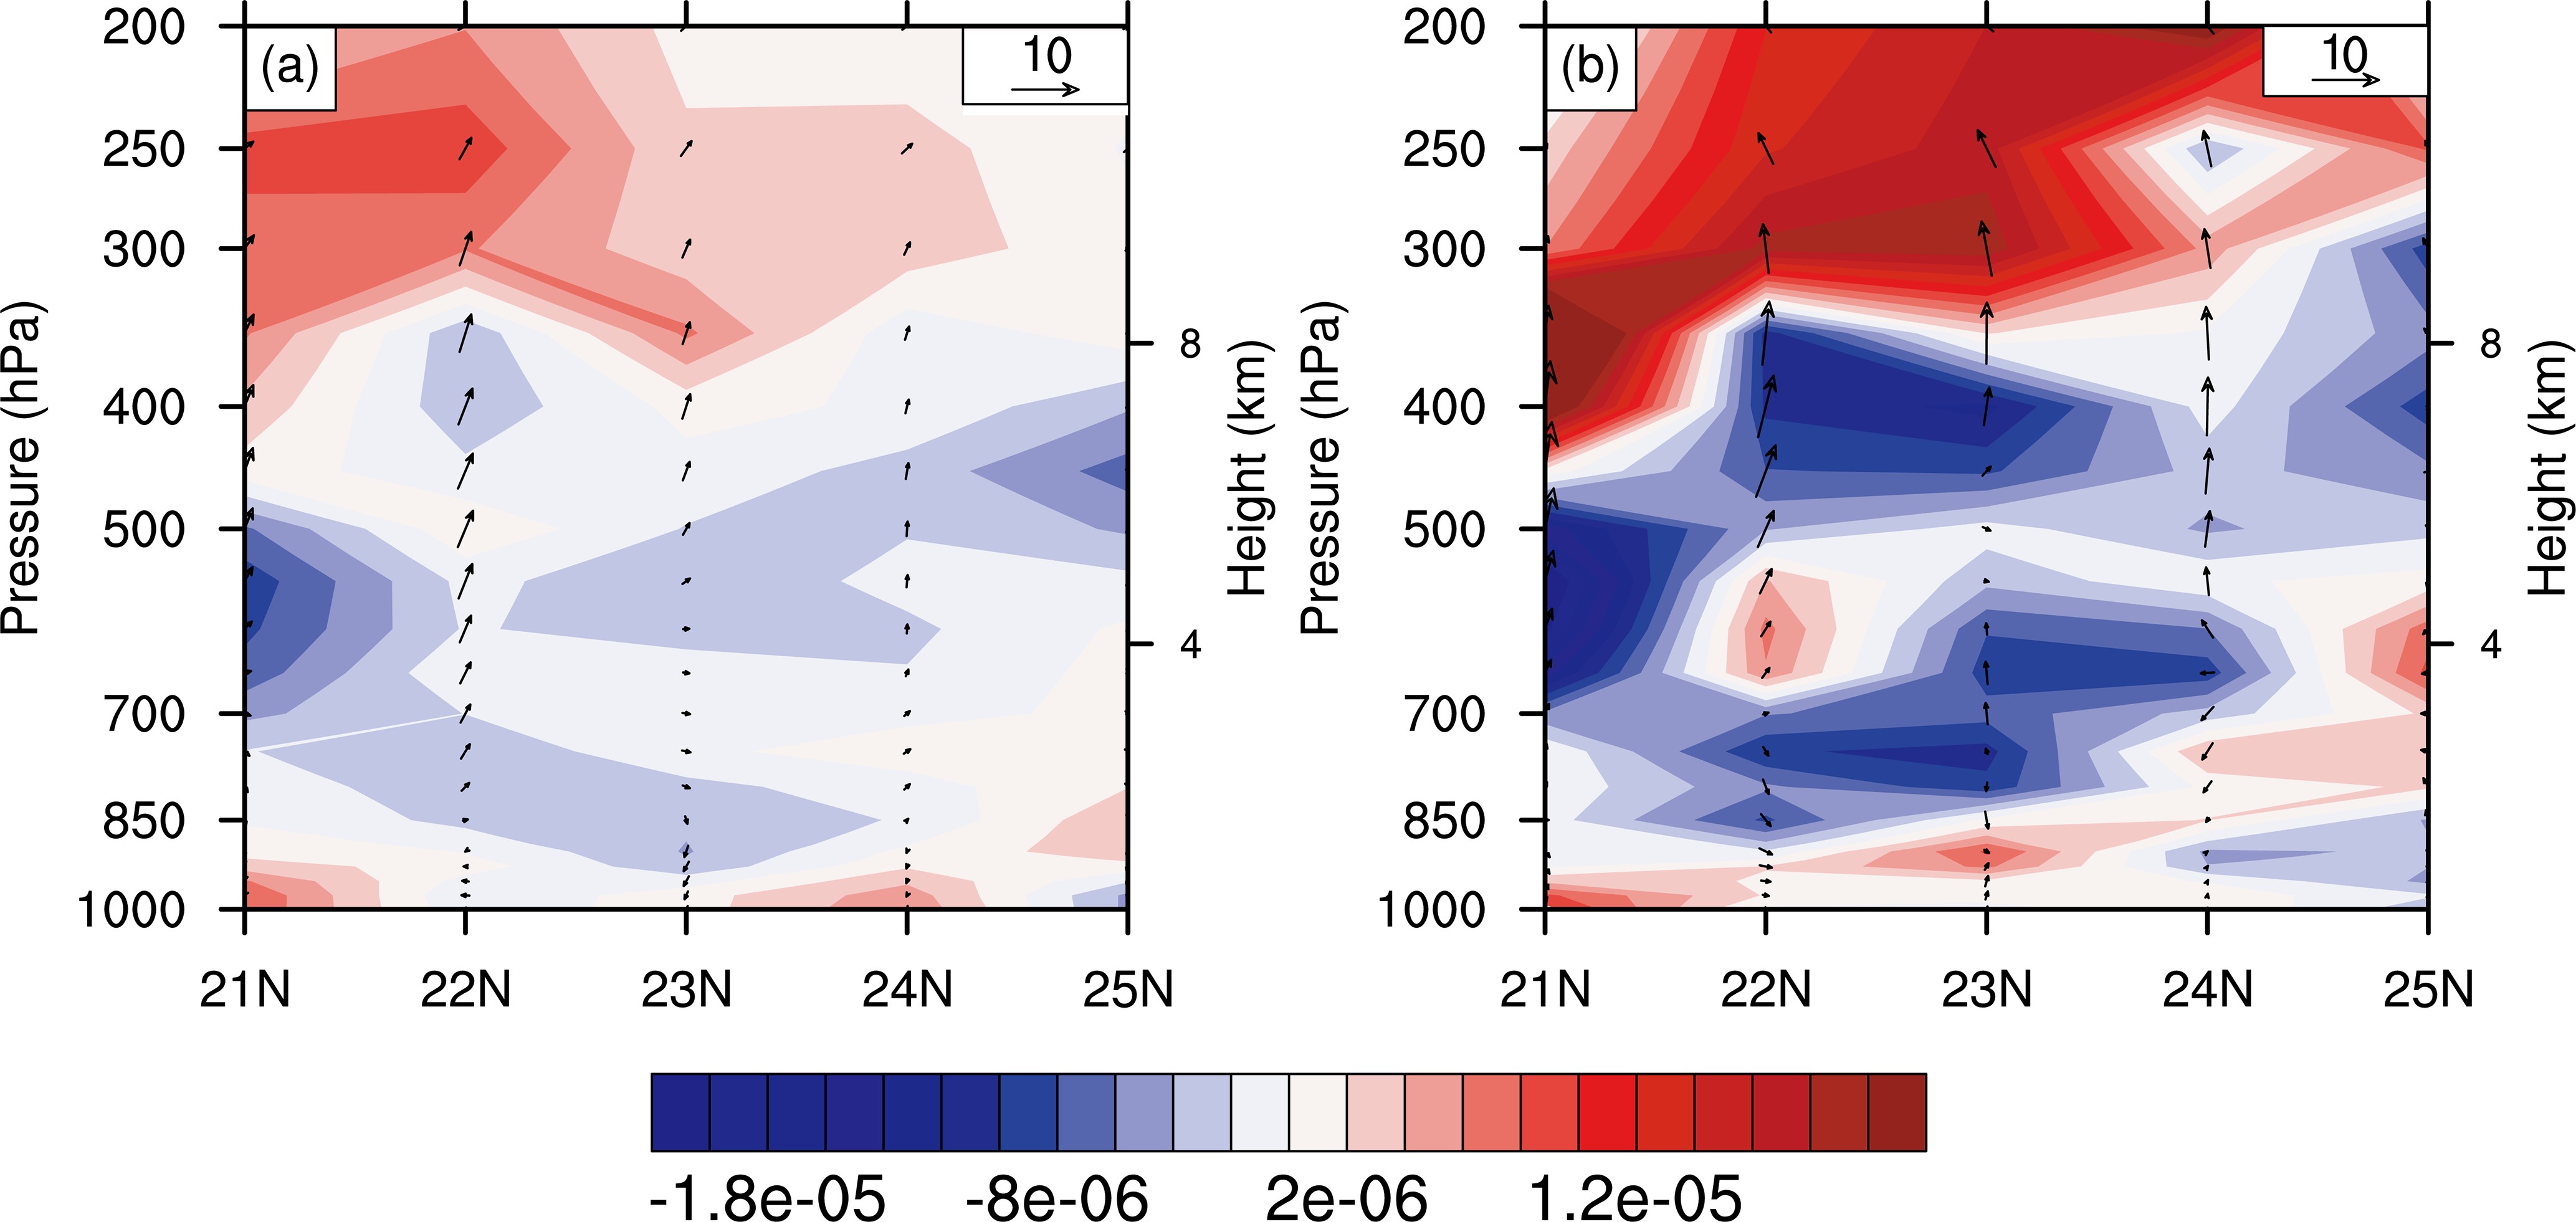 Figure7. Meridional?height (y, z) cross sections of divergence (shaded; units: s?1) and in-plane flow vectors (units: m s?1) with the vertical motion magnified by 500, taken along 115°E in P5 for (a) the 10?20-day bandpass-filtered disturbances and (b) the 3?8-day bandpass-filtered disturbances.
Figures 8a and b show the temporal evolution of the respective 10?20-day and 3?8-day bandpass-filtered area-averaged moisture and potential temperature tendencies, superimposed with the area-averaged filtered vertical motion disturbances (w). The above area-averaged tendencies are calculated from their corresponding flux convergence across the target area:
 Figure8. (a) Time?pressure diagram of the 10?20-day bandpass-filtered anomalies of moisture flux convergence (shaded; units: g kg?1 s?1), thermal flux convergence (contours; units: K s?1) and meridional?vertical (y, z) flow vectors (units: m s?1) with vertical motion magnified by 500 averaged over the area (21°?25°N, 112°?117°E) on 3 (P1), 5 (P3), 8 (P5), 12 (P7) and 15 (P9) May 2014. (b) As in (a) but for the 3?8-day bandpass-filtered fields on 6 (P1), 7 (P3), 8 (P5), 9 (P7) and 10 (P9) May 2014.
where V denotes the horizontal wind vector, ω is the vertical velocity in P-coordinates; s is the target domain, and


At the quasi-biweekly scale (Fig. 8a), we can see favorable upward motion from P4 to P6. From P1 to P3, increased warm and moist air prevails below 800 hPa, and extends upward to about 700 (500) hPa during P4 (P5), which provides sufficient moisture supply and potential instability (i.e., with warm air below cold air) to be favorable for the convective development associated with the heavy rainfall episode. The cold and dry air above 800 hPa from P1 to P3 is consistent with the presence of dominant northerly flow shown in Fig. 5. After P5, dry and cold air tendency appears, as can be expected. By comparison, the synoptic-scale fields show the presence of warm and moist disturbances in the lower troposphere, mostly below 850 hPa prior to P3, and they gradually weaken with time (Fig. 8b). Clearly, the quasi-biweekly and synoptic-scale disturbances both provide the moisture and energy needed for the generation of heavy rainfall. Certainly, the quasi-biweekly disturbances appear to generate more significant thermal and moisture transport than the synoptic disturbances to the heavy rainfall production, especially during P4 to P5.
2
4.2. The heavy rainfall episode that peaked on 21 May 2013
Figure 9 shows the temporal evolution of large-scale mean flows at 850 and 500 hPa associated with a heavy rainfall episode that peaked on 21 May 2013 (see Fig. 3c). Results show that this episode occurs ahead of a mesoscale cyclone (denoted by “C”) to the north-to-northwest under the influences of a southwesterly monsoonal flow originating from the Indian Ocean in the lower troposphere (Figs. 9a-c). Of relevance here is that the southwesterly flow strengthens during the period of 19?21 May, in association with the generation of an elongated southwest?northeast-oriented rainband. Corresponding to the lower-tropospheric mesocyclone is an intensifying trough at 500 hPa that extends from Northeast China to North Bay from 19 to 21 May (Figs. 9d-f). Unlike the 8 May 2014 rainfall episode, we see greater amplitude and spatial extent of the midlevel trough with a surface cold front, indicating more important roles of the higher-latitude cold and dry air intrusion behind, especially in the northwest of the target area, and favorable lifting ahead of the trough axis. In addition, the WNPSH retreats more eastward to the Indochina Peninsula during this rainfall episode. Precipitable water of more than 60 mm is distributed along the coastal land and water regions, where the heavy rainfall event takes place. On average, this precipitable water amount is at least 10 mm higher than that associated with the episode that peaked on 8 May 2014 (cf. Figs. 9 and 4). Figure9. As in Fig. 4 but during the period 19?21 May 2013: (a, d) 19 May; (b, e) 20 May; (c, f) 21 May.
Figure 10 shows the roles of the band-filtered quasi-monthly disturbances in determining the heavy rainfall episode that peaked on 21 May 2013. It is evident that this episode occurs in southwest-to-westerly anomalies converging with northwest-to-westerly anomalies located on the south of a cyclonic anomaly at 850 hPa in P5 (Fig. 10, left column). This cyclonic anomaly can be traced back to North China (denoted by “C”) in P1. The southeastward movement of this cyclonic perturbation from P1 to P5 facilitates the influences of westerly to northwesterly anomalies over South China. The associated southwesterly anomaly accounts for the advection of warm and moist air into the heavy rainfall region in P5. In particular, the heavy rainfall zone coincides well with the confluence of an anomalous northwesterly flow associated with the eastward-moving cyclonic anomaly and anomalous west-to-southwesterly flows associated with a quasi-stationary anticyclonic anomaly over the SCS during P4 and P5. This suggests the presence of cold frontal lifting at this time scale, which facilitates the generation of favorable conditions for the heavy rainfall production. Again, the heavy rainfall generation occurs during the eastward retreat of the WNPSH from the Bay of Bengal to the east side of the Indochina Peninsula (cf. Figs. 10 and 5). In the upper troposphere, a Rossby wave train with an anticyclonic anomaly is seen propagating northeastward into the western North Pacific during P1 to P5 (Fig. 10, right column). A distinct divergence zone associated with the propagating anticyclonic anomaly is observed to move southeastward across the target area, which facilitates a favorable vertical circulation for the occurrence of heavy rainfall.
 Figure10. As in Fig. 5 but with 15?40-day bandpass-filtered fields: (a, f) P1 on 11 May; (b, g) P2 on 13 May; (c, h) P3 on 15 May; (d, i) P4 on 18 May; (e, j) P5 on 21 May 2013.
To further illustrate the origins of quasi-monthly disturbances, Fig. 11 shows the evolution of the 15?40-day filtered OLR field. In the driest phase (P1), a weak positive (with depressed convection) OLR anomaly over South China is accompanied to its southeast by a strong negative OLR anomaly around the Philippine islands. This means that the quasi-monthly oscillation of heavy rainfall over South China may have a connection with the anomalous convective system in the western North Pacific and the SCS. This seesaw structure weakens in intensity as it migrates northwestward from P1 to P3. Its northwestward migration is more evident from P3 to P5, during which period a negative OLR anomaly (i.e., with active convective development) approaches the edge of South China in P4 and covers the rainfall center in P5. At the same time, another positive OLR anomaly is seen on its southeast, which represents an eastward shift of the WNPSH, as also shown in Fig. 10. This implies that the 15?40-day oscillation of pre-summer rainfall over South China may also correspond to variations in the WNPSH, in which the wave-like anomalous convective system originates from the equatorial western Pacific. In fact, this kind of opposite-phase variation in convective anomalies between South China and the SCS?Philippine islands is very similar to that found between the Yangtze River basin and the SCS?Philippine islands, as found by Mao and Wu (2006) and Mao et al. (2010).
 Figure11. As in Fig. 10 but for the 15?40-day filtered OLR (units: W m?2).
On the synoptic time scale (Fig. 12, left column), the filtered disturbances at 850 hPa show the presence of a cyclonic anomaly (i.e., “C”) in P5 that corresponds to a cyclone in the northwest (cf. Figs. 12 and 9c). Like that shown in Figs. 9a-c, this anomaly results from the southwestward extension of a cyclonic disturbance in P1. This disturbance grows in both amplitude and coverage from P1 to P5, due partly to the continued latent heat release associated with the heavy rainfall event. The southwestward extension of this cyclonic anomaly is facilitated by the eastward movement of an anticyclonic anomaly (i.e., “A”) out of the target area from P3 to P5. As the cyclonic anomaly approaches the target area, South China is under the influence of south-to-southwesterly anomalous warm and moist currents. In the upper troposphere (Fig. 12, right column), a higher-latitude Rossby wave train with a cyclonic anomaly is seen propagating southeastward. South China is located over the southern entrance region of an upper-level jet stream, where favorable diffluence facilitates the generation of favorable vertical motion for pre-conditioning a convectively unstable environment.
 Figure12. As in Fig. 6 but in (a, d) P1 on 19 May; (b, e) P3 on 20 May; and (c, f) P5 on 21 May 2013.
Figure 13 summarizes the temporal evolution of the area-averaged quasi-monthly and synoptic bandpass-filtered moisture flux convergence, thermal flux convergence and vertical motion fields, which differs somewhat from those associated with the episode that peaked on 8 May 2014. Specifically, at the quasi-monthly scale (Fig. 13a), upward motion with cold and dry anomalous air appears from P3 to P6, which corresponds to the northwest-to-westerly anomalous advection from higher latitudes (cf. Figs. 13a and 10). The opposite is true both prior to P2 and after P6. However, large moisture and heat flux divergence (convergence) prevails above (below) 850 hPa prior to P3. Subsequently, both the moisture flux divergence and the heat flux divergence decrease in magnitude first and then switch sign prior to P5, which is consistent with the southerly warm and moist flows into the target region (cf. Figs. 13b and 12f).
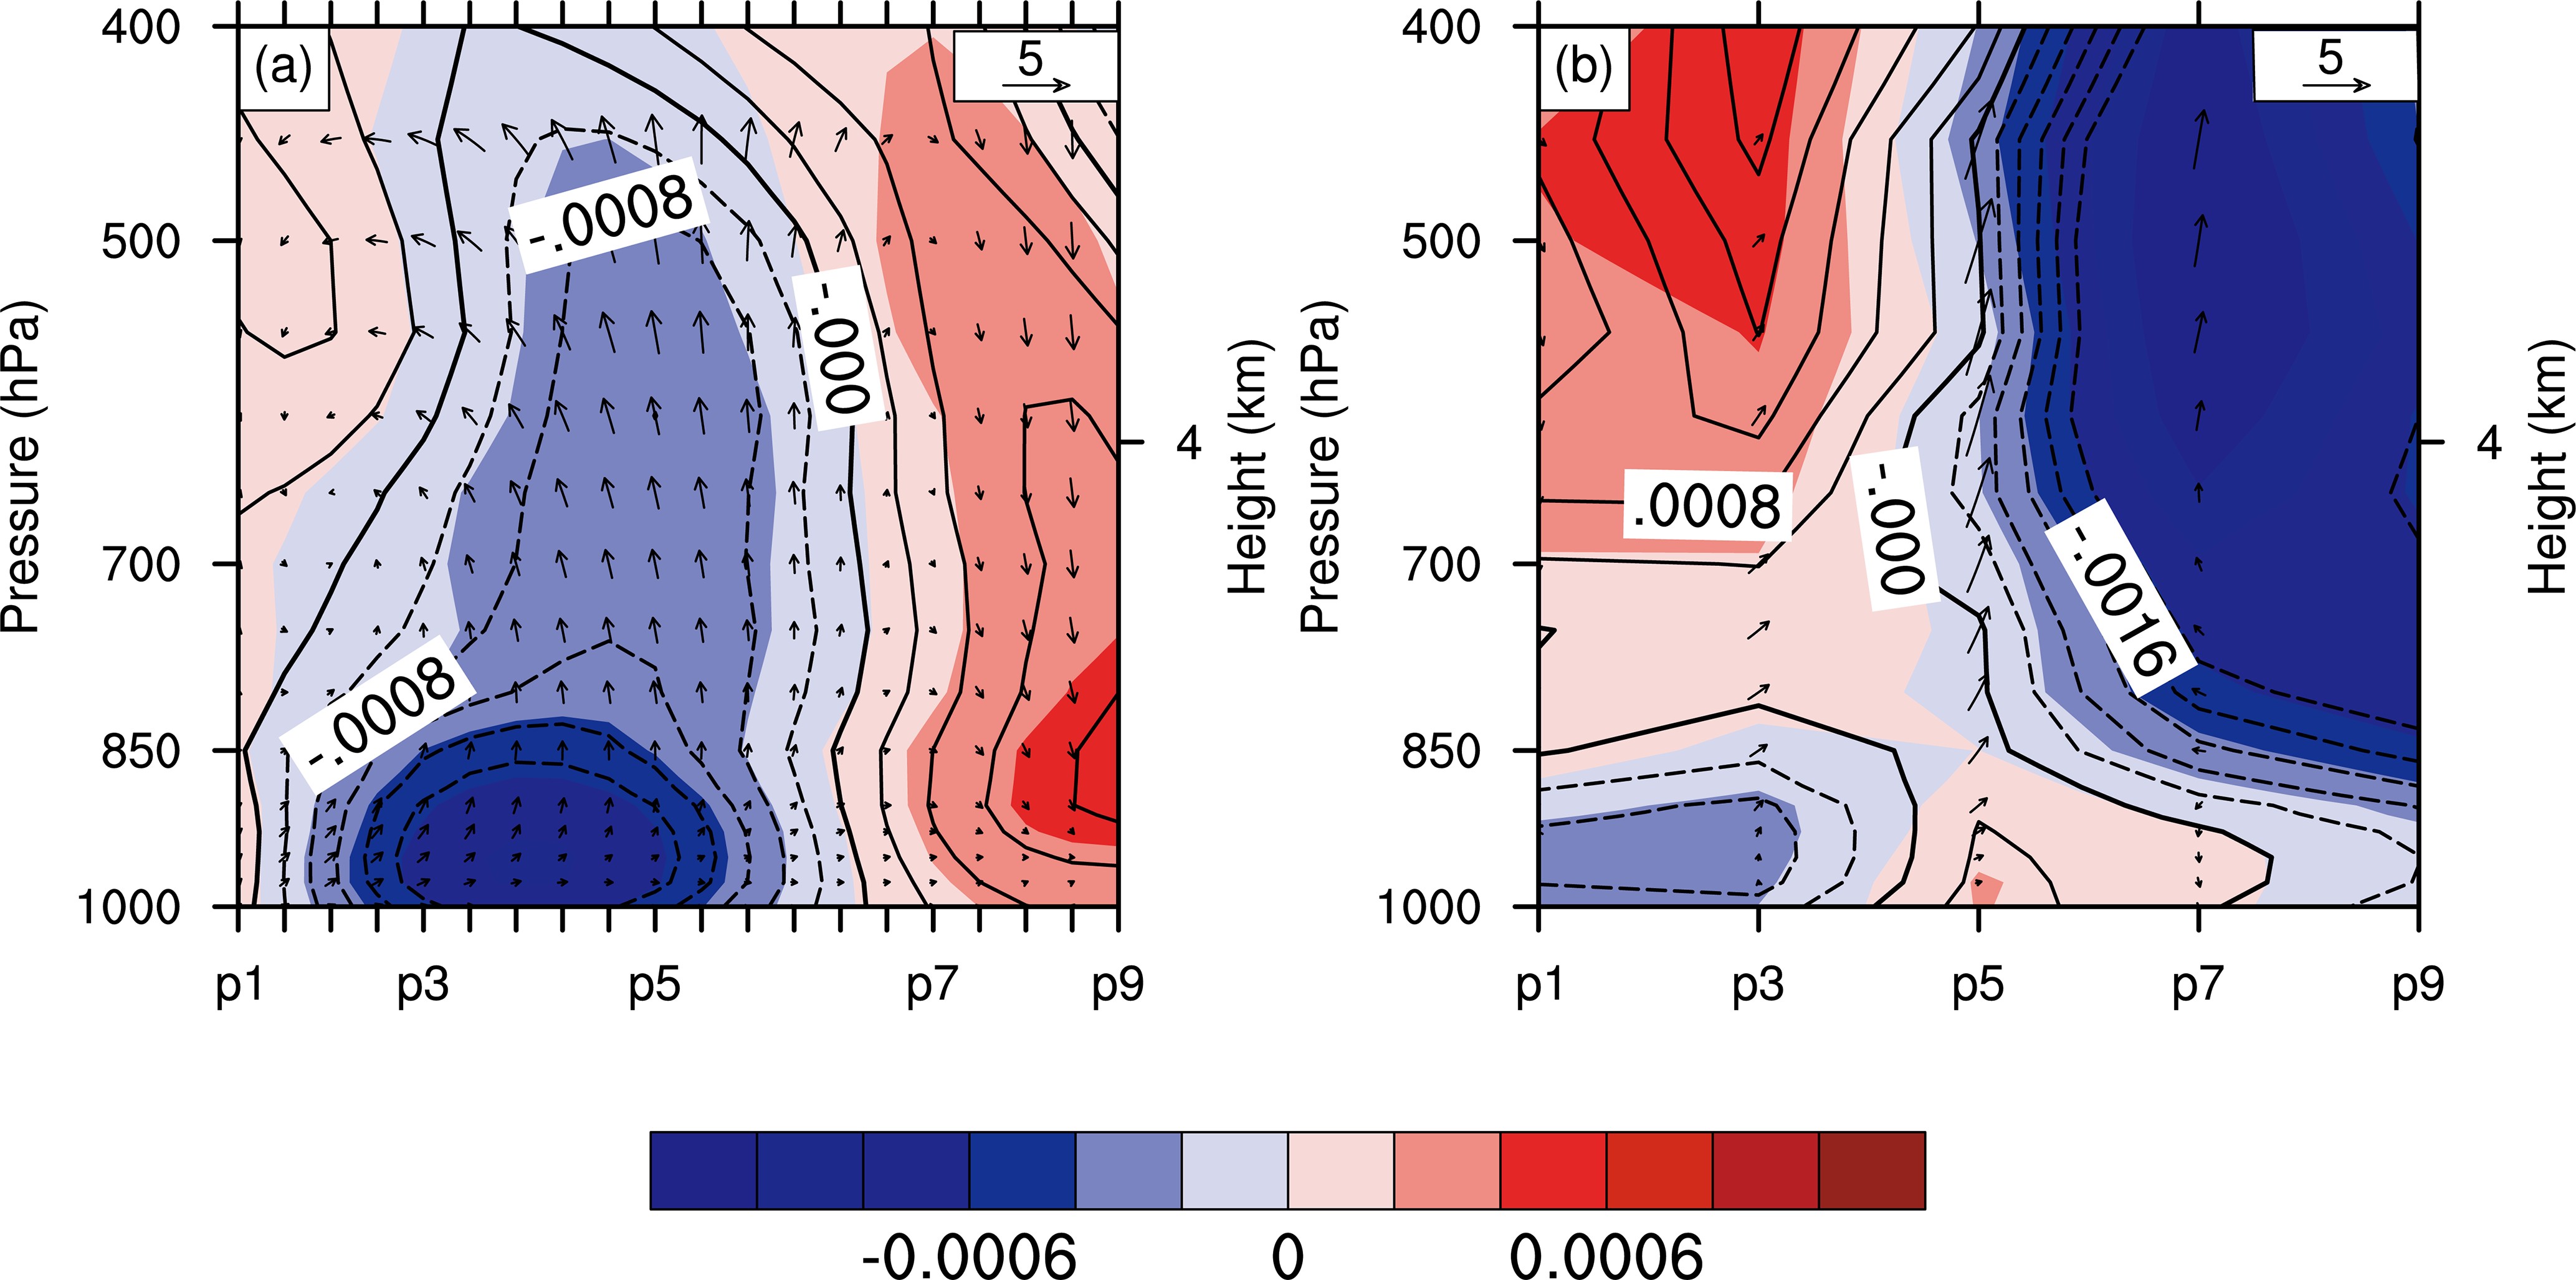 Figure13. As in Fig. 8 but with (a) 15?40-day on 11 (P1), 15 (P3), 21 (P5), 27 (P7) and 31 (P9) May 2013 and (b) 3?8-day on 19 (P1), 20 (P3), 21 (P5), 22 (P7) and 23 (P9) May 2014.
The heavy rainfall episode that peaked on 8 May 2014 occurs as a result of the interaction of several perturbations in the lower and upper troposphere at both the quasi-biweekly and synoptic time scales, with 15.1% and 35.2% variance contributions to the total rainfall variance, respectively. The upper troposphere at both time scales is controlled by approaching cyclonic anomalies around 24°N: one with south-to-southwesterly anomalies and the other with south-to-southeasterly anomalies in the wettest phase across South China. In the lower troposphere, it takes place mostly in a southwesterly anomaly converging with a trailing anomalous easterly flow at the quasi-biweekly scale. They are associated more with an anticyclonic anomaly over the SCS and an eastward traveling anticyclonic anomaly from downstream of the Tibetan Plateau, respectively. The heavy rainfall episode also takes place in a southwesterly converging with northwest-to-northeasterly anomalies at the synoptic time scale, which are associated with a southeastward migration of an anticyclonic anomaly on the lee side of the Yungui Plateau and an eastward-propagating anticyclonic anomaly at higher latitudes, respectively. Positive warm and moist air supplied at both the synoptic and the quasi-biweekly scale, which is consistent with the lower-tropospheric southwesterly flow at both time scales, contributes to the heavy rainfall production during P4?P5. Thus, we may state that the lower-tropospheric southwesterly (warm and moist) monsoonal air at both time scales accounts for the generation of the heavy rainfall episode that peaked on 8 May 2014. This result appears to differ from that found by Liu et al. (2014), in which the strong northeasterly component with a deep cold and dry layer at the synoptic scale helped generate the heavy rainfall over southern YHRB, although this process is also dominated by the quasi-biweekly and synoptic scale disturbances.
The anomalous flow fields in the heavy rainfall episode that peaked on 21 May 2013 appear to differ from those associated with the episode that peaked on 8 May 2014. The quasi-monthly and synoptic disturbances contribute to the total rainfall with 23.2% and 49.3% variances, respectively. That is, the upper troposphere experiences the passage of an anticyclonic anomaly around 25°N at the quasi-monthly scale, but a cyclonic anomaly at the synoptic scale centered around 30°N. Furthermore, the heavy rainfall zone at the quasi-monthly scale coincides with the confluence of anomalous west-to-northwesterly flows associated with an eastward-moving cyclonic anomaly and anomalous west-to-southwesterly flows associated with a quasi-stationary anticyclonic anomaly over the SCS. The presence of the anomalous west-to-northwesterly flows indicates the possible roles of higher-latitude cold and dry air intrusion in triggering deep convection and organizing the development of the associated MCSs. By comparison, the synoptic-scale heavy rainfall region is collocated with the confluence of south-to-southwesterly anomalies associated with a cyclonic anomaly that can be traced back to a cyclonic perturbation over North China in the very early phase. This perturbation grows in both amplitude and coverage from the driest to the wettest phase as a consequence of continued latent heat release. The south-to-southwesterly flow confluence and the presence of higher precipitable water than that associated with the 8 May 2014 rainfall episode account for the synoptic-scale heavy rainfall production over the target region.
Based on the above results, we may conclude that although the lower-tropospheric south-to-southwesterly mean flows provide a convectively favorable environment, it is the passage or interaction of the above-mentioned synoptic, quasi-biweekly and quasi-monthly disturbances that determines the general period and distribution of regional heavy rainfall production. Results show the important roles of these disturbances, which can be traced back to their higher latitude origins (i.e., on the downstream side of the Tibetan/Yungui Plateau or in North China) or the SCS and Indian Ocean, in enhancing the south-to-southwesterly supply of warm and moist air or in providing persistent lifting of warm and moist air along a cold front. This is more or less consistent with the findings of Li and Zhou (2015), who also emphasized the deterministic role of intraseasonal and synoptic components rather than the low-frequency background state in regulating the overall changes in moisture convergence and deep convection. Our study could not reveal the intraseasonal contributions because of the limited number of the pre-summer rainfall days used for the power spectral analysis. Certainly, our results are very preliminary. What frequencies of disturbances dominate pre-summer heavy rainfall production over South China, and where these disturbances originate, require more case studies and statistical analyses in order to help improve our understanding of the relationship between various low-frequency disturbances and the pre-summer heavy rainfall production over South China. In addition, hourly rainfall observations could be used to analyze the high-frequency characteristics of the heavy rainfall events in order to explain the residual variances shown herein.
Acknowledgements. We are grateful to the two anonymous reviewers for their valuable comments that have helped improve the quality of this work. This work was jointly supported by Special project for Key Technology Development of Meteorological Forecast Operation [Grant No. YBGJXM (2019) 04-03], the National Key R&D Program of China (Grant No. 2018YFC1507403), the National Natural Science Foundation of China (Grant No. 41475043), and the National Basic Research (973) Program of China (Grant Nos. 2014CB441402 and 2015CB954102).
