HTML
--> --> -->The strong inverse relationship between Iceland’s and the Azores’ monthly mean sea level pressure was named by Walker (1925) as the NAO. Because the anomalies in the pressure field must cause the anomalies in the wind field and other atmospheric physical fields, changes of the NAO can result in changes of marine physical fields such as the North Atlantic Meridional Overturning Circulation, SST, and sea-ice cover (Walter and Graf, 2002; Johnston et al., 2012; Woolling et al., 2015; Delworth et al., 2016; Delworth and Zeng, 2016). These changes will further drive changes of CO2 uptake in the NA, so the NAO has an important impact on the CO2 uptake in the NA.
The impact of the NAO on the CO2 uptake in the NA is complex. The responses of the physical fields and carbon cycle in the subtropical and subpolar NA to the NAO are different (Keller et al., 2012), and even the response mechanism of CO2 fluxes (fCO2) in the same NA region to the NAO from different studies is inconsistent. In the subtropical region, based on site observations, Bates (2007) pointed out that during the negative period of the NAO, the CO2 uptake is reduced because of the reducing wind speed. However, other studies showed that the SST is lower in the subtropical NA, which leads to lower pCO2sea, and thus higher rate of CO2 uptake, offsetting the effects of reduced wind speed (Cayan, 1992; Keller et al., 2012). Therefore, the relationship between the NAO and CO2 uptake in the subtropical NA is not clear up to now. On the other hand, many studies have reported a decrease in CO2 uptake in the subpolar NA during the NAO negative phase, especially from the mid-1990s to the mid-2000s (Thomas et al., 2008; Pérez et al., 2013; Schuster et al., 2013), but the reasons for the decrease are inconsistent. Thomas et al. (2008) and Pérez et al. (2013) considered that NAO-driven horizontal advection is an important factor controlling the CO2 uptake in the subpolar region. During the negative period of the NAO, the northward transport of seawater weakens because of the weakening of the North Atlantic Current, resulting in a higher concentration of dissolved inorganic carbon (DIC) in the subpolar region. As a result, the CO2 uptake is reduced (Thomas et al., 2008; Pérez et al., 2013). The model results of Keller et al. (2012) suggested that during the NAO negative phase, the CO2 uptake decreases in the eastern subpolar NA, and the changes of mixed layer depths and upwelling caused by NAO-driven wind anomalies are the main factors affecting the CO2 uptake. Moreover, Metzl et al. (2010) pointed out that during the shift from a positive NAO index to a negative index, the CO2 uptake decreases in the subpolar region due to the change of SST.
Another noteworthy aspect of NA CO2 uptake is that seasonal variations are different in different regions. The temperature-driven subtropical NA has the strongest seasonal variability of the fCO2, and is a sink of CO2 in winter and a source of CO2 in summer (Schuster et al., 2009, Landschützer et al., 2013). According to the observations at two time series sites near Bermuda, Bates (2007) pointed out that the influence of the NAO on the CO2 uptake in the subtropical NA is not significant in winter due to the opposite effects of wind speed and the disequilibrium between the partial pressures of CO2 in the air and ocean (dpCO2); in summer, the NAO impact is important, and during the negative period of the NAO, surface CO2 release will increase significantly. The subpolar NA is a sink of CO2 in summer as a result of the biologically driven winter-to-summer drawdown of CO2 (Landschützer et al., 2013). Because phytoplankton bloom events take place occasionally in the summer of some years, the interannual variability of the fCO2 in the subpolar NA is significant in summer. In winter, deeper mixing of seawater makes the CO2 in surface water rich, and the cold seawater temperature makes the biological activity weaker, resulting in high pCO2sea, so the region is a stable source of CO2 in winter (Corbière et al., 2007; Watson et al., 2009). Compared with the subtropical NA, the fCO2 in the subpolar NA has stronger interannual variability (Friedrich et al., 2006).
Because the seasonal variation of fCO2 in different regions of the NA is different, and the main controlling factors of fCO2 are different, to analyze the response of fCO2 to the NAO in the NA, we need to discuss it in separate regions and seasons. Here, we divided the NA into the subtropical region (25°–45°N) and subpolar region (45°–65°N) to study the response of fCO2 to the NAO in winter and summer, respectively. The mechanisms for the response are also explored. Due to the limitation of the time range of the observation-based data of fCO2, we only analyze the response on the interannual scale. Because there are many ways to define the NAO index (Pokorná and Huth, 2015), we used two different definitions of NAO index for analysis to more accurately determine the relationship between the NAO and the fCO2 in the NA.
2.1. Data
Monthly observed air–sea fCO2 data from 1980 to 2015 (positive values indicate CO2 outgassing from the ocean) based on the Surface Ocean CO2 Atlas were obtained directly from R?denbeck et al. (2013) atTwo definitions of the NAO index are used in this work: (1) site-based NAO index values in summer (June–July–August) and winter (December–January–February) from the Climate Analysis Section of the NCAR (
Summer NAOGong:
Winter NAOGong:
where


2
2.2. Methods
In order to understand the mechanisms of the impact of the NAO on fCO2, we need to know the main factors leading to the change of fCO2. The net exchange of CO2 between the air and the ocean (fCO2) is described by:Here, K is the air–sea gas transfer coefficient and is the product of k and α, where k is the CO2 gas transfer velocity at sea water, and α is CO2 solubility in seawater, which can be influenced by SST. pCO2air and pCO2sea are the partial pressures of CO2 in air and sea-surface water, respectively.

where Sc is the Schmidt number and indicates the ratio of seawater dynamic viscosity to gas diffusion coefficient.
For discussion on the anomalies of physical fields in summer and winter, first, the fields are averaged in winter or summer, and then the trend is removed using the least-squares linear method. The average of the fields in the subtropical NA is an area-weighted average of the region (25°–45°N, 100°W–40°E). Meanwhile, the average of the physical fields in the subpolar NA is also treated, and the selected region is (45°–65°N, 100°W–40°E). The grid point where the sea-ice coverage exceeds 15% is treated as default to avoid the effect of the sea ice on the fCO2. For discussion on the influences of the NAO index and associated variables (vm10 and pCO2sea, SST) on fCO2, standardized regression coefficients (RCs) (see sections 3 for more details) are examined.
The specific cycles of the winter (or summer) NAO index and area-average fCO2 anomalies are obtained by power spectrum estimation. Because the main cycles characterized by the interannual sign of the NAO are within 2–6 years (Jing et al., 2019), the interannual sign is therefore extracted using a 2–6-year Lanczos bandpass filter for the following study, so the anomalies of these variables mean their interannual variabilities. The confidence level of the linear regression is evaluated using the two-tailed Student’s t-test, and the effective degrees of freedom (DOF) is calculated following Bretherton et al. (1999):
where N is the sample size, and r1 and r2 are the lag-one autocorrelations of the two time series, respectively.
3.1. Periodicities of the NAO and NA fCO2
The cycles of the NAO indexes over the years 1980 to 2015, which were obtained by power spectrum estimation, are shown in Table 1 and Fig. A1 in Appendix. NAOGong and NAONCAR in winter both have a significant cycle of 5.8 years characterized by inter-annual signals. Besides, NAONCAR in winter also has a significant interannual cycle of 2.7 years. As for the summer NAO indexes, NAONCAR has the same periodicity as the winter one, and NAOGong has one more cycle of 2.1 years than that in winter. Because the winter and summer NAO indexes mainly reflect the signals of 2–6 years, we use a bandpass filter of 2–6 years in the following analysis.| Winter | Summer | |
| NAOGong | 5.8 | 2.1, 5.8 |
| NAONCAR | 2.7, 5.8 | 2.7, 5.8 |
| Subtropical fCO2 | 3.7–4.3 | 2.9–3.2, 25 |
| Subpolar fCO2 | 2.7, 6.7–7.5 | 2.1–2.2, 14–25 |
Table1. Periodicities of the winter (or summer) NAOGong, NAONCAR and area-averaged CO2 flux (fCO2) anomalies, determined by power spectrum analysis. Specifically, the periodicities are determined by calculating the red noise confidence interval and choosing those at the 90% confidence level. The time period for the data ranges from 1980 to 2015.
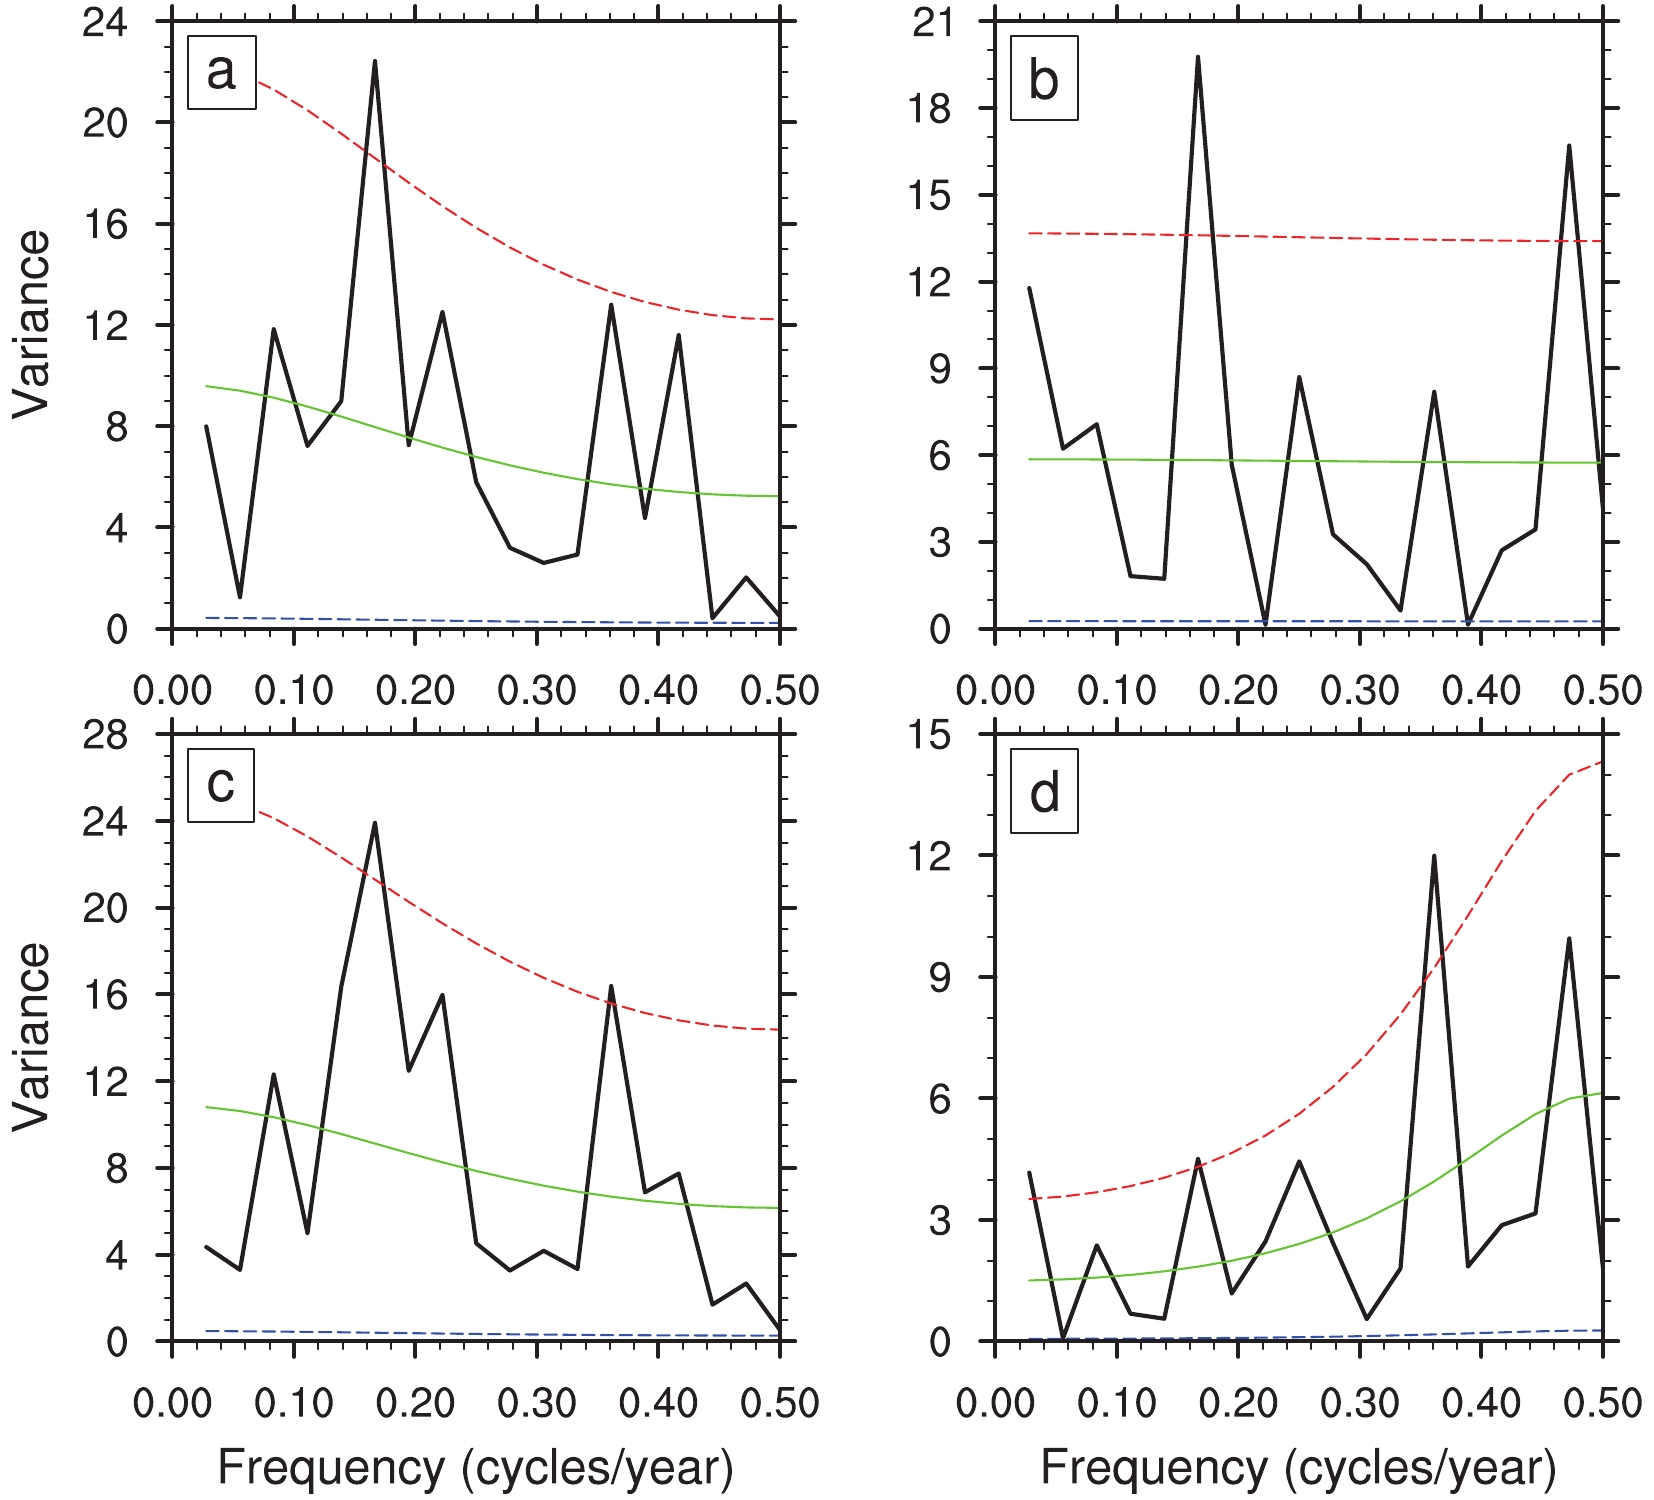 FigureA1. Power spectrum of NAOGong (a, b) and NAONCAR (c, d) in winter (December–January–February) (a, c) and summer (June–July–August) (b, d). Red and green lines indicate 5% and 90% “red noise” confidence bounds. The time period for NAOGong and NAONCAR is 1980–2015.
The cycles of the anomalies of area-averaged net air–sea fCO2 (positive values indicate CO2 outgassing from the ocean) in the subtropical and subpolar NA are shown in Table 1 and Fig. A2. In both the subtropical and subpolar NA, the anomalies of area-averaged fCO2 have the interannual signals in winter and summer. In summer, there are decadal signs in the area-averaged fCO2 in both the subtropical and subpolar NA. Numerous studies have pointed out that the NAO is affected differently by the jet on different time scales, and its effects on the ocean physical field on different time scales are also different (Viles and Goudie, 2003; Woollings et al., 2015). In addition, on the different time scales, the main controlling factors leading to the change of fCO2 are also different. Couldrey et al. (2016) pointed out that with increasing of time scale the controlling factor of the NA fCO2 variability changes from the gas transfer velocity to the dpCO2. Therefore, discussion on the influences of the NAO on the fCO2 in the NA on different time scales is of great significance to understand the temporal variation of the fCO2 and to improve the projection of the carbon cycle in the NA. Unfortunately, because of the lack of long-term pCO2sea observation-based data, the impact of the NAO on the fCO2 at the longer time scale is not included in this study. In order to study the relationship between the fCO2 and the NAO on the interannual scale, we also used a bandpass filter of 2–6 years on the fCO2 anomalies.
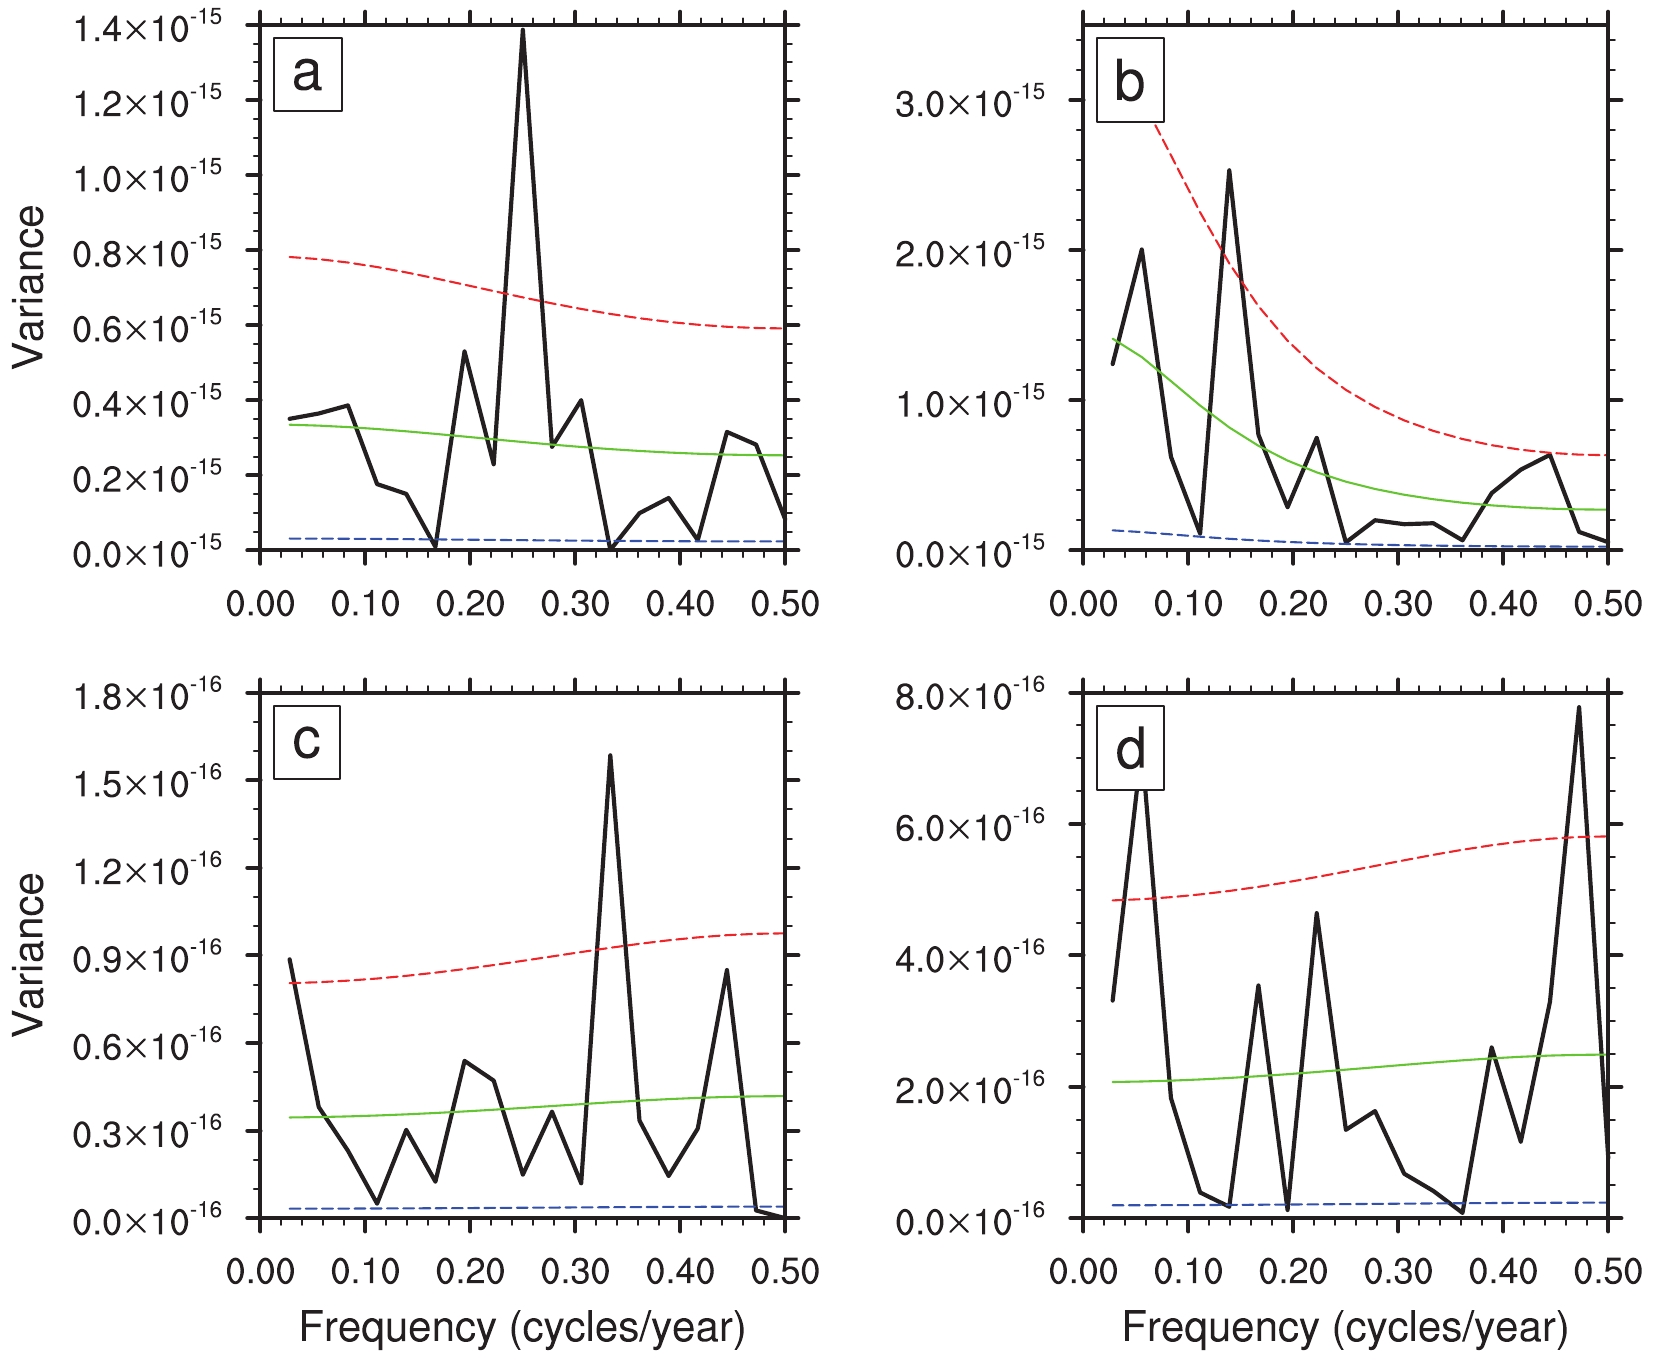 FigureA2. Power spectrum of the area-averaged air–sea CO2 flux in winter (December–January–February) (a, b) and summer (June–July–August) (c, d) in the subtropical (a, c) and subpolar (b, d) regions. Red and green lines indicate 5% and 90% “red noise” confidence bounds. All data are from 1980 to 2015.
The correlation coefficients between the NAO indexes and the area-averaged fCO2 in the subpolar or subtropical NA in different seasons are listed in Table 2. Only the area-averaged fCO2 in the subtropical region in winter responds very significantly to the NAO, especially to the NAO index defined by the Gong method, for which the correlation coefficient reaches 0.54 with 35 DOFs. It indicates that during the positive phase of the NAO, the CO2 release from the subtropical NA increases in winter, and the relationship between the NAO and the area-averaged fCO2 is not significant in summer. This is contrary to the conclusion of Bates (2007), who pointed out that the relationship between the NAO and fCO2 is not significant in winter, but is significant in summer based on observation-based data from two time series obtained at sites near Bermuda. This also demonstrates that the characteristics of the carbon cycle in Bermuda are not representative of that in the whole subtropical NA. The relationship between the NAO and area-averaged fCO2 in the subpolar region is not significant in both summer and winter. This is probably due to the inconsistent response of the fCO2 anomalies to the NAO in different sea areas of the subpolar region.
| Summer | Winter | ||||
| Subtropical | Subpolar | Subtropical | Subpolar | ||
| NAOGong | 0.07 (34) | ?0.06 (31) | 0.54 (35) | ?0.07 (36) | |
| NAONACR | ?0.11 (34) | 0.24 (33) | 0.34 (36) | ?0.12 (36) | |
Table2. Correlation coefficients between the NAO indexes and the area-averaged fCO2 anomalies in the subtropical and subpolar NA on the interannual scale in winter and summer. The time period for data ranges from 1980 to 2015. Numbers in parentheses are the corresponding number of degrees of freedom calculated according to Eq. (6). Bold numbers indicate that the correlation coefficients are significant at the 95% confidence level.
2
3.2. Relationship between the NAO and fCO2 in winter
Figure 1 shows the RCs of the fCO2 anomalies against the NAO indexes on the interannual scale in winter. The significant RCs between the NAO indexes and the fCO2 anomalies are positive–negative–positive along the meridional direction, which shows the relationship of a wave-train-like pattern between the fCO2 anomalies and the NAO. In the subtropical NA, the positive RCs of the fCO2 anomalies against the winter NAO indexes occur in most regions, which is consistent with Table 2. In the subpolar region, the RCs of the fCO2 anomalies against the winter NAO indexes (especially NAONCAR) are negative within 45°–60°N. Because the positive fCO2 indicates the CO2 release from the sea surface, the CO2 uptake is in decline during the period of negative NAO phase in the subpolar region in winter, which is consistent with previous studies (Thomas et al., 2008; Pérez et al., 2013). The RCs are positive north of 60°N, as opposed to south of 60°N, which results in a phenomenon whereby the relationships between winter NAO indexes and the area-averaged fCO2 in the subpolar region are not significant, as reflected in Table 2.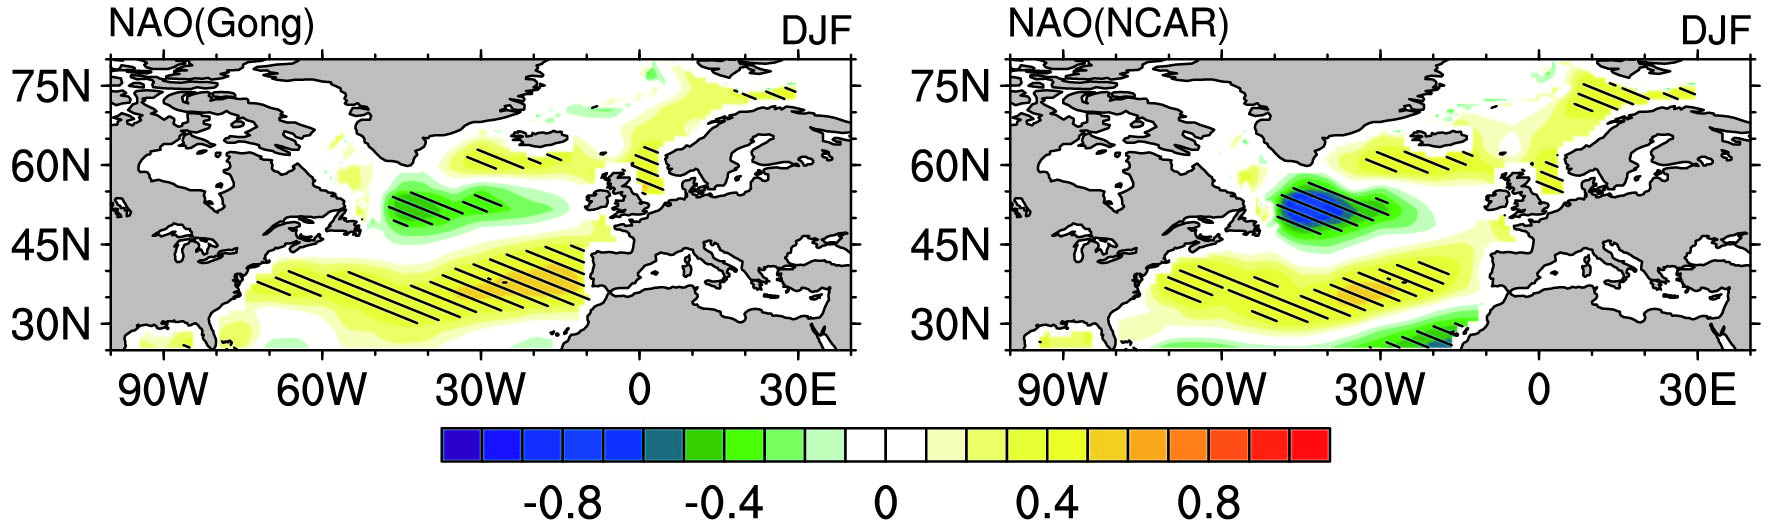 Figure1. Regression coefficients (RCs) of the air–sea CO2 flux anomalies against NAOGong and NAONCAR in winter (December–January–February) on the interannual scale. Shaded areas indicate that RCs are statistically significant at the 95% confidence level of the Student’s t-test. The time period for the data ranges from 1980 to 2015.
According to Eq. (3), there are two main factors controlling the change of fCO2—namely, the CO2 gas transfer velocity associated with wind speed, and the difference in dpCO2. Compared with the pCO2sea, the interannual variability of pCO2air is negligible, so only the influence of pCO2sea on the fCO2 is investigated. The CO2 gas transfer velocity can only affect the intensity of the fCO2 and the direction of fCO2 is determined by the dpCO2. As a result, the impact of the wind speed (vm10) and pCO2sea on the fCO2 needs to take the direction of fCO2 into consideration. The signs of the value of pCO2sea anomalies and fCO2 anomalies (positive values indicate CO2 outgassing from the ocean) are the same, and the increase of pCO2sea will lead to the increase of CO2 release. Therefore, the non-significant or negative RCs of the fCO2 anomalies against the pCO2sea anomalies mean that the pCO2sea anomalies are not the dominant factor affecting the fCO2 anomalies.
Figure 2 shows the time-averaged fCO2 and the RCs of the fCO2 against the vm10 from 1980 to 2015 and against the pCO2sea from 1983 to 2011 in winter. Most of the regions south of 55°N and north of 65°N are a sink of atmospheric CO2, with the maximum absolute value of fCO2 being at around 40°N. The region south of Iceland (60°–65°N) is the source of atmospheric CO2 affected by the winter convection mixing.
 Figure2. Multi-year mean CO2 fluxes in winter (a), and RCs of the fCO2 anomalies against the 10-m wind speed anomalies (b) and against the partial pressures of CO2 in the sea surface anomalies (c) in winter, respectively. Shaded areas indicate that RCs are significant at the 95% confidence level of the Student’s t-test. The time period for (a) and (b) ranges from 1980 to 2015, and for (c) ranges from 1983 to 2011.
On the interannual scale, the winter vm10 can significantly affect the fCO2 in the subtropical NA and most of the subpolar NA (Fig. 2b). In the region of the sink of CO2 (negative fCO2), the RCs of the fCO2 anomalies against the vm10 anomalies are negative, which indicates that in winter, the phase of vm10 is consistent with the phase of fCO2 in this region. The fCO2 anomalies in most regions of the NA are less affected by the pCO2sea anomalies, especially in the region between 30° and 60°N, and only in the small region south of Greenland and south of 30°N is there a significant relationship between the fCO2 and pCO2sea (Fig. 2c).
Whether the vm10 driven by the NAO has an impact on the fCO2 anomalies in winter is explored here. In terms of the relationships between winter NAO indexes and vm10 anomalies (Fig. 3), the RCs of the vm10 anomalies against the NAO indexes are significantly positive in the region north of 45°N and significantly negative in the region at around 35°N. The negative RCs of the vm10 anomalies against NAONCAR are more significant, compared with the RCs against NAOGong. The relationships between the NAO indexes and vm10 anomalies are consistent with the model results of Keller et al. (2012). In addition, in winter, the meridional distribution pattern of significant RCs of the fCO2 anomalies against the NAO indexes is opposite to that of the vm10 anomalies against the NAO indexes in the region of 30°–60°N in the NA. This is consistent with the fact that in these regions the RCs of the fCO2 anomalies against the vm10 anomalies are mostly negative. Specifically, during the positive period of the NAO, in the region of CO2 release south of Iceland and the region of 45°–55°N for CO2 uptake, enhancement of vm10 leads to the increase in the release and uptake of atmospheric CO2, respectively. In the region of the sink of CO2 south of 45°N, the CO2 uptake is weakened due to the weakening of vm10. It demonstrates that, in winter, the response of fCO2 to the NAO is mainly dominated by wind speed in the NA.
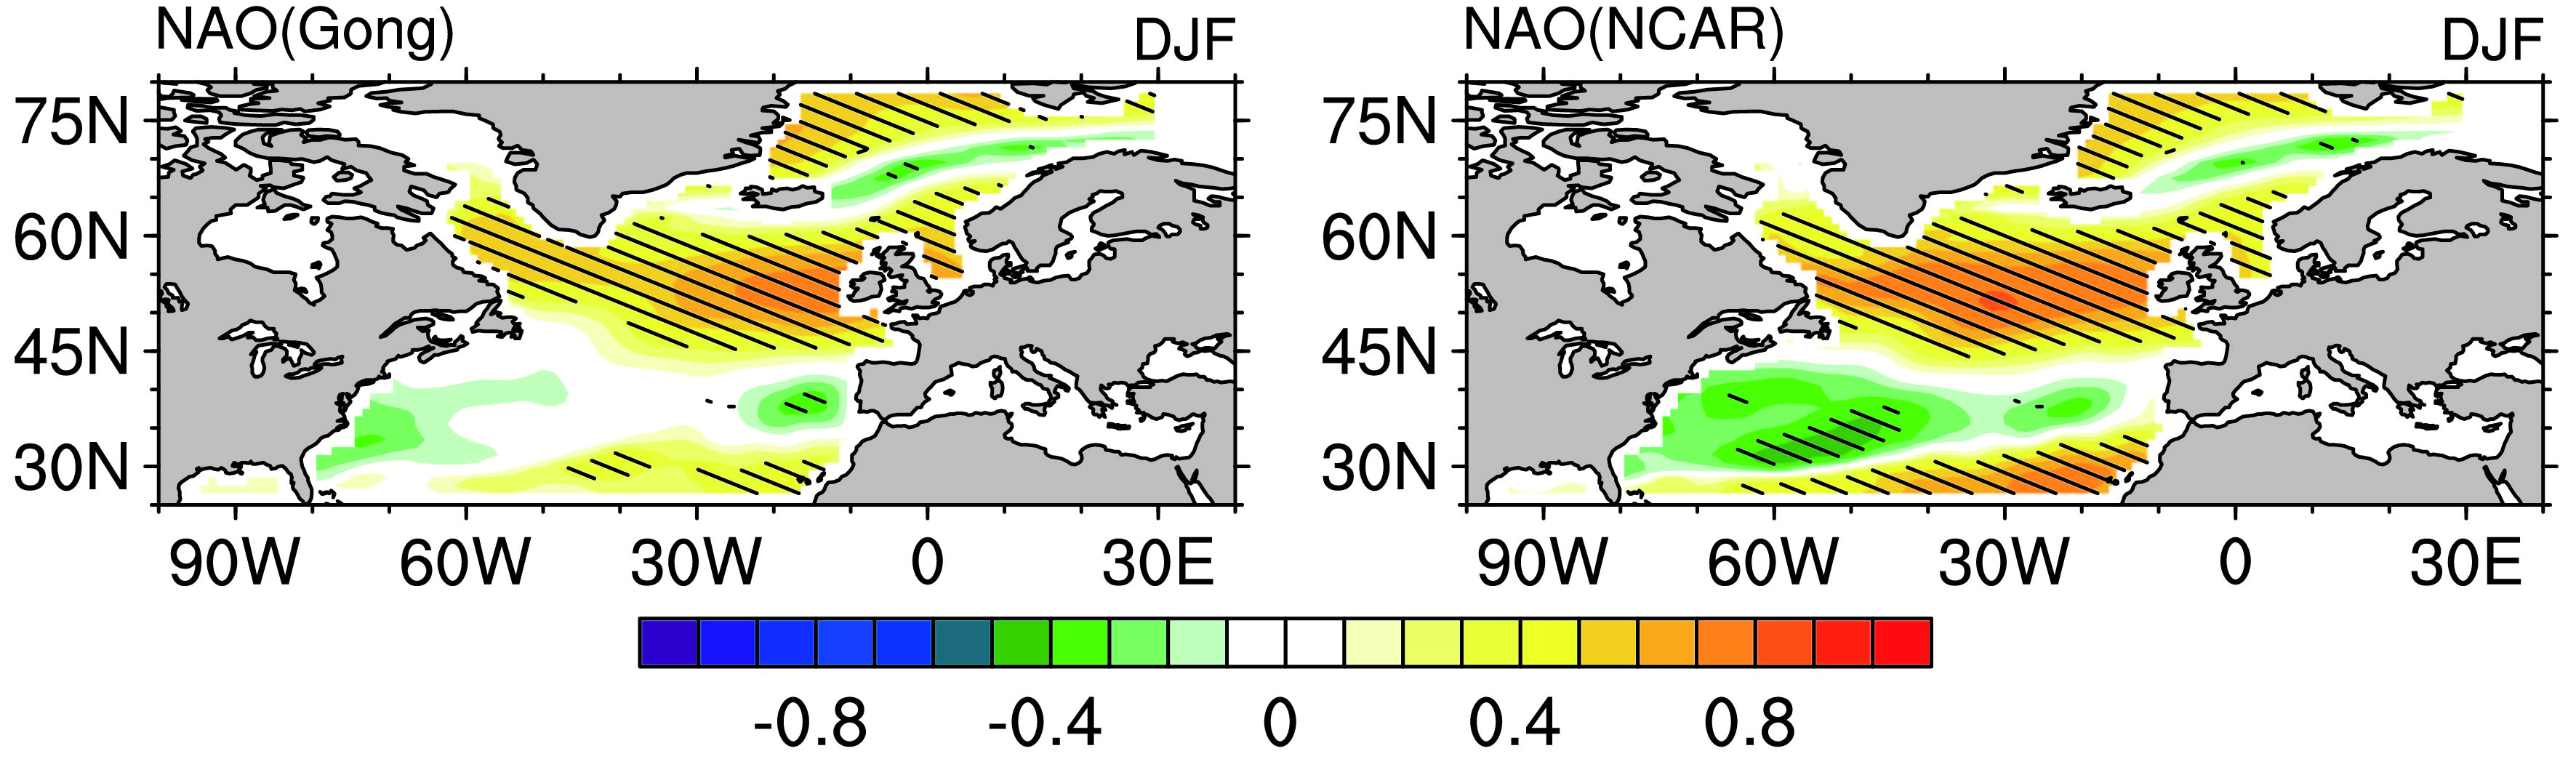 Figure3. Regression coefficients (RCs) of the vm10 anomalies against NAOGong and NAONCAR in winter on the interannual scale. Shaded areas indicate that RCs are statistically significant at the 95% confidence level. The time period for the data ranges from 1980 to 2015.
The reason for the weak impact of pCO2sea on the interannual variation of the fCO2 is also investigated. There is a significant correlation between the fCO2 anomalies and NAO indexes in the NA, while the relationship between the pCO2sea anomalies and the NAO indexes is not significant for most regions with exception of some sporadic small regions, but in the relatively large region of 35°–40°N the pCO2sea anomalies have a strong negative response to the NAO (Fig. 4) as well as the response of vm10 to the NAO (Fig. 3). Both negative responses to the NAO generate different results in the fCO2 anomalies. In other words, if the pCO2sea response increases the fCO2, the vm10 response decreases the fCO2, since the region of 35°–40°N is a sink of atmospheric CO2 in winter, so that the influences of the NAO-driven pCO2sea and wind speed on the fCO2 are opposite to each other. The positive response of the fCO2 on the NAO indicates that, in this region, the impact of the NAO-driven vm10 on CO2 uptake is larger than that of NAO-driven pCO2sea.
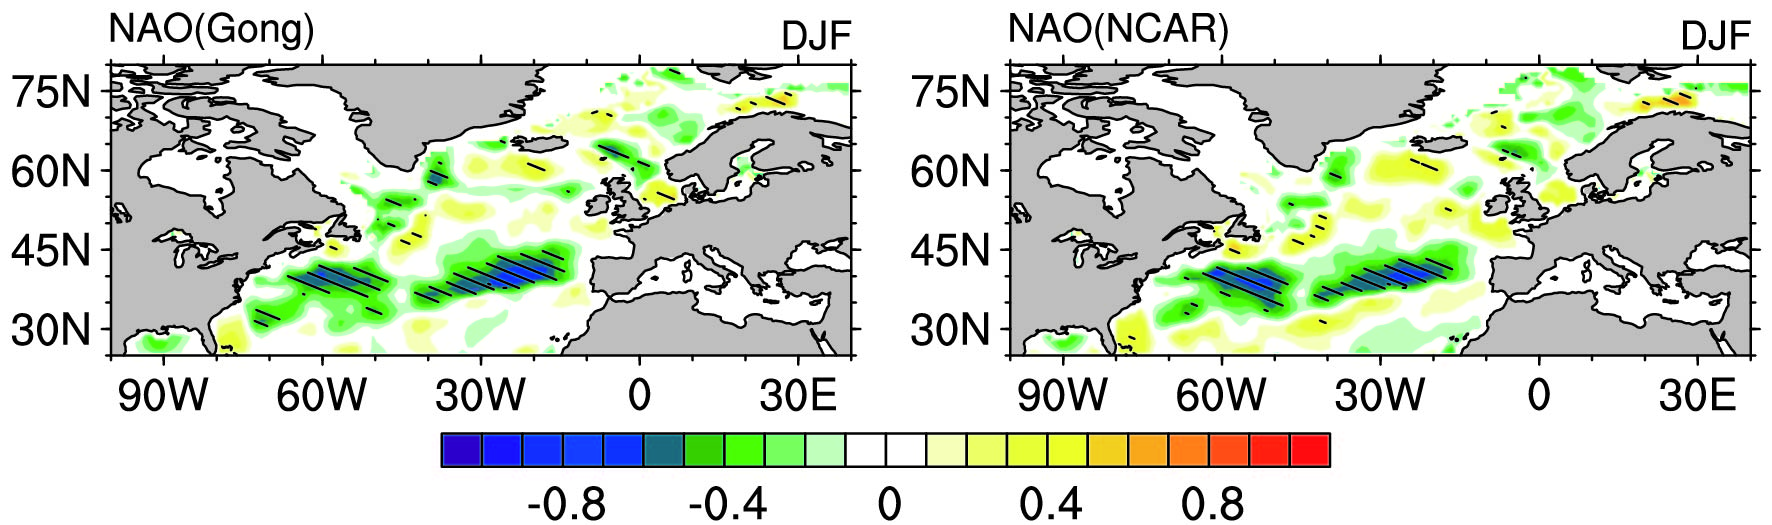 Figure4. Regression coefficients (RCs) of the pCO2sea anomalies against NAOGong and NAONCAR in winter on the interannual scale. Shaded areas indicate that RCs are statistically significant at the 95% confidence level. The time period for the data ranges from 1983 to 2011.
The pCO2sea anomalies in the surface seawater are mainly induced by the change of SST and DIC, and the increase of SST or DIC can enlarge the pCO2sea (Schuster et al., 2009; Dong et al., 2017). As shown in Fig. 5a, in winter, the SST only dominates the change of the pCO2sea south of 35°N, which is very similar to the relationship of the fCO2 anomalies and the pCO2sea anomalies (Fig. 2c). It indicates that there are other factors controlling the interannual variation of pCO2sea north of 35°N. As a result, there is no obvious relationship between the interannual variations of pCO2sea and fCO2, which is consistent with the previous finding that the pCO2sea anomalies in the subpolar NA may be affected by the DIC supply induced by the vertical mixing (Ullman et al., 2009), just like the equatorial Pacific, which has strong upwelling (Dong et al., 2017). In addition, the interannual variation of SST south of 35°N is not induced by the NAO (Fig. 5b and c), so there is no response of the pCO2sea to the NAO in this region on the interannual scale (Fig. 4).
 Figure5. Regression coefficients (RCs) of the pCO2sea anomalies against the SST anomalies in winter (a), and RCs of the SST anomalies against NAOGong (b) and NAONCAR (c) in winter. Shaded areas indicate that RCs are significant at the 95% confidence level of the Student’s t-test. The time period for the data ranges from 1983 to 2011.
2
3.3. Relationship between the NAO and fCO2 in summer
The correlation coefficients between the NAO indexes and the area-averaged fCO2 in the subpolar or subtropical NA in summer are less than 0.24 and do not reach the 95% confidence level (Table 2). The RCs of the fCO2 anomalies against the NAO indexes in summer are shown in Fig. 6. In summer, the response of the fCO2 anomalies to the NAO has spatial differences in both the meridional and zonal directions. Along the meridional direction, the latitudes of the regions with positive and negative RCs are generally consistent with those in winter, but absolute values of the RCs in the subpolar region are reduced, for which the RCs do not reach the 95% significance test north of 50°N. Along the zonal direction, compared with winter, the largest difference of RCs in summer occurs in the subtropical region, in which the RCs change from significant positive regions in winter to a positive-west and negative-east distribution pattern in summer. Bates (2007) mentioned that the fCO2 in the Bermuda Sea has a significant response to the NAO in summer, which is close to our result, but for the whole subtropical NA, the effect of the NAO on the fCO2 anomalies in the region with negative RCs in the eastern region offsets the effect in the region with positive RCs in the central and western region. As a result, in summer the NAO has no significant effect on the area-averaged fCO2 in the subtropical region (Table 2). From the above analysis, the relationship between the NAO and the fCO2 anomalies has a stronger seasonality in the subtropical region than that in the subpolar region.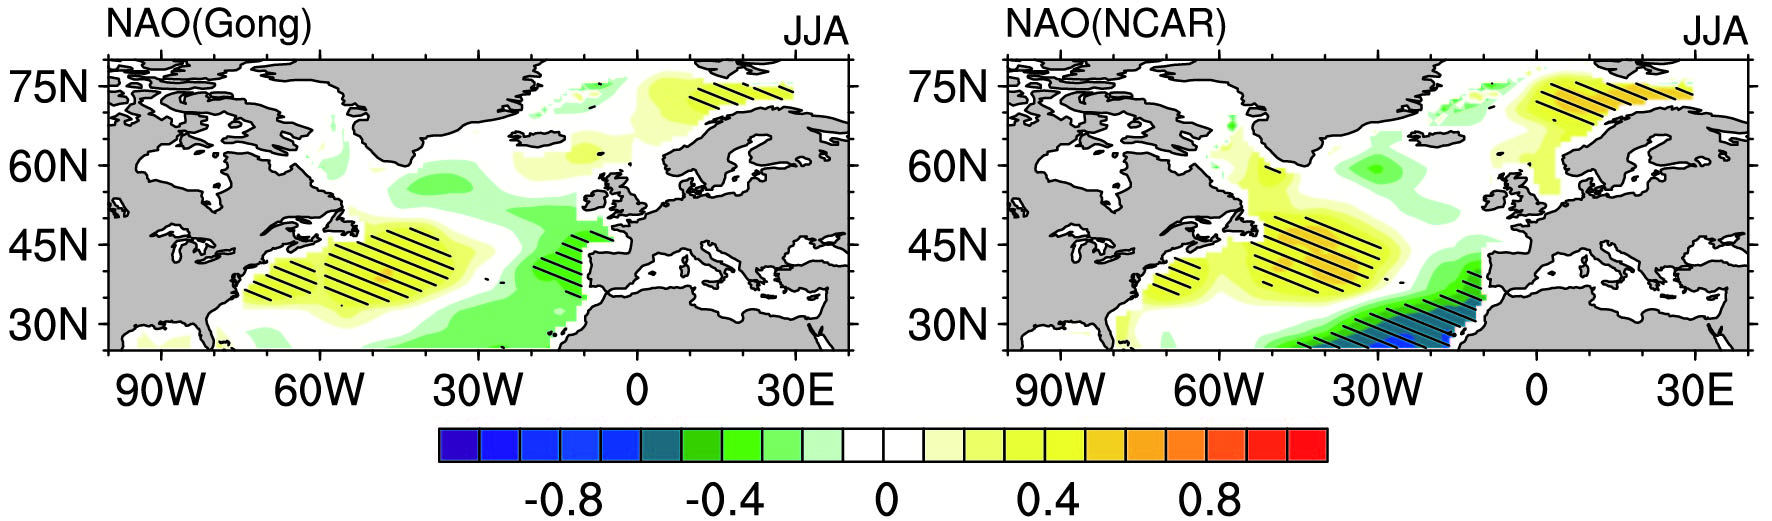 Figure6. Regression coefficients (RCs) of the fCO2 anomalies against NAOGong and NAONCAR in summer (June–July–August) on the interannual scale. Shaded areas indicate that RCs are statistically significant at the 95% confidence level of the Student’s t-test. The time period for the data ranges from 1980 to 2015.
The significant difference between the response of the fCO2 in the NA to the NAO in summer and winter indicates that the main factors controlling the interannual variation of the fCO2 have changed from winter to summer. The summertime-averaged fCO2 in the NA is shown in Fig. 7a. Affected by the productivity and SST, the region north of 40°N is a sink of CO2, while the region south of 40°N is a weak source of CO2. As a result, the absorption of atmospheric CO2 in the NA is significantly weaker in summer than in winter.
 Figure7. Multi-year mean CO2 fluxes in summer (a), and regression coefficients (RCs) of the fCO2 anomalies against the vm10 anomalies (b) and the pCO2sea anomalies (c) in summer. Shaded areas indicate that RCs are significant at the 95% confidence level of the Student’s t-test. The time period for (a) and (b) ranges from 1980 to 2015, and for (c) ranges from 1983 to 2011.
Figure 7b shows that fCO2 anomalies are less affected by vm10 in almost all of the NA in summer. In the CO2 sink region, only in a small part of the sea area in the western subtropical region does the fCO2 have a significant relationship with vm10. The relationship between the summer fCO2 anomalies and the pCO2sea anomalies shows that, in summer, the NA fCO2 anomalies are significantly affected by the pCO2sea anomalies in most regions (Fig. 7c). The regions characterized by significant positive RCs at the 95% confidence level are increased relative to those in winter (Fig. 2c), especially in the subtropical NA. The major response regions of the fCO2 to pCO2sea are concentrated in the west and east of the subtropical NA, and in the sea area south of Iceland.
The RCs of the summer pCO2sea anomalies against the NAO indexes (Fig. 8) illustrates that, in summer, the response of pCO2sea to the NAO in the subtropical region reveals a converse change for the east and the west, which is consistent with the response of the fCO2 anomalies to the NAO in this region (Fig. 6); that is, during the positive period of NAO, the CO2 release from the sea surface is increased due to the increase of pCO2sea in the western and central regions, whereas it is weakened in the eastern region. In the subpolar region, the RCs of the fCO2 anomalies against the pCO2sea anomalies are significantly positive in the region south of Iceland (Fig. 7c); that is, in this region there is a significant influence of the pCO2sea anomalies on fCO2 anomalies. However, the responses of the pCO2sea anomalies to the NAO are very weak, which indicates that the fCO2 anomalies in the subpolar region will be affected by the non-NAO driven pCO2sea anomalies in summer.
 Figure8. Regression coefficients (RCs) of the pCO2sea anomalies against NAOGong and NAONCAR in summer on the interannual scale. Shaded areas indicate that RCs are statistically significant at the 95% confidence level of the Student’s t-test. The time period for the data ranges from 1983 to 2011.
The RCs of the pCO2sea anomalies against the SST anomalies are shown in Fig. 9a. In summer, the SST dominates the change of the pCO2sea in most regions of the NA south of 50°N. Because there is no strong vertical movement, the change of pCO2sea is largely influenced by the change of SST through the chemical thermodynamic process, like the subtropical Pacific (Li and Xu, 2012). In Figs. 9b and c, the response of SST to the NAO in the subtropical NA reveals a converse change for the east and the west, which is similar to the response of the pCO2sea anomalies to the NAO in this region (Fig. 8). It can be concluded that in the subtropical NA the change of SST is important for the NAO-driven pCO2sea anomalies in summer. It should be noted, however, that in the subtropical NA, SST is also related to biology through the vertical supply of nutrients to drive the change of pCO2sea: when SST is cold, the vertical supply of nutrients is increased, so the biological production is enhanced, which can decrease pCO2sea (Bennington et al., 2009). The biochemical process may also be important for the subpolar NA because of the strong transport of nutrients by the vertical movement. In the subpolar NA north of 50°N, the relationship between pCO2sea and SST shows a negative correlation, indicating that pCO2sea in this region may be mainly controlled by other factors, which is similar to that in winter. Because of the lack of long-term observations of biogeochemical variables such as DIC and total alkalinity, analysis of the mechanisms of the response of the fCO2 in the NA to the NAO is insufficient.
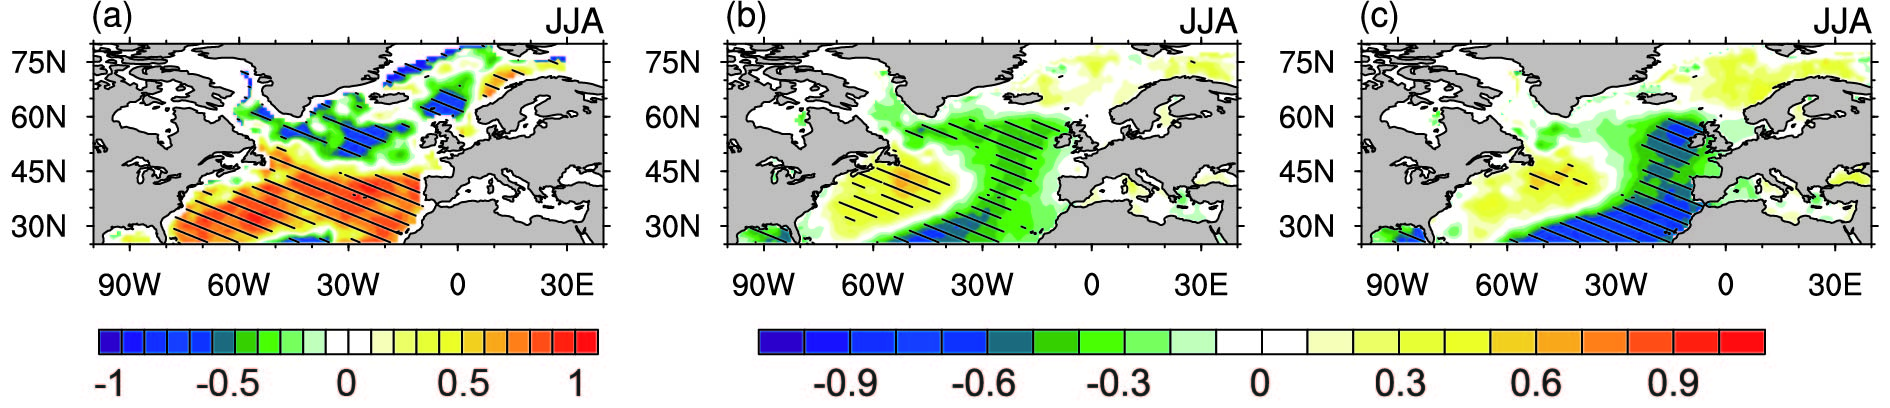 Figure9. Regression coefficients (RCs) of the pCO2sea anomalies against the SST anomalies in summer (a), and RCs of the SST anomalies against NAOGong (b) and NAONCAR (c) in summer. Shaded areas indicate that RCs are significant at the 95% confidence level of the Student’s t-test. The time period for the data ranges from 1983 to 2011.
Another aspect that should be noted is that, because of atmospheric teleconnection, the physical and biogeochemical processes are not only influenced by the local climate change, but also affected by other climate events (e.g., El Ni?o–Southern Oscillation and Pacific Decadal Oscillation), with a significant lagged correlation, besides the NAO (Patra et al., 2005), which should also be investigated in detail in future work.
On the interannual scale, there are some differences in the character of the response of the NA fCO2 to the NAO between winter and summer, which is especially reflected in the subtropical NA. In winter, the fCO2 anomalies in the NA are affected by the NAO-driven vm10 anomalies, which induce a wave-train-like distribution of the RCs of fCO2 anomalies against the NAO along the meridional direction, with pCO2sea having no significant influence on fCO2 except for in the region south of 30°N where the non-NAO-driven SST is the factor controlling the pCO2sea anomalies. There are significant negative RCs between the NAO and pCO2sea in the region of 35°–40°N, and the vm10 effect on fCO2 is larger than the pCO2sea effect. In summer, the fCO2 anomalies are barely affected by the vm10 anomalies, and in the subtropical NA, the NAO-driven SST anomalies dominate the change of the pCO2sea, which further controls the response of fCO2 on the NAO in this season and induces the significant difference between the west and east subtropical NA. In the subpolar NA, the response of fCO2 to the NAO in winter, which is induced by the vm10, is more significant than that in summer, with the variability of fCO2 mainly affected by the non-NAO driven pCO2sea anomalies.
APPENDIX
Acknowledgments. This work was supported jointly by the National Key Research and Development Program of China (Grant No. 2016YFB0200800) and the National Natural Science Foundation of China (Grant No. 41530426). We thank Dr. C. R?denbeck for providing the fCO2 data and for patient answers to our questions about these data.
