HTML
--> --> -->The Tibetan Plateau (TP) has a significant impact on the atmospheric circulation and Asian climate (Wu and Zhang, 1998; Liu et al., 2007; Duan et al., 2008). Convective precipitation is well known as the dominant rain type in summer over the TP, due to its thermotopographic effect (Jiang et al., 1996; Uyeda et al., 2001). Meanwhile, stratiform cloud over the TP (Shimizu et al., 2001; Li et al., 2004) is very important to local climate because of the associated strong cloud feedback (Yu et al., 2004).
Analysis of cloud characteristics and precipitation based on observation data is essential for the development of microphysical parameterization schemes in numerical models. The frequency, intensity, depth, as well as storm-top altitude of convective and stratiform precipitation over the TP have been studied using TRMM precipitation radar (PR) data at the seasonal scale (Houze et al., 2007; Fu et al., 2008, 2012) and diurnal scale (Hu et al., 2010; Pan and Fu, 2015). However, the TRMM product misidentifies weak convective rain events over the TP because the freezing level is close to the surface (Fu and Liu, 2007). Furthermore, owing to data limitation for this topographically complex region, knowledge of convective and stratiform cloud vertical characteristics over the TP before NASA’s launch of CloudSat (Stephens et al., 2002) and CALIPSO (Winker et al., 2007) in 2006, remains insufficient. The measurements from the cloud profile radar onboard CloudSat, which operates at 94 GHz, as well as those from the CALIOP instrument onboard CALIPSO, make it possible to explore cloud internal vertical structures based on active sensors, and the CloudSat/CALIPSO products have proven to be valuable for studying rainfall and thick precipitating clouds (Matrosov, 2007; Heymsfield et al., 2008). Based on CloudSat/CALIPSO datasets, cloud characteristics over the TP have been extensively studied (Luo et al., 2011; Wang et al., 2011b; Rüthrich et al., 2013; Peng et al., 2014; Zhang et al., 2014; Hong and Liu, 2015; Yan et al., 2016), but less so the cloud vertical structures and physical properties under convective or stratiform conditions and their relationships with precipitation.
In this study, based on observational data from CloudSat/CALIPSO and TRMM, we first research the distribution features of convective and stratiform precipitation, before investigating the cloud vertical macro- and microphysical properties, as well as the vertical structures of radiative heating, for convective and stratiform precipitation profiles over the TP by comparison with its neighboring land regions (northern India and south of the TP, which we refer to collectively as NIST) and tropical ocean region (south of the TP, which we refer to as TO), in order to extend our knowledge on the vertical structures and physical properties of convective and stratiform clouds and provide a reference for improving their simulation in numerical models. The definitions of the three areas follows those used in Yan et al. (2016, 2018): TP (27°?40°N, 70°?103°E; altitude: > 3000 m); NIST (20°?27°N, 70°?103°E); TO (20°S?20°N, 60°?150°E; over ocean only).
The paper is organized as follows: Section 2 describes the data and methods. Section 3 presents the results on the distribution of convective and stratiform precipitation, the cloud vertical macro- and microphysical properties, and the vertical structures of radiative heating. Section 4 summarizes the study’s conclusions and offers some further discussion.
2.1. Data
Five datasets representing cloud properties obtained from the CloudSat and CALIPSO satellites flying in a sun-synchronous orbit and overpassing the equator at 1330 or 0130 local time are used in this study, including the 2B-CLDCLASS-LIDAR (Sassen and Wang, 2008; Wang et al., 2012), 2B-GEOPROF-LIDAR (Mace et al., 2007), 2B-FLXHR-LIDAR (Henderson et al., 2011), 2B-GEOPROF (Mace, 2007) and 2B-CWC-RO (Austin, 2007) products. The period of coverage for all these datasets is from 1 January 2007 to 31 December 2010. The 2B-CLDCLASS-LIDAR product classifies each cloud profile into one of eight cloud types (cumulus, stratocumulus, stratus, altocumulus, altostratus, nimbostratus, cirrus, and deep convective clouds). The 2B-GEOPROF-LIDAR product provides the cloud fraction, which is defined as the fraction of lidar volumes in a radar resolution volume that contains hydrometeors. The 2B-FLXHR-LIDAR product provides upwelling and downwelling longwave (LW) and shortwave (SW) flux, as well as heating rates at discrete levels of the atmosphere in profiles. The 2B-GEOPROF product provides radar echoes from hydrometeors, and produces an estimate of the radar reflectivity factor and cloud mask. The 2B-CWC-RO product retrieves estimates of cloud water content, particle effective radius, and number concentration in liquid or ice phase. A detailed description of these products can be downloaded from http://www.cloudsat.cira.colostate.edu/data-products/level-2b.Together with the CloudSat/CALIPSO datasets, we also use the same period of three-hourly precipitation data from TRMM 3B42, version 6 (Huffman et al., 2007), which has a horizontal resolution of 0.25° × 0.25°, to calculate the relationships between cloud vertical structures and precipitation.
2
2.2. Methods
Based on the cloud classification product from 2B-CLDCLASS-LIDAR, we first determine each cloudy profile (the “cloud type” value at any layer is between 2 and 8) as convective or stratiform. The steps are as follows: (1) If any “cloud type” in a profile equals 8, which represents “Deep Convection”, the profile is regarded as convective, and if any “cloud type” value equals 7, which represents “Nimbostratus Cloud”, the profile is regarded as stratiform, since they are the dominant cloud types of convective and stratiform precipitation, respectively. (2) Otherwise, if any “cloud type” is equals to 6, which represents “Cumulus”, it is regarded as convective, and for any “cloud type” between 2 and 5, which represent altostratus, altocumulus, stratus and stratocumulus, respectively, it is regarded as stratiform. This method makes each cloudy profile subordinate to a unique category. Since cirrus is a special cloud type that contributes little to precipitation but does contribute to total cloud thickness and cloud top height, it is not assigned in this study.Spatiotemporal matching between the TRMM and CloudSat/CALIPSO data is necessary to study the relationships between precipitation and cloud features. In this study, the sorting method to match the cloud information from the CloudSat/CALIPSO orbital data and the precipitation from the TRMM grid data is similar to that used by Yan et al. (2016, 2018): the seeking of TRMM precipitation in the spatial range of 12.5 km and within 1.5 hours of the location of the cloud profile. In other words, once a cloud profile is identified as convective or stratiform, we seek the matching TRMM 3B42 precipitation grid data that are nearest to the location of the cloudy profile within 1.5 hours, and the cloud and precipitation are regarded as near synchronous. It should be noted that the CloudSat/CALIPSO products used here are all from original orbital profiles and only cloudy profiles (determined as convective or stratiform cloudy profiles no matter whether precipitation happens) are diagnosed.
The cloud fraction provided by 2B-GEOPROF-LIDAR is defined as the fraction of lidar volumes in a radar range resolution volume (RRV; 1.3 km in the cross-track direction, 1.1 km in the along-track direction, and 0.24 km in the vertical direction) that contains hydrometeors (Mace et al., 2007). The definition of cloud amount for each RRV in this study is as follows: the cloud amount is set to 100% for a cloud mask of 20?40 and reflectivity greater than ?30 dBZ. Otherwise, the cloud amount equals the cloud fraction provided by 2B-GEOPROF-LIDAR for a cloud mask of 6?10 or 0 and reflectivity greater than ?30 dBZ. It should be noted that the cloud amount in this study is 3D, with horizontal and vertical dimensions, since the CloudSat/CALIPSO satellites have the ability to penetrate thick clouds and provide cloud information in each vertical level, which is different from the traditional 2D cloud amount representing the percentage of clouds occupying the sky in the field of horizontal view and without vertical information.
Following Yan et al. (2018), 26 precipitation rate bins from 0 mm d?1 to 260 mm d?1 at 10 mm d?1 intervals, and 1 bin greater than 260 mm d?1, are used in this study. Note that the units of mm d?1 do not mean the daily cumulative amount, but an instantaneous intensity converted from mm h?1.
We also use the joint probability distribution function (PDF) and normalized contoured frequency by altitude diagram (CFAD) to analyze the vertical properties of cloud microphysics, which are methods that have been used in previous studies (Luo et al., 2009; Zhang et al., 2014). The heights in this study are all above sea surface.
3.1. Distribution of convective and stratiform precipitation
Figure 1 illustrates the average monthly precipitation intensity of convective and stratiform clouds. It can be seen that convective precipitation is significantly stronger than stratiform precipitation almost all year round over the three regions, with the former being about twofold greater than that of the latter. Similar to the monthly mean precipitation (as shown by dark bars), convective and stratiform precipitation reach a maximum in the warm season over the TP and NIST, while they are strong throughout the year over the TO. However, even in summer when abundant water vapor is transported to the TP with the outbreak of the Asian summer monsoon (Xu et al., 2008; Yan et al., 2016), both the convective and stratiform precipitation rate over the TP are relatively small (< 0.2 mm h?1) compared with the other two regions (> 0.6 mm h?1), which is related to the lack of water supply, lower convective available potential energy (Luo et al., 2011), and larger vertical wind shear over the TP (Xu, 2013).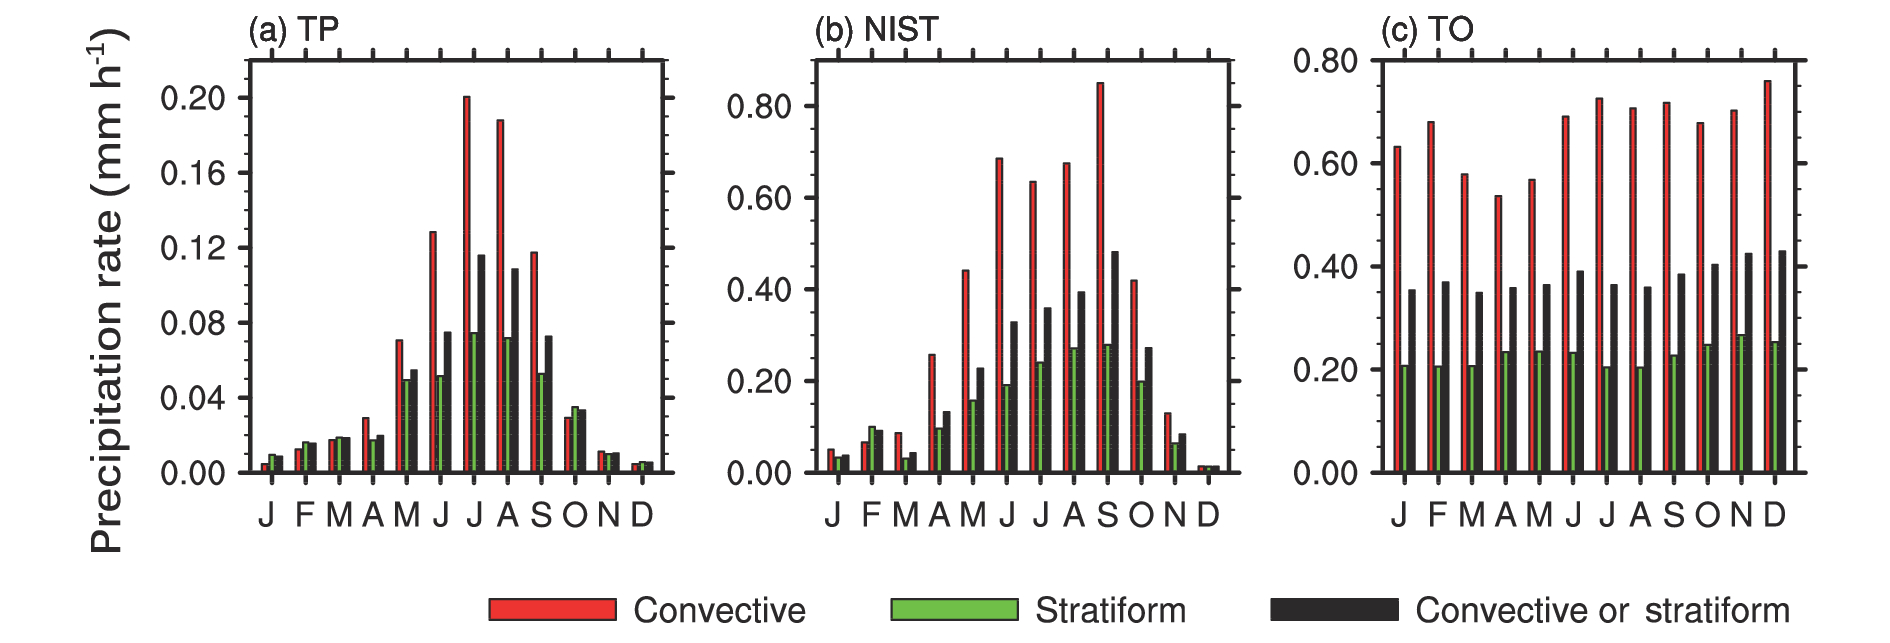 Figure1. Monthly mean precipitation intensity of convective clouds, stratiform clouds and convective clouds or stratiform clouds in rain and no-rain conditions over the (a) TP, (b) NIST, and (c) TO. J to D in x-axis stand for calendar month January to December.
The spatial patterns of the seasonal precipitation intensity produced by convective and stratiform clouds [Fig. S1 in electronic supplementary material (ESM)] can provide more insights into the regional variations. Although the climatic characteristics of convective and stratiform precipitation in the tropics and subtropics have been analyzed based on TRMM PR datasets by previous researchers (Fu et al., 2003, 2016; Liu et al., 2013), the results revealed here are more reliable because the cloudy profiles with no corresponding precipitation are included in the diagnosis, based on a combination of CloudSat/CALIPSO and TRMM datasets; depending solely on TRMM data is less reliable because of the minimum sensitivity of the PR (0.4 mm h?1) (Schumacher and Houze, 2003). The average precipitation intensity caused by convective clouds over most tropical and subtropical areas is far larger than that caused by stratiform clouds. Moreover, the average spatial distribution of precipitation caused by convective clouds is very uneven and shows intense seasonal variation. Besides, it is also indicated that the average precipitation intensity caused by both convective and stratiform clouds over the TP and its southern neighboring regions reaches a maximum in boreal summer compared with other regions. Therefore, in the following sections, only the primary rainfall season, boreal summer (June?August), is focused on to investigate the vertical features of both two types of cloud and their corresponding precipitation.
2
3.2. Cloud vertical macrophysical structures of convective and stratiform precipitation
The PDFs of cloud top height and precipitation intensity (Fig. 2), as well as the total cloud thickness (with the clear-sky thickness between adjacent cloud layers deducted) and precipitation intensity (Fig. 3) show the cloud vertical expansion range and its occurrence frequency at different precipitation intensities. Over the TO region, the cloud top height of convective precipitation mostly lies below 8 km or between 15 km and 17 km when precipitation is less than 50 mm d?1 (Fig. 2c), corresponding to two prone ranges of total cloud thickness, which are thinner than 6 km or thicker than 14 km but thinner than 16 km (Fig. 3c). Meanwhile, the two prone ranges of cloud top height (Fig. 2b) and total cloud thickness (Fig. 3b) are not separated obviously over NIST. When precipitation enhances (> 50 mm d?1), the precipitation cloud top height and total cloud thickness are more inclined to be 15?17 km (Fig. 2c) and 14?16 km (Fig. 3c) over the TO, respectively. While obviously different features are shown for the stratiform precipitation clouds (Figs. 2f and 3f), the frequency of cloud top height is distributed more evenly below 18 km, and the occurrence of rain rates greater than 30 mm d?1 is less frequent compared with that of convective precipitation clouds. Figure2. Joint PDFs of (a?c) convective precipitation intensity and cloud top height and (d?f) stratiform precipitation intensity and total cloud top height, in summer (June?July?August), over the (a, d) TP, (b, e) NIST and (c, f) TO regions.
 Figure3. Joint PDFs of (a?c) convective precipitation intensity and total cloud thickness and (d?f) stratiform precipitation intensity and total cloud thickness, in summer (June?July?August), over the (a, d) TP, (b, e) NIST, and (c, f) TO regions.
In contrast to the TO region, the characteristics of cloud top height and total cloud thickness for convective and stratiform precipitation clouds over the TP show similar features. The most prone cloud top height for both two types of precipitation lies between 4 and 17 km (Figs. 2a and d), and the most prone total cloud thickness is less than 10 km (Figs. 3a and d). Compared with other regions, the comparable cloud top height over the TP and the compression effect of the topography on cloud thickness revealed by CloudSat/CALOPSO in this study are consistent with those from TRMM PR measurements (Fu et al., 2008). A precipitation intensity greater than 25 mm d?1 and precipitating clouds with a vertical expansion thicker than 12 km seldom occur for both types of precipitation over the TP (Figs. 3a and d) compared with the other two regions (Figs. 3b, c, e and f), possibly because of the weaker instability, lower level of neutral buoyancy, and drier atmosphere (Luo et al., 2011; Li and Zhang, 2016), besides the high terrain over the TP. The convective and stratiform precipitation clouds over the TP have similarly less vertical expansion, indicating that the TP’s topography has a suppression effect on the precipitation intensity and cloud vertical expansion of both cloud types.
Figure 4, for both cloud types, shows the spatial pattern of total thickness and cloud top height for all cases with or without precipitation in summer. The cloud top height of both cloud types over the TP (about 10 km) is higher than that of its neighboring regions (around 7 km) (Figs. 4b and d), and is even comparable with that over the eastern of Bay of Bengal, where the highest cloud top height is located over the TO region, illustrating the uplift effect of the TP’s topography on the cloud top height. However, from the spatial distribution of cloud total thickness (Figs. 4a and c), the clouds’ vertical expansion over the TP (about 3.8 km for convective clouds and 2.4 km for stratiform clouds) is obviously thinner than that in the Asian summer monsoon regions (can be thicker than 7 km for convective clouds and 5 km for stratiform clouds). Therefore, in spite of the uplift effect on the cloud top height for both cloud types, their actual vertical ranges are still compressed over the TP. Besides, the convective clouds over the eastern of Bay of Bengal and the western Pacific in the TO region have lower cloud top height (Figs. 4b and d) but thicker vertical expansion (Figs. 4a and c) than stratiform clouds, if the existence of cirrus is not considered. Meanwhile, it is quite different over the TP, with convective clouds having a slightly higher cloud top and thicker vertical expansion than stratiform clouds. In short, compared with other regions, the TP has an obvious uplift effect on cloud top height, but a compression effect on cloud vertical expansion, especially for convective clouds.
 Figure4. Spatial pattern of averaged (a, c) total cloud thickness and (b, d) cloud top height for (a, b) convective clouds and (c, d) stratiform clouds in summer (June?July?August). The three black boxes from top to bottom represent the TP, NIST and TO regions in each plot. Units: km.
Although the convective and stratiform cloud amount in the whole column is large, it increases as precipitation intensity enhances among the three regions (Fig. S2 in the ESM). A notable feature over the TP is that the cloud amount in the whole column, for both cloud types, reaches 100% when the precipitation intensity is greater than 150 mm d?1 (Figs. S2a and d in the ESM), demonstrating that clouds corresponding to extremely heavy convective and stratiform precipitation are denser than in other regions. Although the cloud amount defined in an RRV is closely related to the CloudSat scanning area, the cloud amount revealed in this study can represent the climatic characteristics of the whole TP because of the basically uniform distribution of the samples as plotted by Yan et al. (2016).
2
3.3. Cloud vertical microphysical structures of convective and stratiform precipitation
Taking into account that the presence of precipitation causes large uncertainty in liquid water inversion (Austin, 2007) for the 2B-CWC-RO product, the features of liquid microphysics for convective and stratiform clouds are not given.Figure 5 shows the normalized CFAD of cloud ice microphysics for convective clouds in no-rain conditions. The cloud ice water is mainly concentrated within the altitudes of 5?10 km with a larger variational range of cloud ice water content (e2?e6 mg m?3) (Fig. 5a) and effective radius (30?140 μm) (Fig. 5g) over the TP; whereas, the maximum probability of cloud ice water content is within 6?14 km (Fig. 5b) over NIST and 10?14 km over the TO (Fig. 5c) with a relatively smaller effective radius (40?80 μm) (Fig. 5i), indicating that the ice water in convective clouds over the TP is distributed at a lower level but contains a larger range of particle sizes, which is related to the thinner cloud thickness over the TP as revealed in section 3.2. In addition, large number concentrations (> 400 L?1) of ice particles are less likely to occur in upper layers of the troposphere (> 10 km) over the TP (Fig. 5d), while moderate values of ice number concentration (< 300 L?1) occur more frequently in the range of 4?14 km compared with the other regions, as shown by the yellow or deeper colors in Figs. 5d?f. Therefore, for the convective profiles with no precipitation, the TP has obviously different cloud microphysical features compared with its neighboring land and ocean regions, including a lower altitude where ice water is located, a wider range of ice particle sizes, and a lower probability of larger ice number concentrations (> 400 L?1).
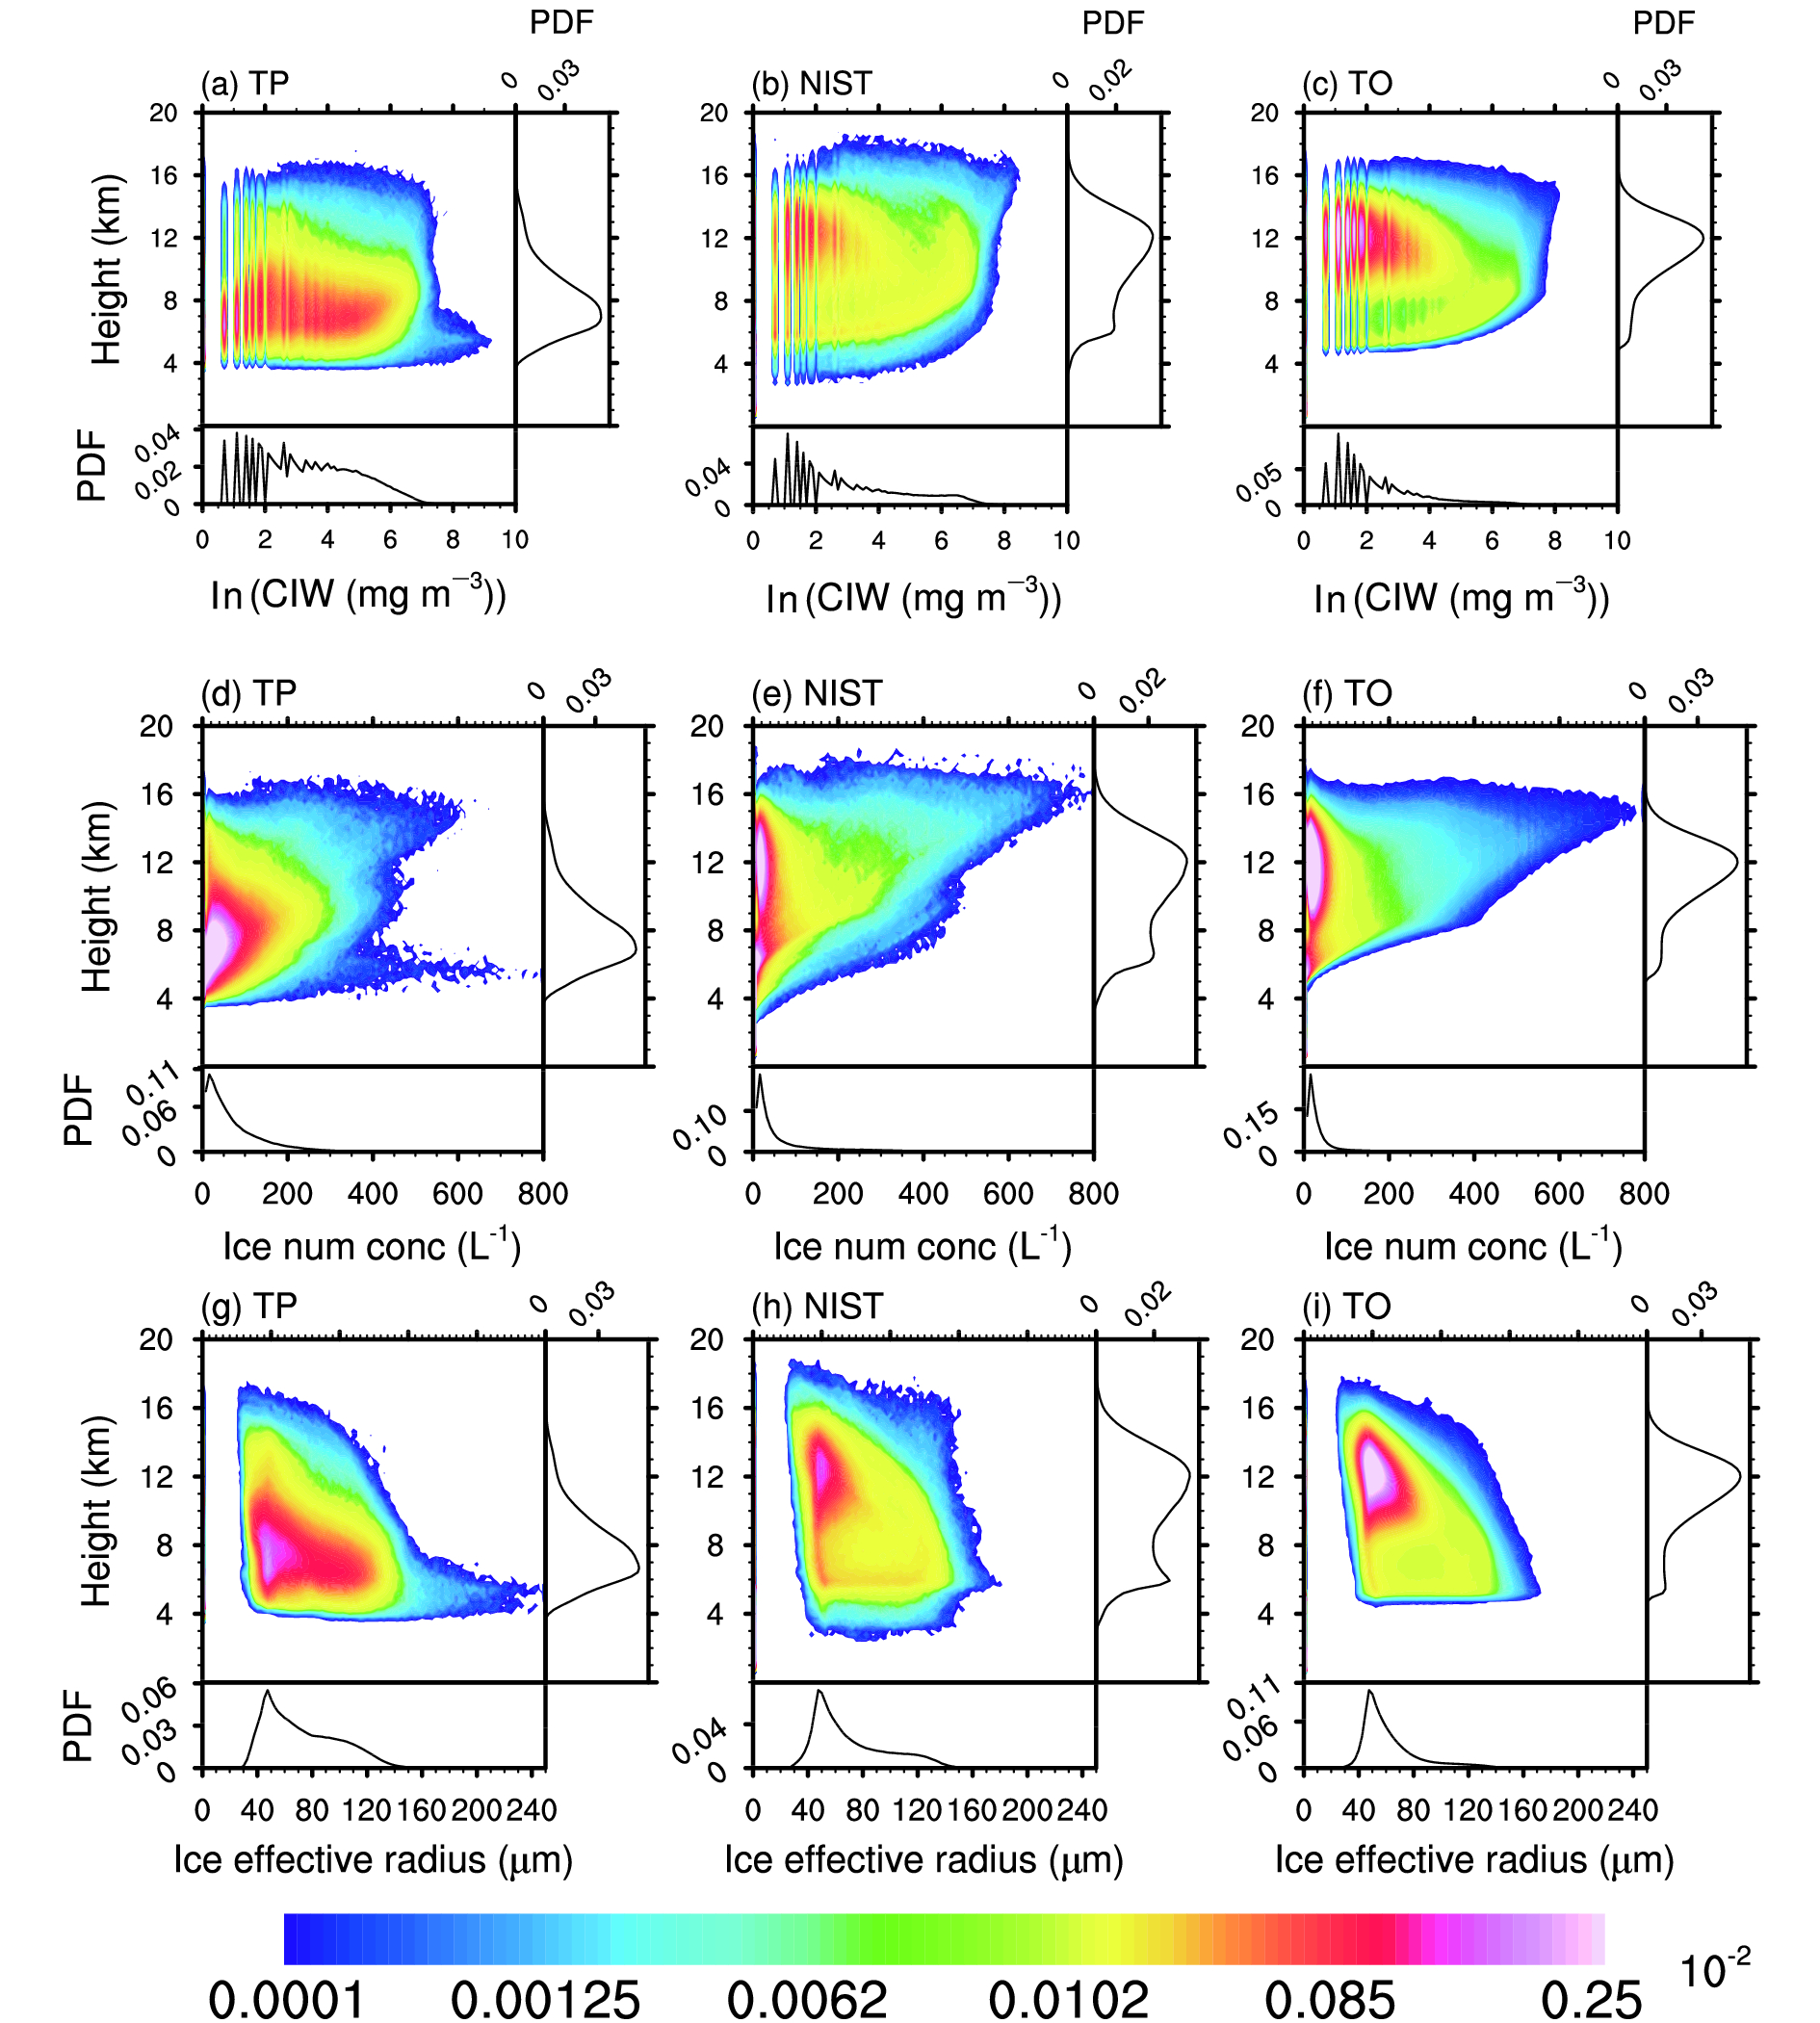 Figure5. Normalized CFADs (color shades) of (a?c) natural logarithm of cloud ice water content (CIW, unit: mg m?3), (d?f) number concentration, and (g?i) effective radius over the (a, d, g) TP, (b, e, h) NIST and (c, f, i) TO regions for convective cloud in no-rain conditions in summer. The x-axis bin for (a?c) is 0.1 (the corresponding value of ice water content is e0.1 mg m?3), for (d?f) it is 8 L?1, and for (g?i) it is 2.5 μm. The y-axis bin for all plots is 240 m. The curve on the right-hand side of each plot is the PDF of different altitudes. The curve at the bottom of each plot is the PDF of different variable values. There are 123 924, 83 276 and 998 349 profiles over the TP, NIST and TO regions, respectively
For stratiform profiles in no-rain conditions (Fig. 6), the maximum frequency of cloud ice water over the TP still lies within 5?10 km (Fig. 6a), which is consistent with that of convective clouds. However, a large ice number concentration in the whole column (Fig. 6d) and large ice particle sizes (> 120 μm) below 8 km (Fig. 6g) over the TP, are not prone to appear for stratiform non-precipitation profiles.
 Figure6. As in Fig. 5 but for stratiform cloud in no-rain conditions. There are 305 398, 240 993 and 2 396 601 profiles over the TP, NIST and TO regions, respectively.
When precipitation occurs, the microphysics values corresponding to the maximum spectral distribution of both two types of cloud are inclined to increase with an increase in rainfall intensity. Taking rainstorms or larger-magnitude precipitation (>50 mm d?1) as an example (Figs. 7 and 8), the order of dominant cloud ice water content is nearly e6 mg m?3 (Fig. 7a) and e4.5 mg m?3 (Fig. 8a) over the TP for convective and stratiform precipitation profiles, respectively, while they are e4 mg m?3 (Fig. 5a) and less than e2 mg m?3 (Fig. 6a) in no-rain conditions, as displayed by the curve’s peak on the bottom-hand side of each plot. The ice number concentrations above 9 km are more prone to be 200 L?1 for convective precipitation profiles over the TP (Fig. 7d), which is much smaller than in the other regions (Figs. 7e and f). In summer, due to high temperatures, precipitation over the TP mainly occurs in the form of rainfall. Even though liquid particles are not considered, the lower ice particle number concentration in convective clouds is consistent with the lower raindrop number concentration for convective precipitation in summer over the TP, as revealed by Wu and Liu (2017). For stratiform precipitation profiles, ice clouds are more inclined to gather at moderate concentrations (< 200 L?1). Compared with wider ranges of ice particle size in no-rain conditions (Figs. 5g?i and 6g?i), the spectrum of cloud ice effective radius narrows throughout the whole column and displays a remarkable decreasing trend with increased altitude (Figs. 7g?i and 8g?i) for both cloud types. However, it is quite an apparent feature that there are many more large-sized particles (> 120 μm) in the layer between 5 and 10 km in convective precipitation profiles, as shown by the red or deep-color shades and the curve peaks on the bottom-hand sides of Figs. 7g?i, while for stratiform precipitation profiles there are more small-sized ice particles (40?80 μm) located within 10?16 km (Figs. 8g?i). The unique features of the vertical microphysics over the TP include a wider spectrum of cloud ice water content, ice number concentration, and ice particle effective radius for both cloud types, in contrast to a relative narrow spectrum over the NIST and the TO (as shown by the red or deep-color shades in each plot).
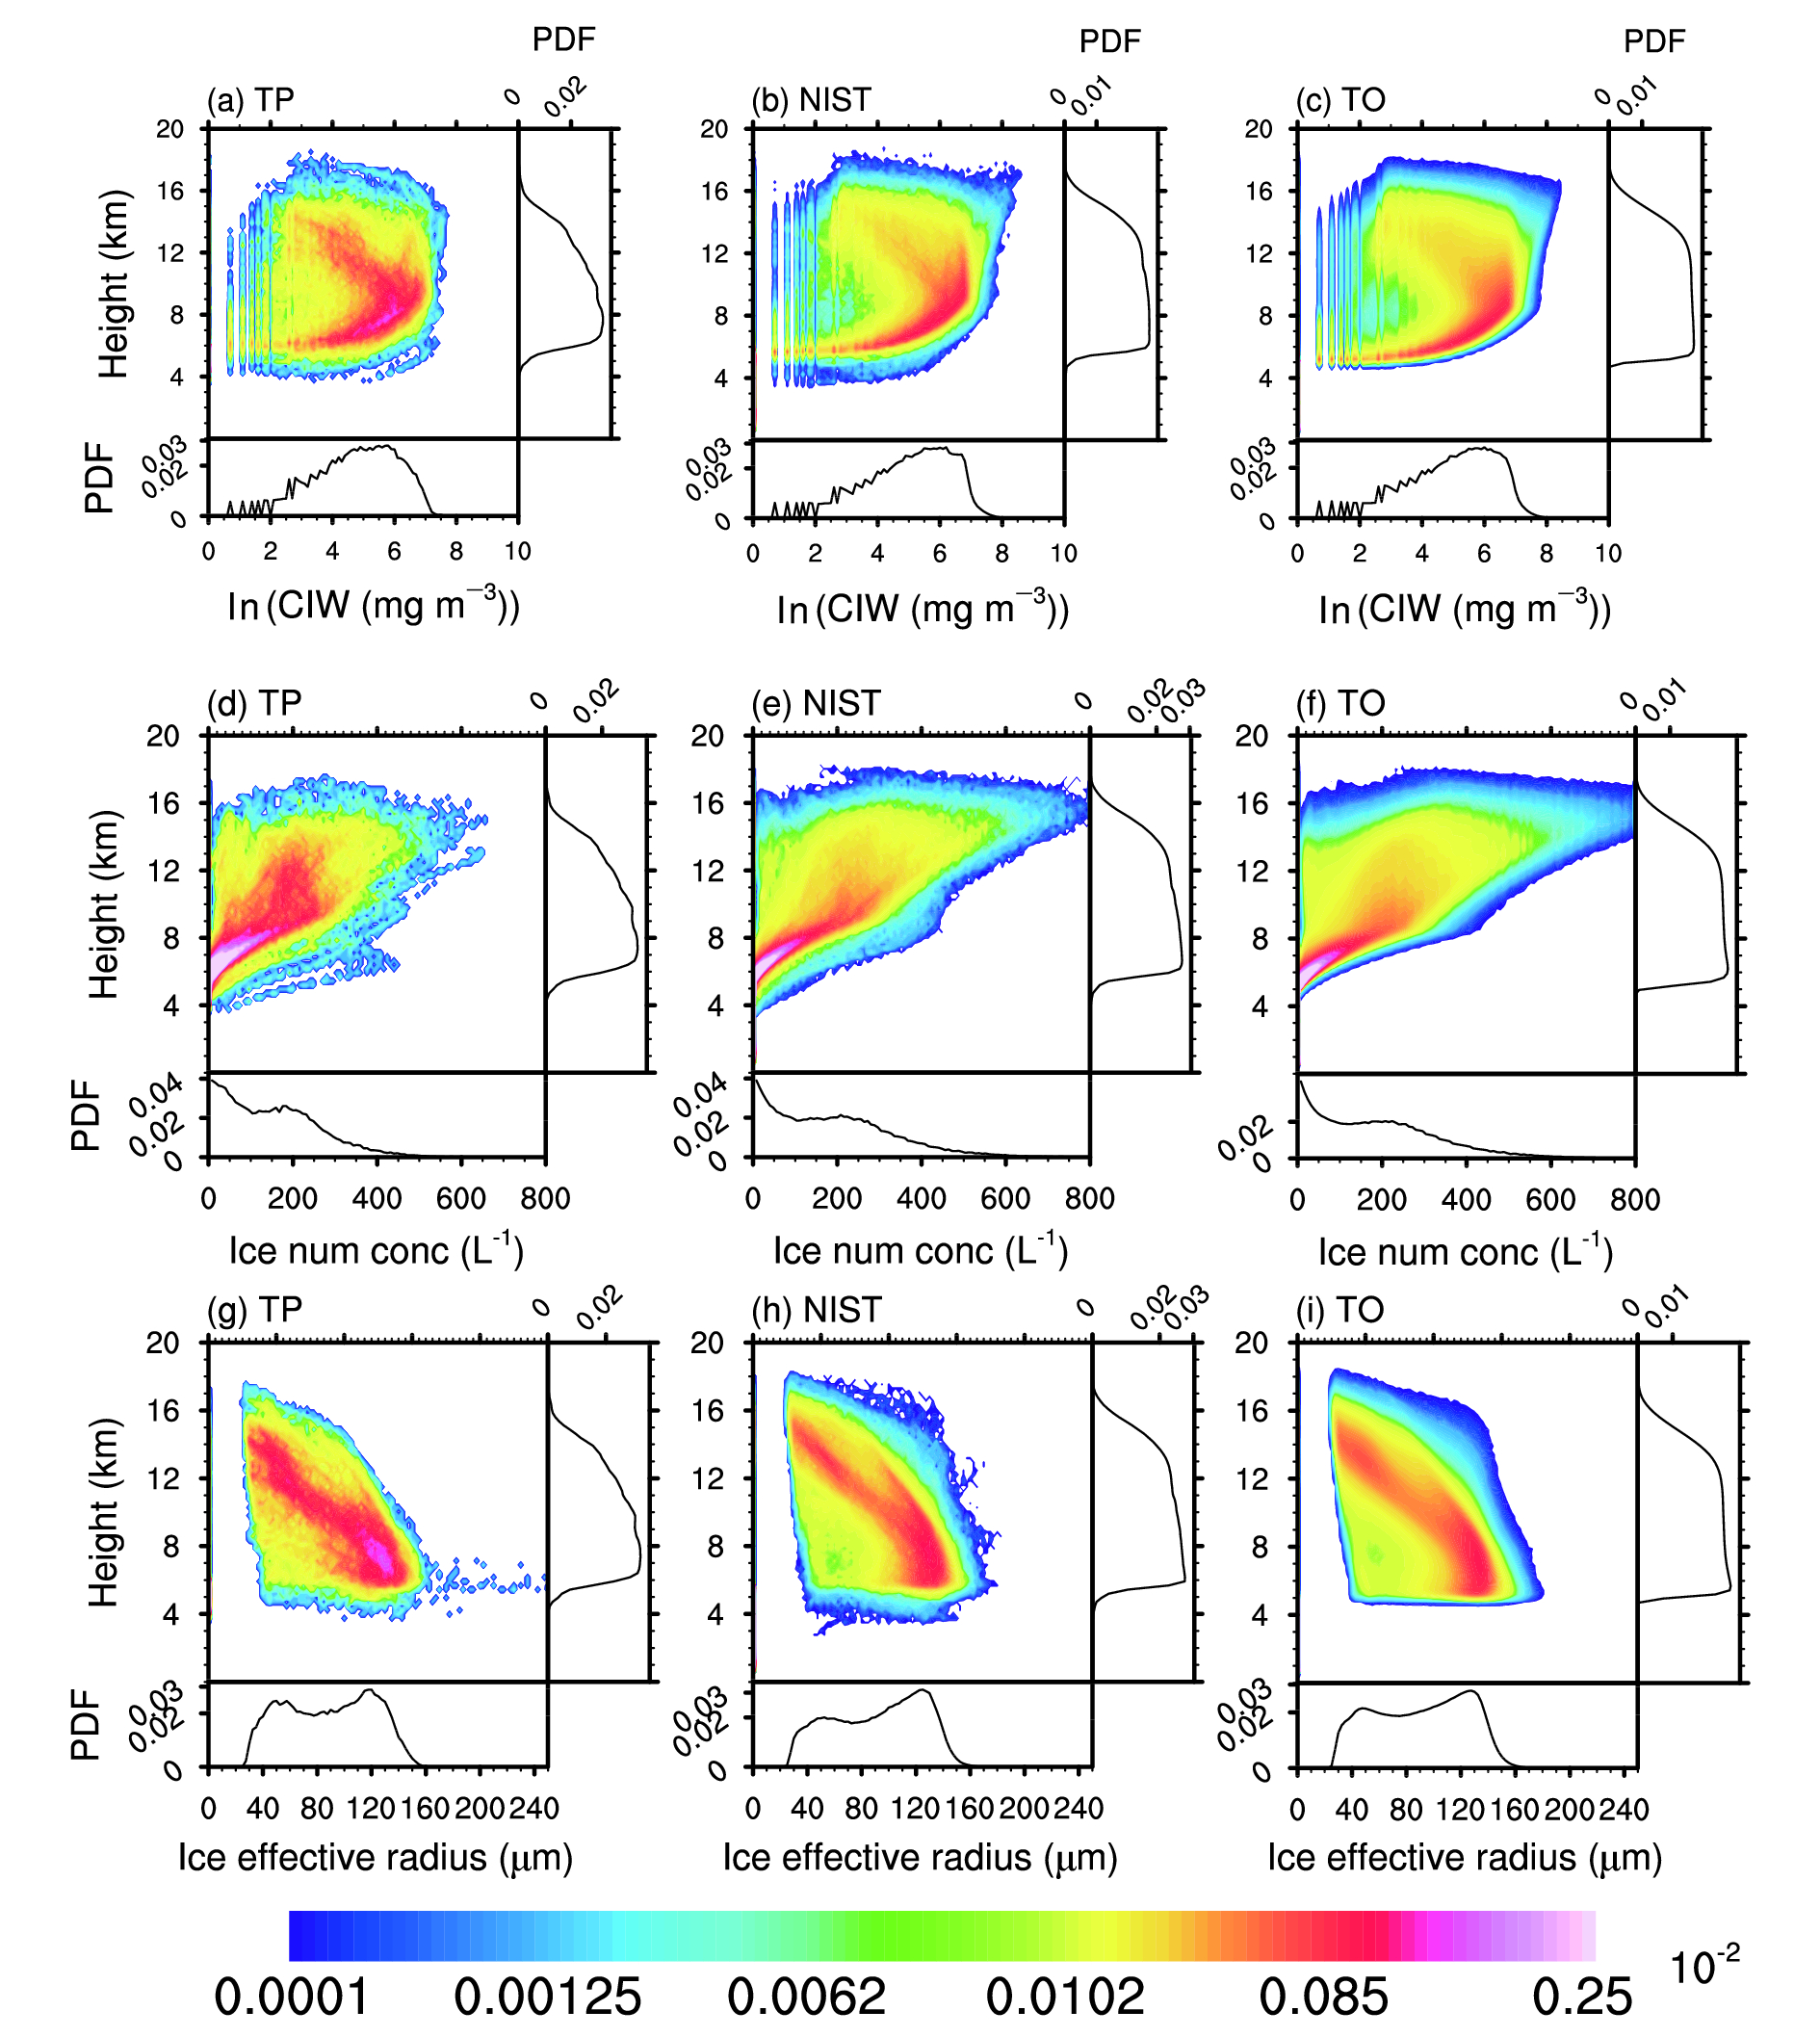 Figure7. As in Fig. 5 but for convective cloud in rainstorm or larger-magnitude rain conditions (> 50 mm d?1). There are 3205, 11 182 and 152 397 profiles over the TP, NIST and TO regions, respectively.
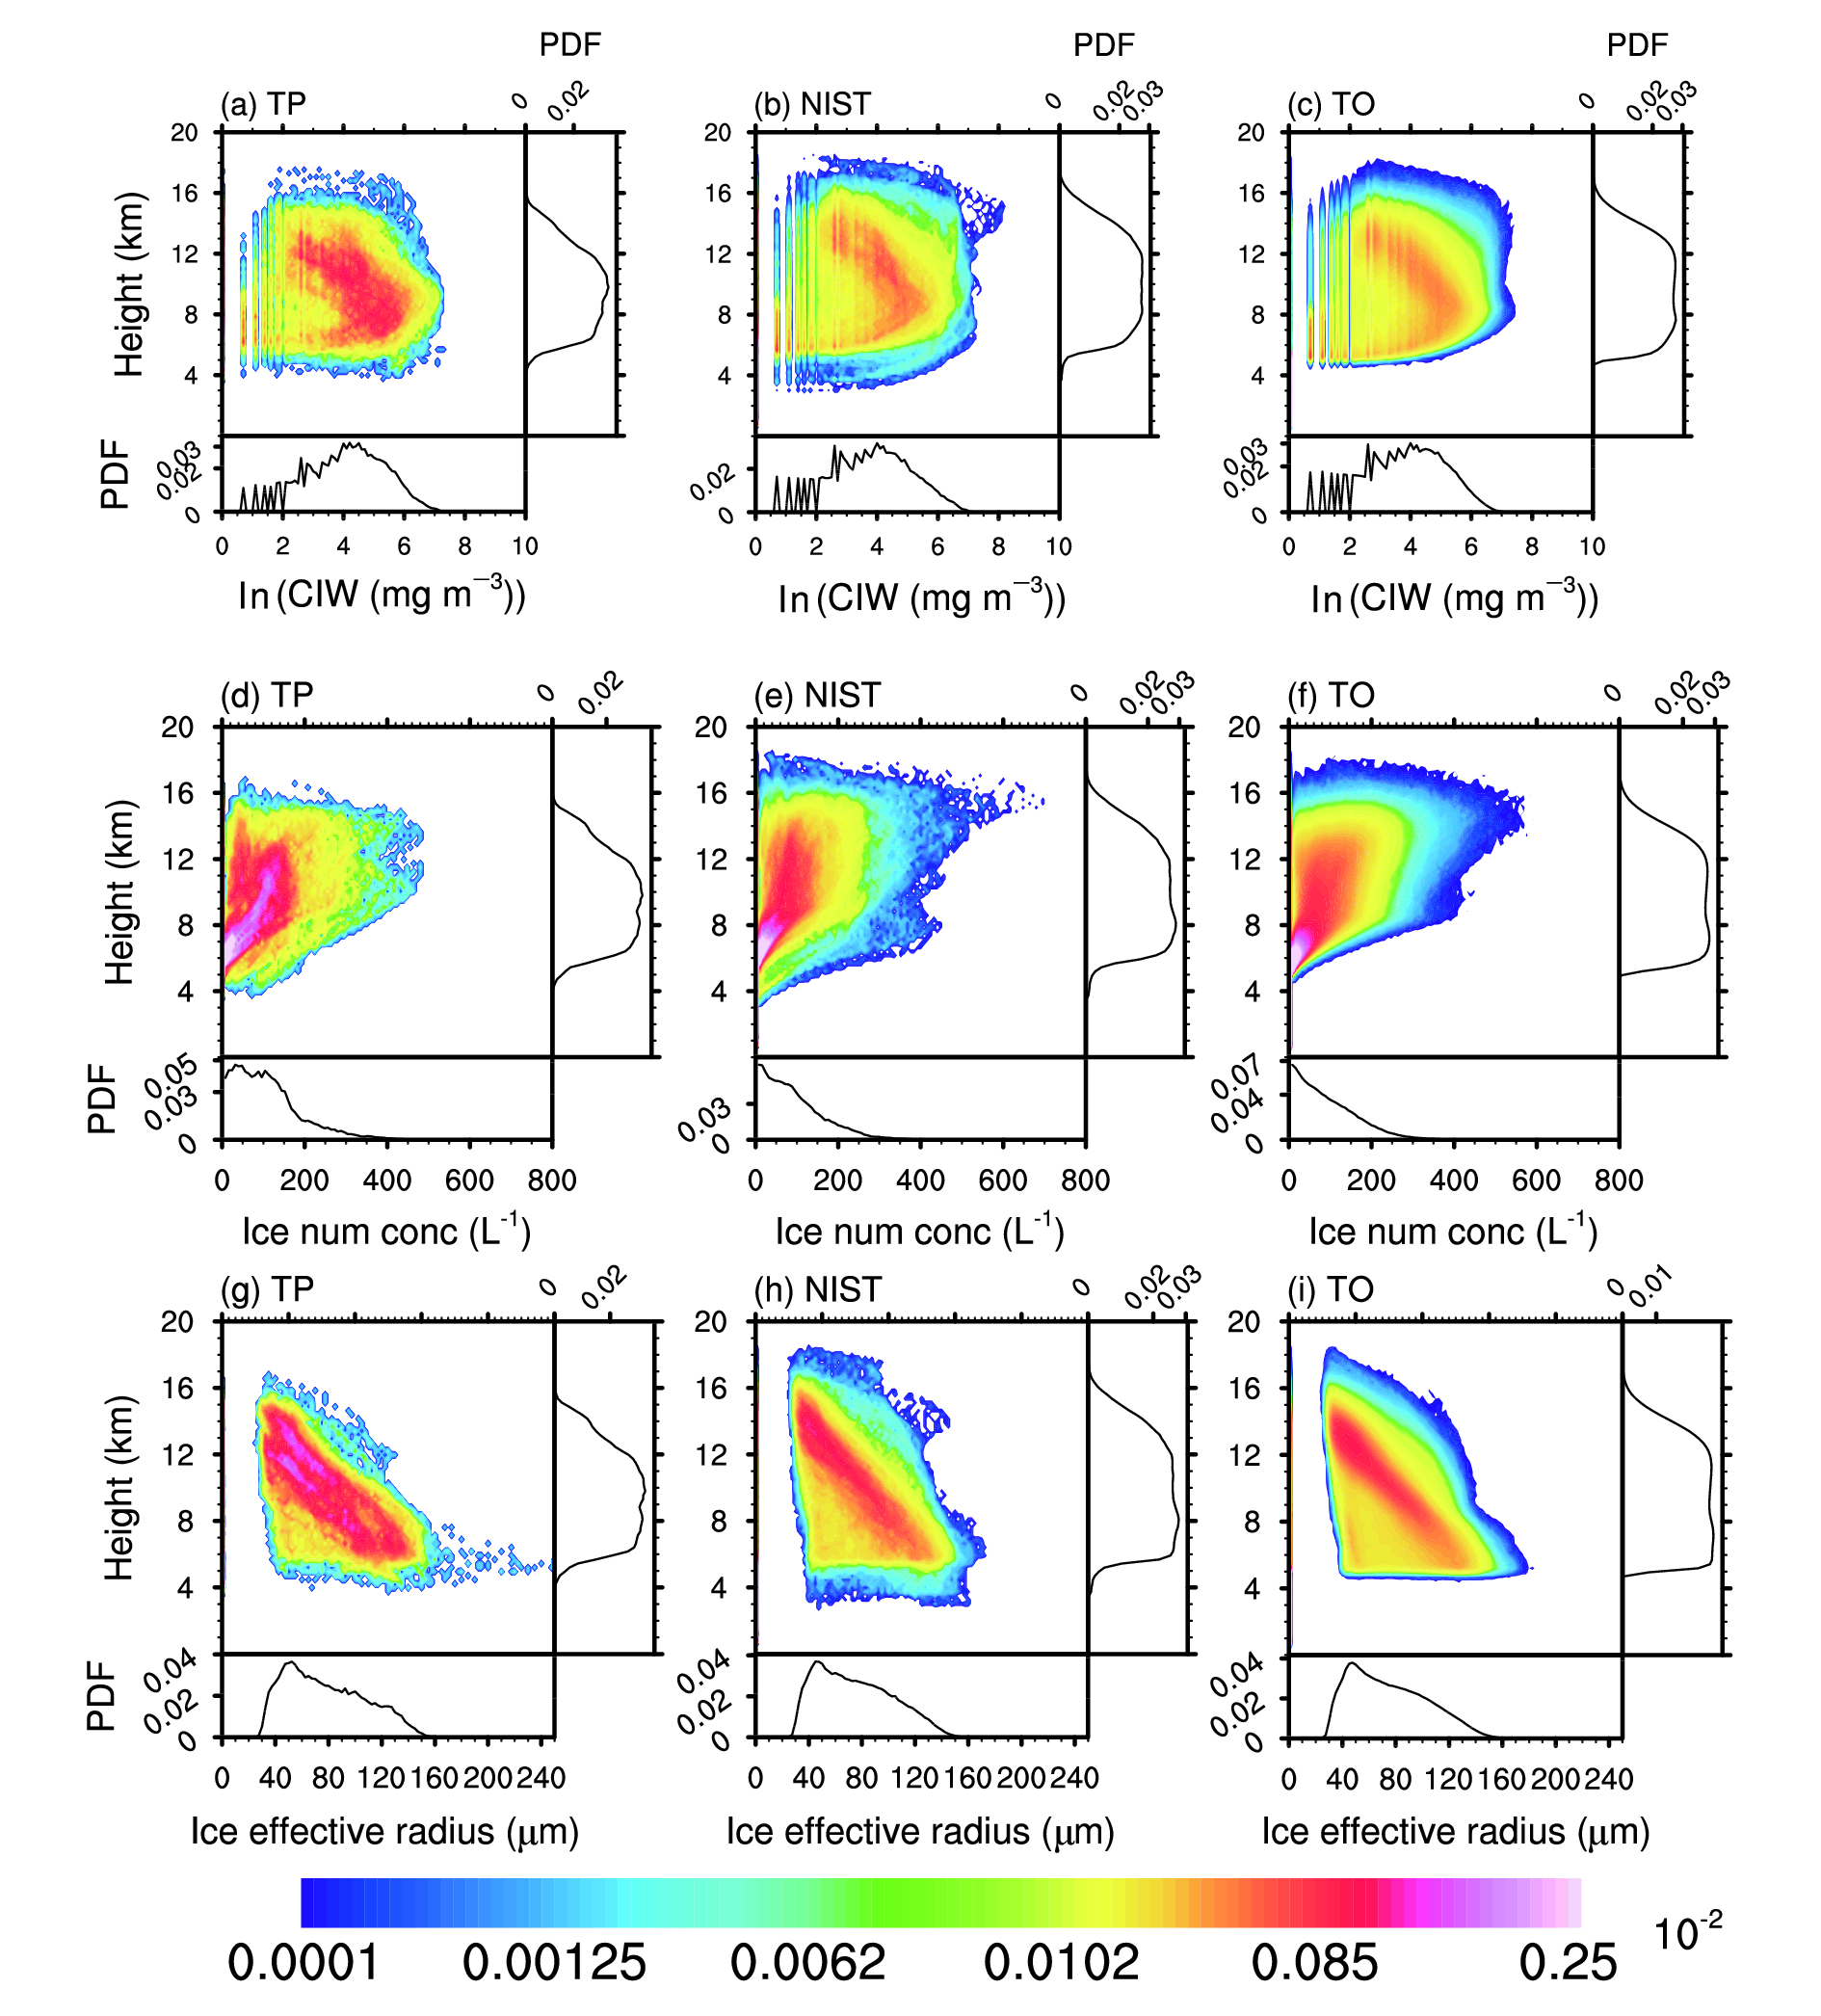 Figure8. As in Fig. 5 but for stratiform cloud in rainstorm or larger-magnitude rain conditions (> 50 mm d?1). There are 2019, 9628 and 83 944 profiles over the TP, NIST and TO regions, respectively.
2
3.4. Atmospheric radiative heating rate of convective and stratiform profiles
The vertical macro- and microphysical structures of convective and stratiform clouds result in different vertical distributions of atmospheric radiative heating rate. Figures 9 and 10 show the profiles of atmospheric SW and LW radiative heating rate under different precipitation intensities for both cloud types in the three aforementioned regions. Figure9. Vertical structure of atmospheric SW radiative heating rate in different precipitation intensities for (a?c) convective and (d?f) stratiform profiles in summer (June?July?August) over the (a, d) TP, (b, e) NIST and (c, f) TO regions, respectively.
 Figure10. Vertical structure of atmospheric LW radiative heating rate in different precipitation intensities for (a?c) convective and (d?f) stratiform profiles in summer (June?July?August) over the (a, d) TP, (b, e) NIST and (c, f) TO regions.
It is a common feature among the three regions that the clouds’ SW radiation heats the atmosphere almost throughout the whole column. The maximum SW heating rate in convective profiles over the NIST and the TO is between 12 km and 18 km (Figs. 9b and c), wherein the cloud top height is located (Figs. 2b and c), while it is mainly between 8 km and 16 km (Fig. 9a) over the TP and lower than those over NIST and the TO. The maximum SW heating rate enhances with increased precipitation intensity and the maximum SW heating in convective profiles is greater than 4 K d?1 among the three regions (Figs. 9a?c), which is typically stronger than that in stratiform profiles (Figs. 9d?f). In contrast to SW radiation, the LW radiation mainly cools the atmosphere, especially in upper layers (> 10 km), as shown in Fig. 10. However, the cooling layer (9?16 km, where cooling rate is > 2.5 K d?1) over the TP is distinctly thicker than that of the other regions (concentrated within 12?17 km) when the rainfall rate of both cloud types is less than 100 mm d?1. The two LW heating layers (due to absorbing energy from the sea surface or clouds), located from the ground to 6 km and 7?9 km, respectively, are divided by a shallow cooling layer near 6 km, wherein the melting layer is located. The LW heating rates of the two LW heating layers are obviously stronger in convective profiles than stratiform profiles. The uplifted surface LW cooling layer due to the high terrain and the comparable height of the melting layer make the two heating layers closer over the TP than in the other regions, reflecting a greater inhomogeneity of the LW vertical radiative heating profiles over the TP. The inhomogeneity of the profiles may have effects on local atmospheric circulation, which needs to be studied further.
The almost opposite SW and LW radiative heating rates in the two cloud types’ profiles are not cancelled out totally for the net radiative heating rate. Instead, the atmosphere below 16 km over the TO is cooled because of the stronger outwardly LW radiation of both convective and stratiform clouds when there is low precipitation (< 10 mm d?1), as revealed by Figs. S3c and f. As precipitation increases, the heating effects of SW radiation are reflected, making a net warming atmospheric layer below 12 km but a net cooling layer above 14 km owing to the strong LW cooling rate there. It is noted that the clear melting layer near 5?6 km above the sea surface over the TO corresponds to a shallow net cooling layer. Even though these signals are quite noisy over the TP, as revealed by Figs. S3a and d, it is a common feature that the net heating layer is typically compressed over the TP for the profiles of both cloud types, and the net atmospheric radiative heating or cooling rate in convective precipitation profiles is stronger than that of stratiform profiles, which is related to the many more ice particles with large sizes and large number concentrations in convective precipitation profiles.
(1) The convective precipitation intensity is twice as strong as that of stratiform precipitation. However, they are smaller over the TP than its neighboring land and ocean regions, even in summer, due to the restrictions placed by the high topography on the water vapor supply.
(2) Compared with the other regions, the vertical macrophysical structures of convective and stratiform clouds have similar features over the TP. The cloud vertical expansion and the range of cloud top height for both convective and stratiform clouds are compressed over the TP. However, the average cloud top height is uplifted obviously on the TP if taking the precipitation and non-precipitation clouds as a whole.
(3) For non-precipitation clouds, both convective and stratiform clouds have lower altitudes (5?10 km) where ice water is distributed and a wider range of particle sizes, but a lower probability of a larger ice number concentration over the TP compared with the other regions. When precipitation enhances, the microphysical structures for both clouds over the TP show similar features to the other regions, and convective clouds contain quite more ice water, denser particles, and ice particles larger in size than stratiform clouds.
(4) The atmospheric SW heating (LW cooling) rate enhances with increased precipitation, and it is stronger in convective profiles than stratiform profiles. When the rainfall rate is less than 100 mm d?1, the LW cooling layer for the precipitation of both cloud types over the TP is thicker and more inhomogeneous than in the other regions. The net heating layer is typically compressed over the TP for the profiles of both cloud types.
The results revealed in this study enhance our understanding of the relationships between the vertical structures of these two main cloud types (convective and stratiform) and precipitation over the TP, which is useful for improving the simulation of convective and stratiform vertical structures, as well as precipitation, in climate models. However, owing to the limitations of the CloudSat/CALIPSO sampling times (around 0130 and 1330 local time) and the increased uncertainty of cloud radar retrievals with enhanced radar reflectivity, the cloud vertical structures for heavy rain conditions may need to be verified using other datasets.
Acknowledgments. The authors greatly appreciate the constructive suggestions made by Prof. Jianhua Lü from the School of Atmospheric Sciences, Sun Yat-Sen University, China, which certainly improved the manuscript. The authors are also sincerely grateful to the anonymous reviewers for their professional and careful comments on the manuscript. This work was jointly supported by the National Natural Science Foundation of China (Grant Nos. 91437219, 91637312 and 91637101), the Key Research Program of Frontier Sciences, Chinese Academy of Sciences (Grant No. QYZDY-SSW-DQC018). The CloudSat/CALIPSO data were obtained from the CloudSat Data Processing Center (http://www.cloudsat.cira.colostate.edu/order-data) funded by NASA’s CloudSat project, and the TRMM data were obtained from NASA’s Goddard Space Flight Center (https://pmm.nasa.gov/data-access/downloads/trmm).
Electronic supplementary material. Supplementary material is available in the online version of this article at https://doi.org/10.1007/s00376-019-8229-4.
 FigureS1. Seasonally averaged spatial pattern of precipitation intensity by (a?d) convective clouds, (e?h) stratiform clouds, and (i?l) convective or stratiform clouds in rain and no-rain conditions. The red boxes in (i) represent the TP, NIST and TO regions used in this study. Units: mm h?1.
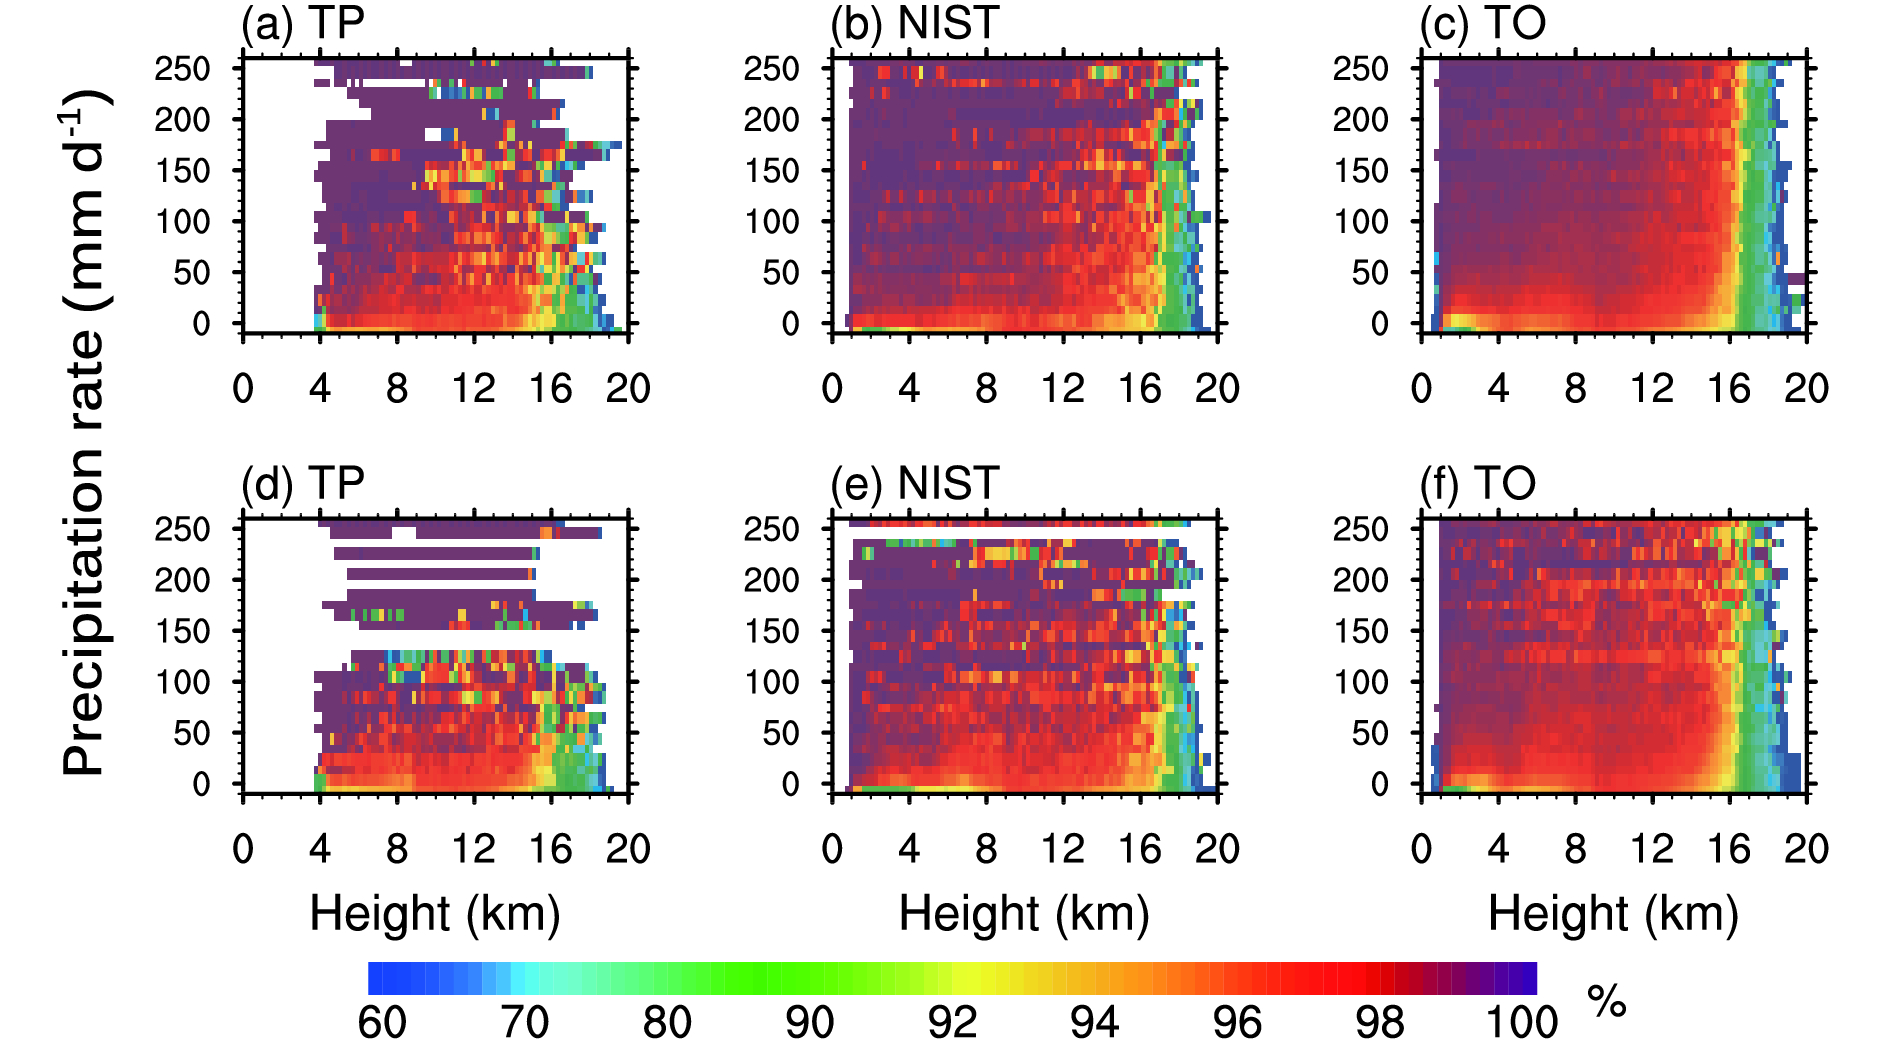 FigureS2. Average vertical distribution of cloud amount in different (a?c) convective precipitation intensities and (d?f) stratiform precipitation intensities in summer (June?July?August) over the (a, d) TP, (b, e) NIST and (c, f) TO regions.
 FigureS3. Vertical structure of atmospheric net (SW+LW) radiative heating rate in different precipitation intensities for (a?c) convective and (d?f) stratiform profiles in summer (June?July?August) over the (a, d) TP, (b, e) NIST and (c, f) TO regions.
Electronic Supplementary Material to: Vertical Structures of Convective and Stratiform Clouds in Boreal Summer over the Tibetan Plateau and Its Neighboring Regions*
Yafei YAN1,2 and Yimin LIU1,3
1State Key Laboratory of Numerical Modeling for Atmospheric Sciences and Geophysical Fluid Dynamics, Institute of Atmospheric Physics, Chinese Academy of Sciences, Beijing 100029, China2Shanghai Meteorological Bureau, Shanghai 200030, China3University of Chinese Academy of Sciences, Beijing 100049, China
ESM to: Yan, Y. F., and Y. M. Liu, 2019: Vertical structures of convective and stratiform clouds in boreal summer over theTibetan Plateau and its neighboring regions. Adv. Atmos. Sci., 36(10), 1089–1102, https://doi.org/10.1007/s00376-019-8229-4.
