HTML
--> --> -->Most of these studies highlighted the energy dispersion routes of different wavenumbers and the cross-equatorial propagation characteristics for stationary Rossby waves, but neglected to investigate the wave energy variations along the energy dispersion routes. Hoskins and Karoly (1981) analyzed the variations in the amplitudes along wave rays by directly applying the wave action conservation equation derived by Bretherton and Garrett (1969). They pointed out the inverse proportional relationship between the wave amplitude and the square root of the meridional wavenumber. Li and Nathan (1994) also derived an inverse proportional relationship by introducing a damping coefficient. However, they only calculated the variation in wave amplitudes and did not discuss the wave energy. Both wave amplitudes and wave energy vary in the energy dispersion process and are important to understand the development of Rossby waves (Lu and Zeng, 1981). Chen and Chao (1983) pointed out that a leading (trailing) Rossby wave will develop to the south (north) of the westerly jet in the barotropic atmosphere, as was also observed by Lu and Zeng (1981) with a different method. Recently, Kang and Li (2016) attempted to discuss the development of Rossby waves by calculating the wave energy along wave ray paths. However, their discussion was very inadequate. For example, they did not compare the wave energy with the wave amplitude variation, and they did not expound the behaviors of the wave ray, wave amplitude and wave energy along the ray path.
In addition, the variations in the amplitudes and energy of nonstationary waves have rarely been discussed due to the difficulty in directly solving the divergence of the group velocity. Although Li and Nathan (1994) analytically expressed amplitudes as a function of latitude, their analytic solution is valid only when considering damping, which would mean that the energy of the barotropic system is no longer conserved. Furthermore, Rossby waves might develop significantly if both the amplitudes and the wave energy exceed a critical value in the propagation process (Lu and Zeng, 1981). Therefore, it is necessary to calculate both the amplitudes and the wave energy in the energy dispersion process. In this paper, we investigate the variations in amplitudes and wave energy along the energy dispersion routes of nonstationary Rossby waves.
The remainder of this paper is organized as follows: The dispersion relationship and hence wave ray theory for barotropic Rossby waves are introduced in section 2. Some useful inferences are also discussed. The energy dispersion behavior (the variations in the wave energy and the amplitudes along the wave ray) in a westerly jet prototype background with the meridional gradient of absolute vorticity larger than zero is analyzed in section 3.1. The situation involving a similar westerly jet but with a meridional gradient of absolute vorticity smaller than zero at certain latitudes is analyzed and discussed in section 3.2. The results for the observed zonal basic flow are investigated in section 3.3. Lastly, the conclusions and discussion are presented in section 4.
where


where


The dispersion relationship for the wave-form solution

where k, l, and ω are the zonal wavenumber, meridional wavenumber, and circular frequency, respectively. According to Eq. (3), the meridional propagation of Rossby waves requires
where


When

This means that


On the other hand, the latitude where


In this case, it is clear that the wave energy dispersion path, represented by the wave ray, would not propagate across the entire sphere but would be restricted to a limited region surrounded by critical lines, by turning latitudes, or by both a critical line and a turning latitude. Based on different combinations of critical lines and turning latitudes, we conclude that there are three types of wave energy dispersion regions. The first type is surrounded by two critical lines; the second type is surrounded by a critical line and a turning latitude; and the third type is surrounded by two turning latitudes. It should be noted that Yang and Hoskins (1996) already mentioned these three types of propagation regions. However, they did not carefully analyze the variations in the wave energy and the amplitudes along the wave rays in these types of propagation regions, which will be highlighted and discussed explicitly in this paper.
Now let us examine another important latitude where


According to Eq. (3), the group velocity can be derived as
where

where


According to Bretherton and Garrett (1969), the wave action conservation equation is
where


Following the group velocity, the individual variability of the wave energy is
Equation (10) demonstrates that the individual variability of the wave energy along a ray is determined by two factors. The first one, represented by the divergence of the group velocity, denotes the concentration or dispersion of the energy. If the wave energy is concentrated along its dispersion path, the wave energy will increase. According to Liu and Liu (2011),
Therefore, the second one, represented by the product of the wave scale and the gradient of the basic flow, denotes the barotropic energy budget of the wave. If it is larger than zero, the wave extracts barotropic energy from the basic flow by eddy activities, which leads to an increase in the wave energy.
Equation (10) provides a method to calculate the variations in the wave energy and hence the amplitude along a ray and distinguishes the effects of the energy concentration or dispersion and the wave energy budget from the basic flow on the wave energy. It has explicit physical meaning, although it is non-conservative. Therefore, it is more suitable to apply the wave energy equation. However, Eq. (10) cannot be directly integrated along a ray by utilizing the group velocity expression in Eq. (6) because the group velocity values neighboring the wave ray are unknown (Lighthill, 1978). Therefore, it is hard to calculate


where the subscript t denotes time and


A developing Rossby wave may be accompanied by increasing wave energy or amplitude, or both. Then, how to define a developing Rossby wave becomes a real question. Here, we adopt the definition by Lu and Zeng (1981), who pointed out that a perturbation develops only if both its energy and amplitude increase. Compared with the criteria that highlight either the wave energy or the amplitude, it is a strict one. They made such a definition based on two reasons. One is that, although the wave energy is increasing, it is dispatched into larger areas due to larger horizontal scale (e.g., longer wavelength). This leads to a decrease in the amplitude. In such a case, the wave is not significant and even decays a little. The other one is that, although the amplitude is increasing, the wave energy is decreasing. Of course, as they suggested, the concentration of the wave energy in a small local region can also make significant transient local synoptic phenomena. This is of interest too. Since a developing Rossby wave is defined by both an increase in the wave energy and the amplitude, a decaying wave is defined by both a decrease in the wave energy and the amplitude.
where the coefficients


2
3.1. Westerly jet with ${\beta _{\rm{M}}}$
larger than zero
By setting u0=15 m s?1, 


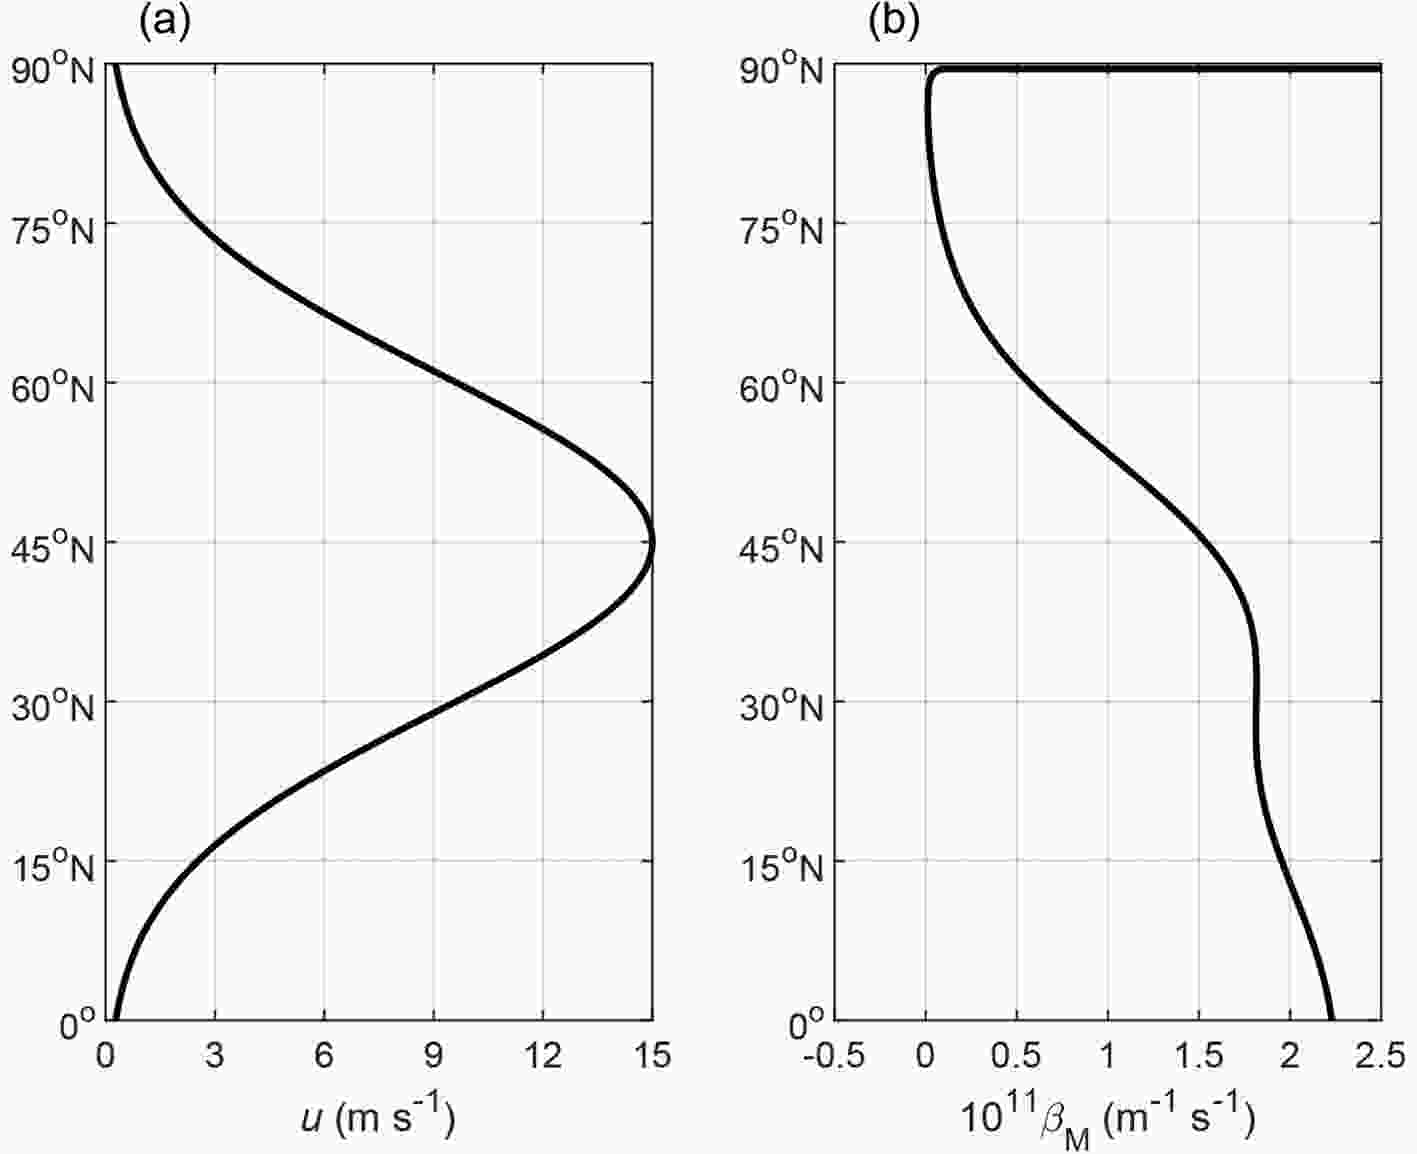 Figure1. Distribution of the (a) westerly jet and (b) meridional gradient of the potential vorticity
For Rossby waves at the synoptic scale, the corresponding wavelength is on the order of 1000 km. Here, we set the zonal wavenumber to k= 8 (the corresponding wavelength is approximately 3500 km at 45°N). The areas where the wave energy can propagate present certain behaviors with different wave periods (Fig. 2a). For a very short period (T= 2 d), wave propagation is restricted to a narrow strip, which is very close to the North Pole. The northern boundary of this narrow strip is the turning latitude denoted by the solid line, while the southern boundary is the critical line denoted by the dash-dotted line. On one hand, the westerly is very weak near the North Pole. On the other hand, a two-day wave period is too short for Rossby waves at the synoptic scale. Therefore, this narrow strip is a mathematical solution without physical meaning. For a longer period of T = 5 d, this mathematical narrow strip moves equatorward. Besides, two extra bands appear south of the strip. The northern band is situated at 70.2°?71.9°N (too narrow to be a physical solution), while the southern band is located at 30.6°?45.2°N. Both bands are surrounded by both a turning latitude and a critical line. For a longer period (T = 10 d), the expanding southern band moves equatorward to 22.2°?37.7°N, while the northern band and the narrow strip disappear. This situation is similar for the case in which the period is longer than 10 days.
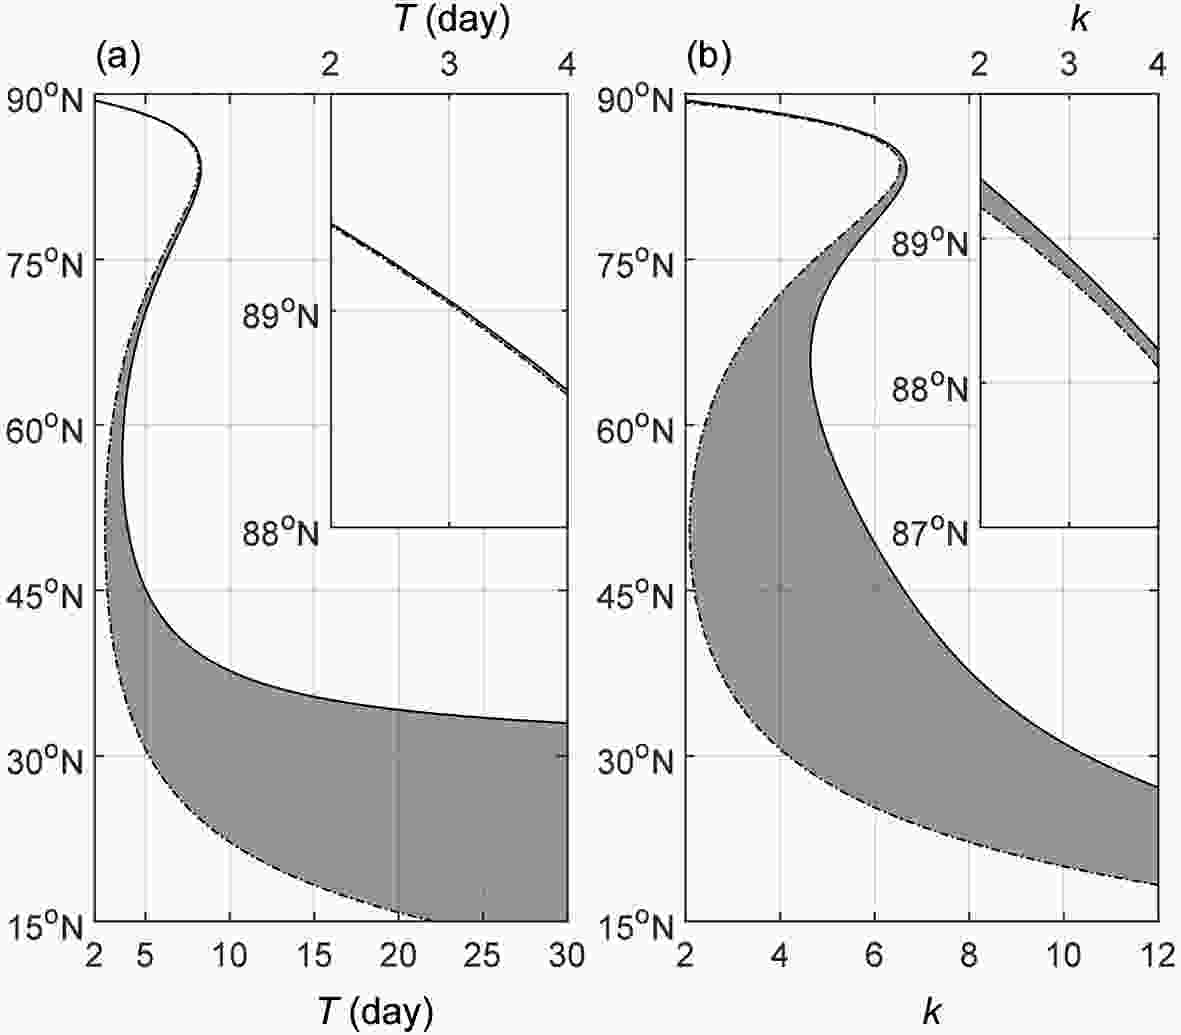 Figure2. Energy dispersion regions (shaded) enclosed by a turning latitude (solid line) and by a critical line (dash-dotted line): (a) for zonal wavenumber k = 8; (b) for a period of T = 10 d.
The time scale of a synoptic Rossby wave is on the order of approximately 10 days. Figure 2b further portrays the variation in the propagating areas with the zonal wavenumber from 2 to 12, featuring planetary- to large-scale Rossby waves with fixing the wave period to T = 10 d. For a small wavenumber k = 2 (corresponding wavelength is approximately 1.4 × 10⁷ km, planetary scale), the propagating area is limited to a narrow band, which is very close to the North Pole, and this solution has no physical meaning. It suggests that planetary-scale Rossby waves with wavelengths larger than 1.4 × 10⁷ km cannot propagate on the sphere with a 10-day period. For a larger wavenumber of k = 4 (corresponding wavelength is approximately 0.7 × 10⁷ km, planetary scale), the narrow strip moves equatorward. In addition, south of the narrow strip, there exists a wider band at 30.6°?71.9°N. This wider band is surrounded by two critical lines. For a larger wavenumber of k = 8 (synoptic scale), the wider band narrows and moves equatorward to 22.2°?37.7°N, while the narrow strip near the North Pole disappears. The situation is similar for the case where k > 8.
We further calculate the wave energy and the amplitudes along the rays by specifying k = 8 and T = 10 d. The leading wave source (initial l > 0, and here the term leading wave is defined by kl> 0) is set at point (0°, 23°N), which is close to the critical line (22.2°N), while the trailing wave source (initial l < 0, and here the term trailing is defined by kl < 0) is set at point (0°, 37°N), which is close to the turning latitude (37.7°N). Within 20 integral days, the leading ray (Fig. 3a) propagates northward and is reflected by the turning latitude to become a trailing wave. Along the leading ray, the wave energy (solid line in Fig. 3b) increases to a maximum value when the ray is arriving at 30°N at around 8.4 days, and decreases a little when the ray arrives at the turning point at around 10.4 days. After that, the wave energy increases again to the same maximum value at around 12.4 days, and then decreases to close to the initial value at 20 days. Although the wave energy decreases when the ray tends to the turning latitude, the extent to which it decreases is smaller than the extent of increase caused by the enlarging horizontal scale (decreasing total wavenumber K, shown by the dotted line in Fig. 3b). Therefore, the amplitude continuously increases to a maximum value of around 10.9 times at the turning latitude (dash-dotted line). The above variations along the ray suggests that the wave energy (solid line in Fig. 3c) increases and then decreases against the latitude while the amplitude (dash-dotted line in Fig. 3c) monotonically increases against the latitude, which is consistent with previous studies that stated that the poleward increase in amplitude is inversely proportional to the square root of the absolute meridional wavenumber (e.g., Hoskins and Karoly, 1981; Li and Nathan, 1994).
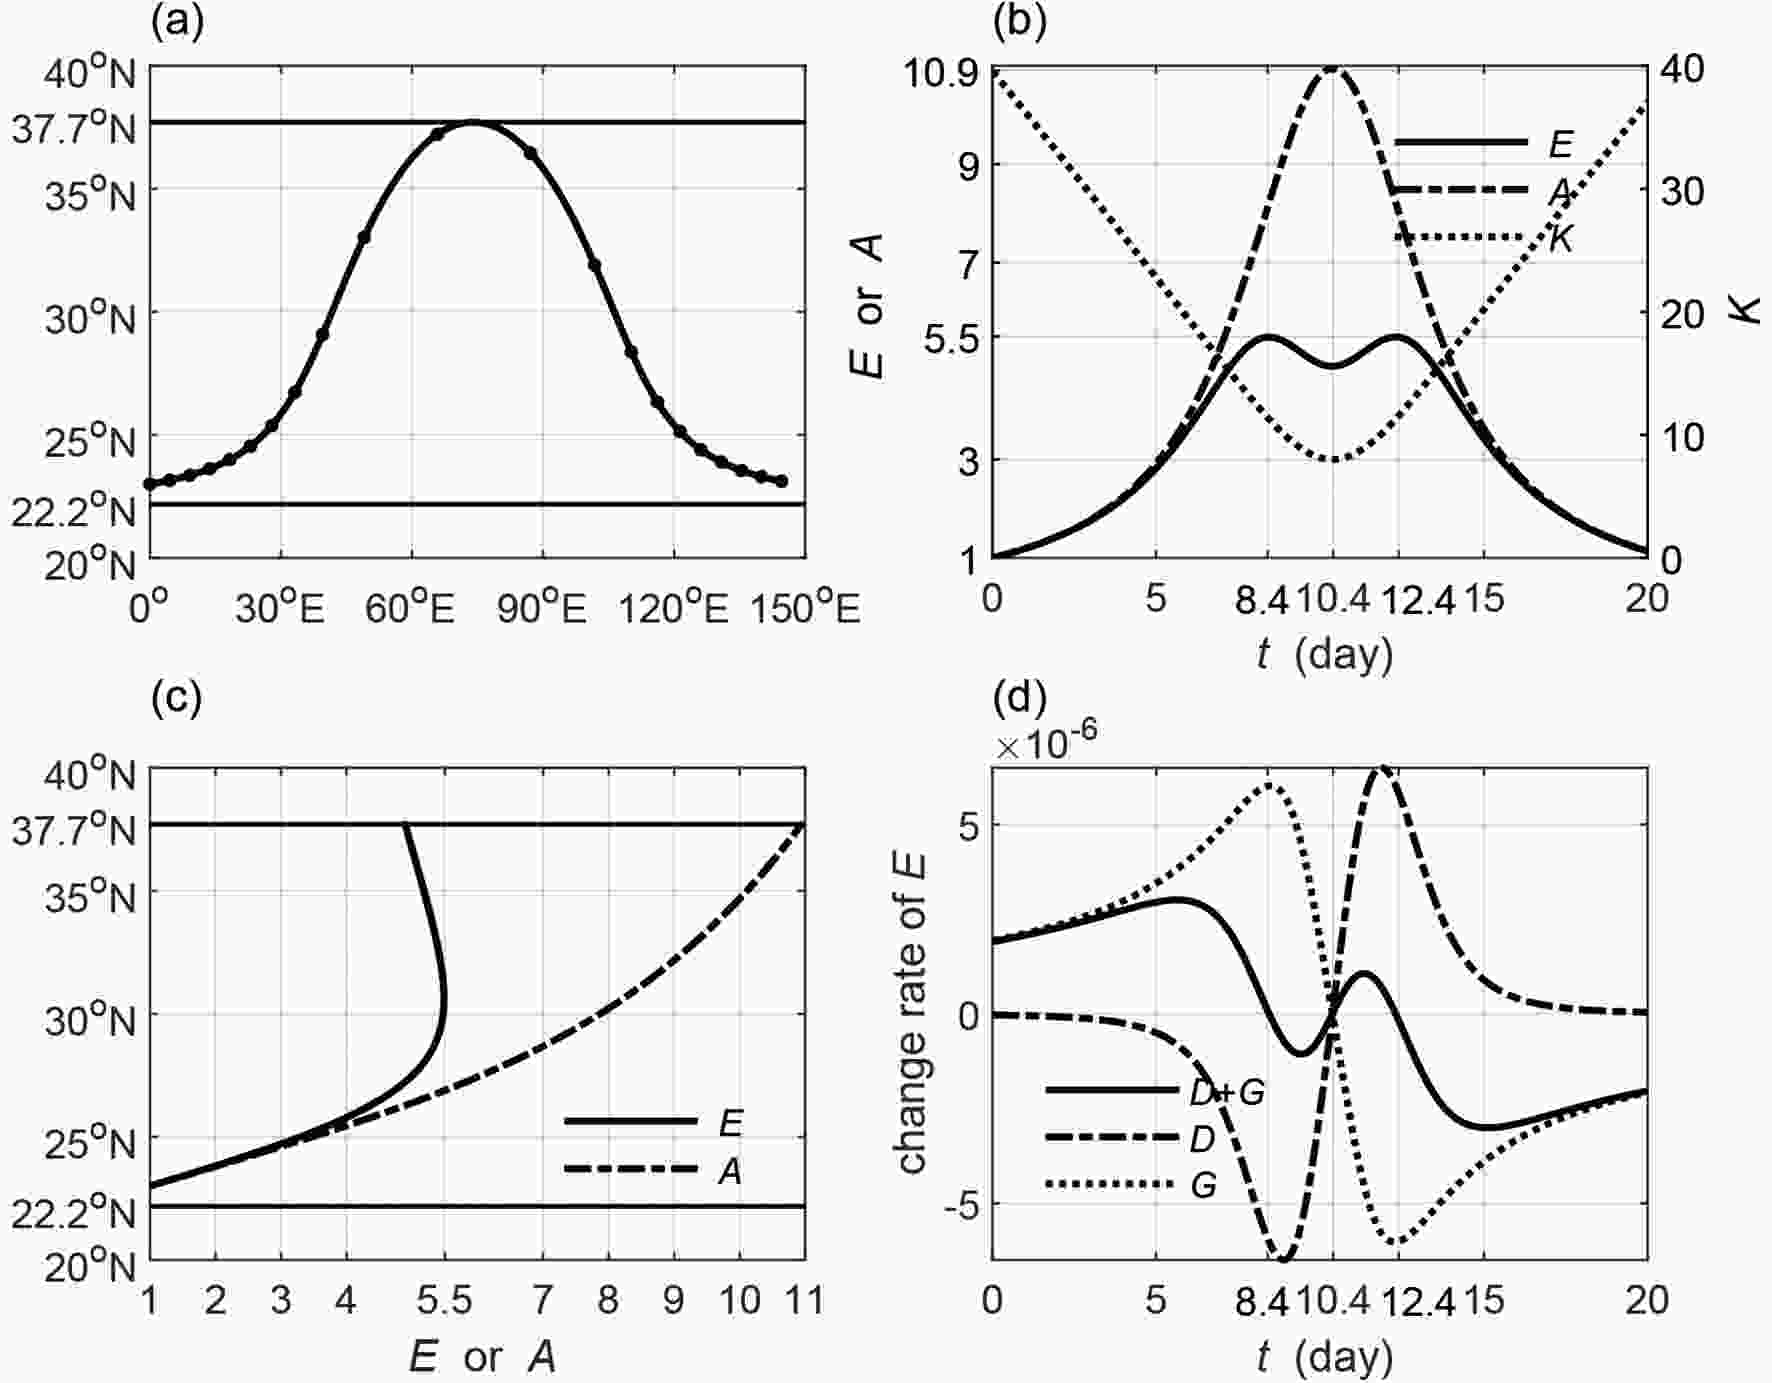 Figure3. (a) The wave ray path (solid black dots denoting the 1-day interval) of the leading wave (wave source is set to 23°N) for k = 8 and T = 10 d. (b) The variations in the wave energy (solid line), amplitude (dash-dotted line) and total wave number (dotted line) along the leading ray (b). (c) The variations in the wave energy and the amplitude against the latitude. (d) The variations in the divergence of the group velocity (dash-dotted line, D), the energy budget from the basic flow (dotted line, G), and their sum (change rate of the wave energy) along the leading ray. The straight lines in (a, c) are the critical line (22.2°N) and turning latitude (37.7°N).
The variation in the wave energy can be explained by the divergence of the group velocity (D) and the barotropic energy from the basic flow (G) according to Eq. (10). From Fig. 3d, both D (dash-dotted line) and G (dotted line) contribute to the change rate of the wave energy (solid line). When the ray leaves the source toward the turning latitude, it moves increasingly faster, leading to D < 0, which denotes dispersion of the wave energy. Therefore, D plays a negative role in determining the wave energy. Meanwhile, the leading ray (


The trailing wave ray marches southeast toward the critical line within 20 days (Fig. 4a). The wave energy along the ray approaches to 1.1 times when the ray arrives at 30°N at around 1.5 days, and then continuously decreases to close to zero at 20 days (solid line in Fig. 4b). Although the increasingly slower group velocity makes the convergence of the wave energy (D > 0, dash-dotted line in Fig. 4d), it only outweighs the negative energy budget from the basic flow (G < 0, dotted line in Fig. 4d) within 1.5 days. Therefore, the change rate (solid line in Fig. 4d) is larger than zero and the wave energy has a slight increase during the period. Longer than 1.5 days, the effect of G outweighs that of D and the change rate is smaller than zero. The decrease in the wave energy means that the wave energy is absorbed by the basic flow. The amplitude monotonically decreases (dash-dotted line in Fig. 4b), which is mainly caused by the shrinking horizontal wave scale (increasing total wavenumber K, dotted line in Fig. 4b) when the ray moves toward the critical line. For the trailing wave, it decays because both the wave energy and the amplitude decrease in most cases.
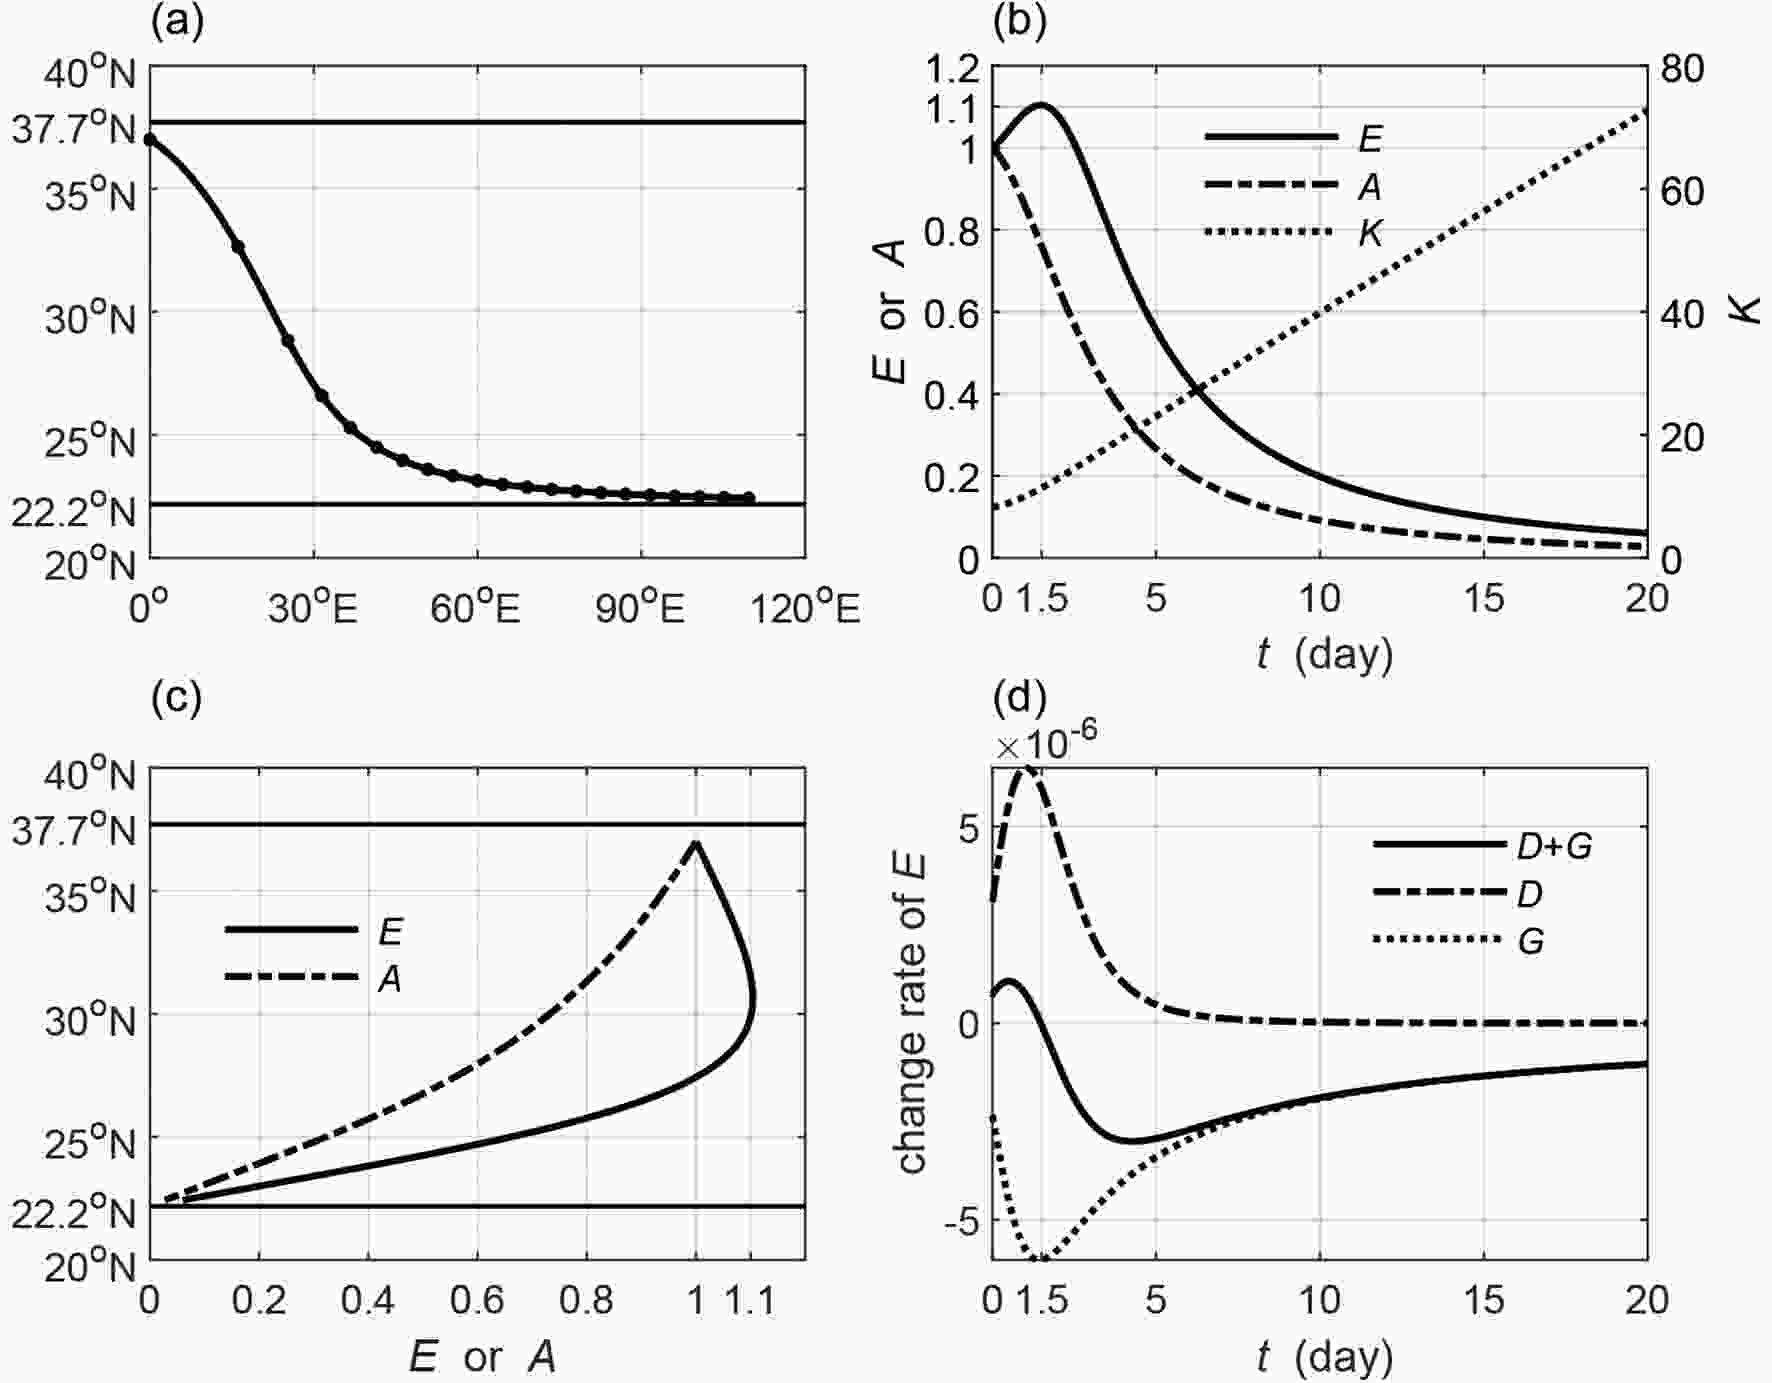 Figure4. As in Fig. 3 but for the trailing wave (wave source is set to 37°N).
2
3.2. Westerly jet with ${\beta _{\rm{M}}}$
smaller than zero
By setting 


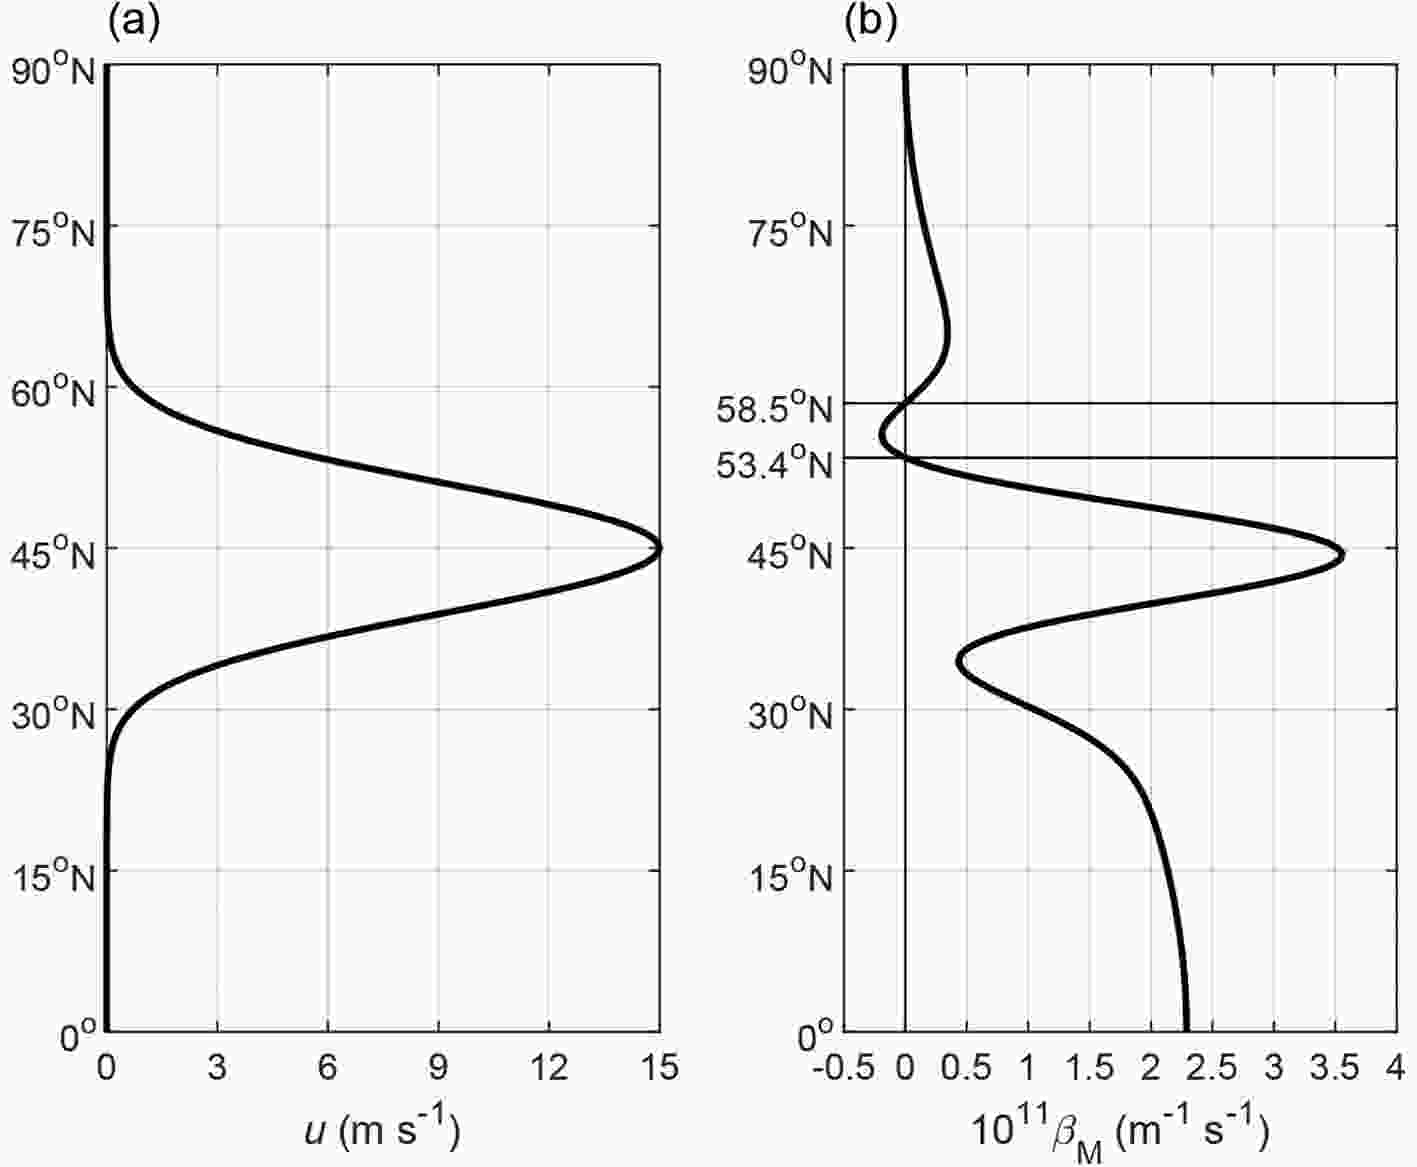 Figure5. Meridional distribution of the (a) westerly jet and (b) meridional gradient of the potential vorticity
The propagating area (Fig. 6) presents certain similar behaviors. When fixing k = 8 for the synoptic scale, no Rossby waves can propagate within a very short period, such as T = 2 d (Fig. 6a). There is one wide transmission band located at 38.9°?52.5°N for a longer period of T = 5 days. Within this band, the wave ray would move directly toward any critical line. Since a wave decays when it moves toward the critical line, no case has been discussed for the band with two critical lines. There are two bands situated at 35.7°?48.6°N and 55.6°?56.4°N for a longer period of T = 10 d. It is interesting that the northern narrow band is located in the


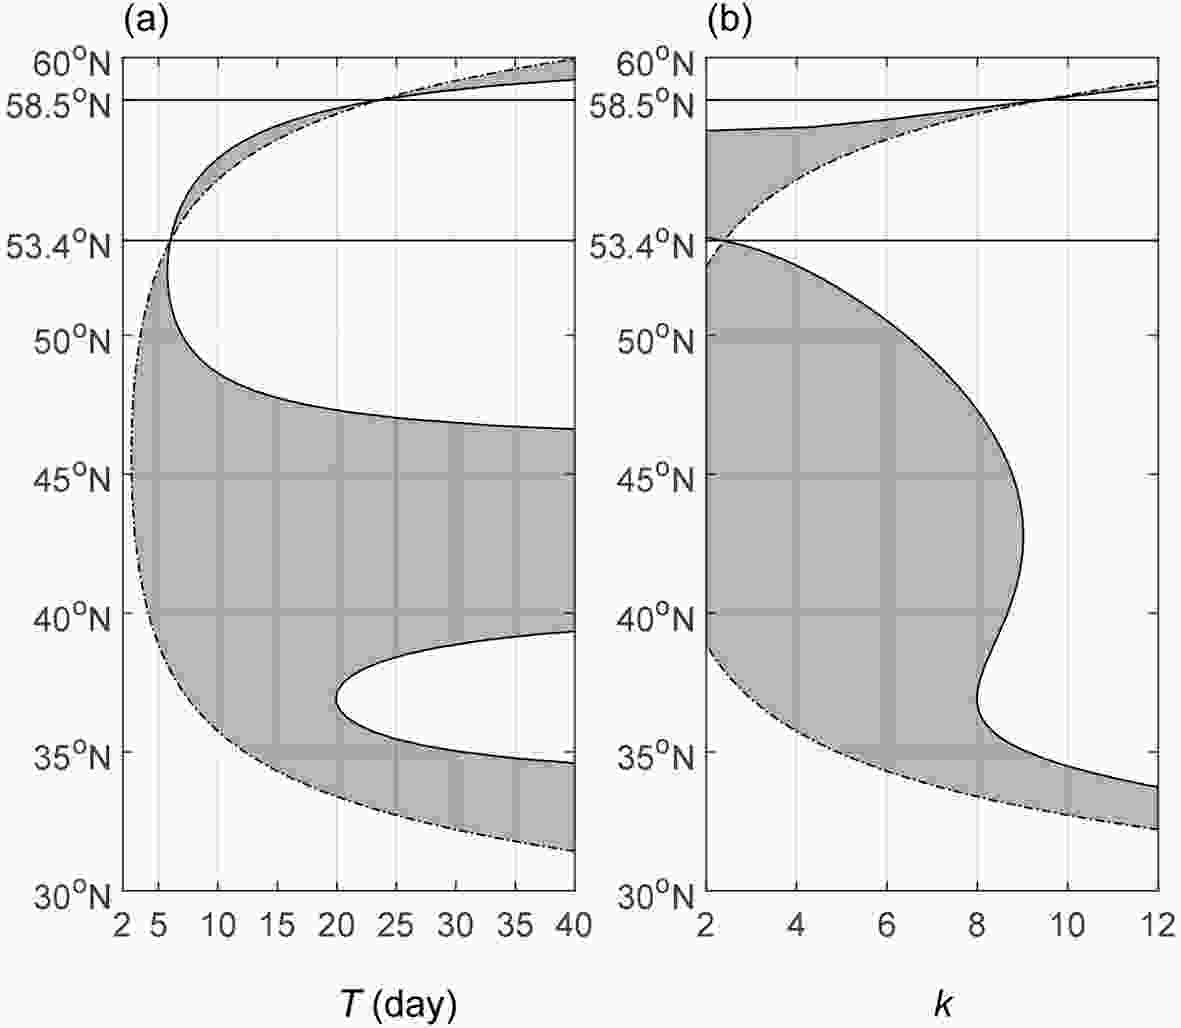 Figure6. Energy dispersion regions (shaded) bounded by a turning latitude (solid line) and by a critical line (dotted-dashed line): (a) for zonal wavenumber k = 8; (b) for a period of T = 20 d.
We further set the wave period to T = 20 d to discuss the variation in the propagating area with the zonal wavenumber (Fig. 6b). Here, the period is set to 20 days because there are two representative propagating bands when the period is 20 days, while there is only one when the period is 10 days. For k = 2, there are two bands located at 38.9°?52.4°N and 53.5°?57.6°N. The northern zone sits in the


Figures 7 and 8 portray the situations for the leading and trailing wave rays in the southernmost band, which is enclosed by a southern critical line (33.4°N) and a northern turning latitude (36.7°N). The leading wave source is placed near the critical line and the ray propagates northeast to the turning latitude and then turns southeast to tend to the critical line (Fig. 7a). Both the wave energy and the amplitude increase to the maximum values when the ray arrives at the turning latitude and then decreases when the ray leaves the turning latitude (Fig. 7b), which means that both monotonically increase with the latitude (Fig. 7c). The maximum wave energy is 10.4 times, while maximum amplitude is 17.1 times its initial value. The wave may develop significantly or even break with the huge increments. According to Eq. (10), the huge increase in the wave energy can be mainly attributed to the barotropic energy from the basic flow (dotted line in Fig. 7d), rather than the convergence of the wave energy (dash-dotted line in Fig. 7d). It suggests that the wave gains barotropic energy from the basic flow when it propagates toward the turning latitude, although increasingly faster group velocity disperses its energy during the same period. The increase in the wave energy, as well as the enlarging horizontal scale (shrinking total wavenumber K, see the dotted line in Fig. 7b), causes the huge increase in the amplitude.
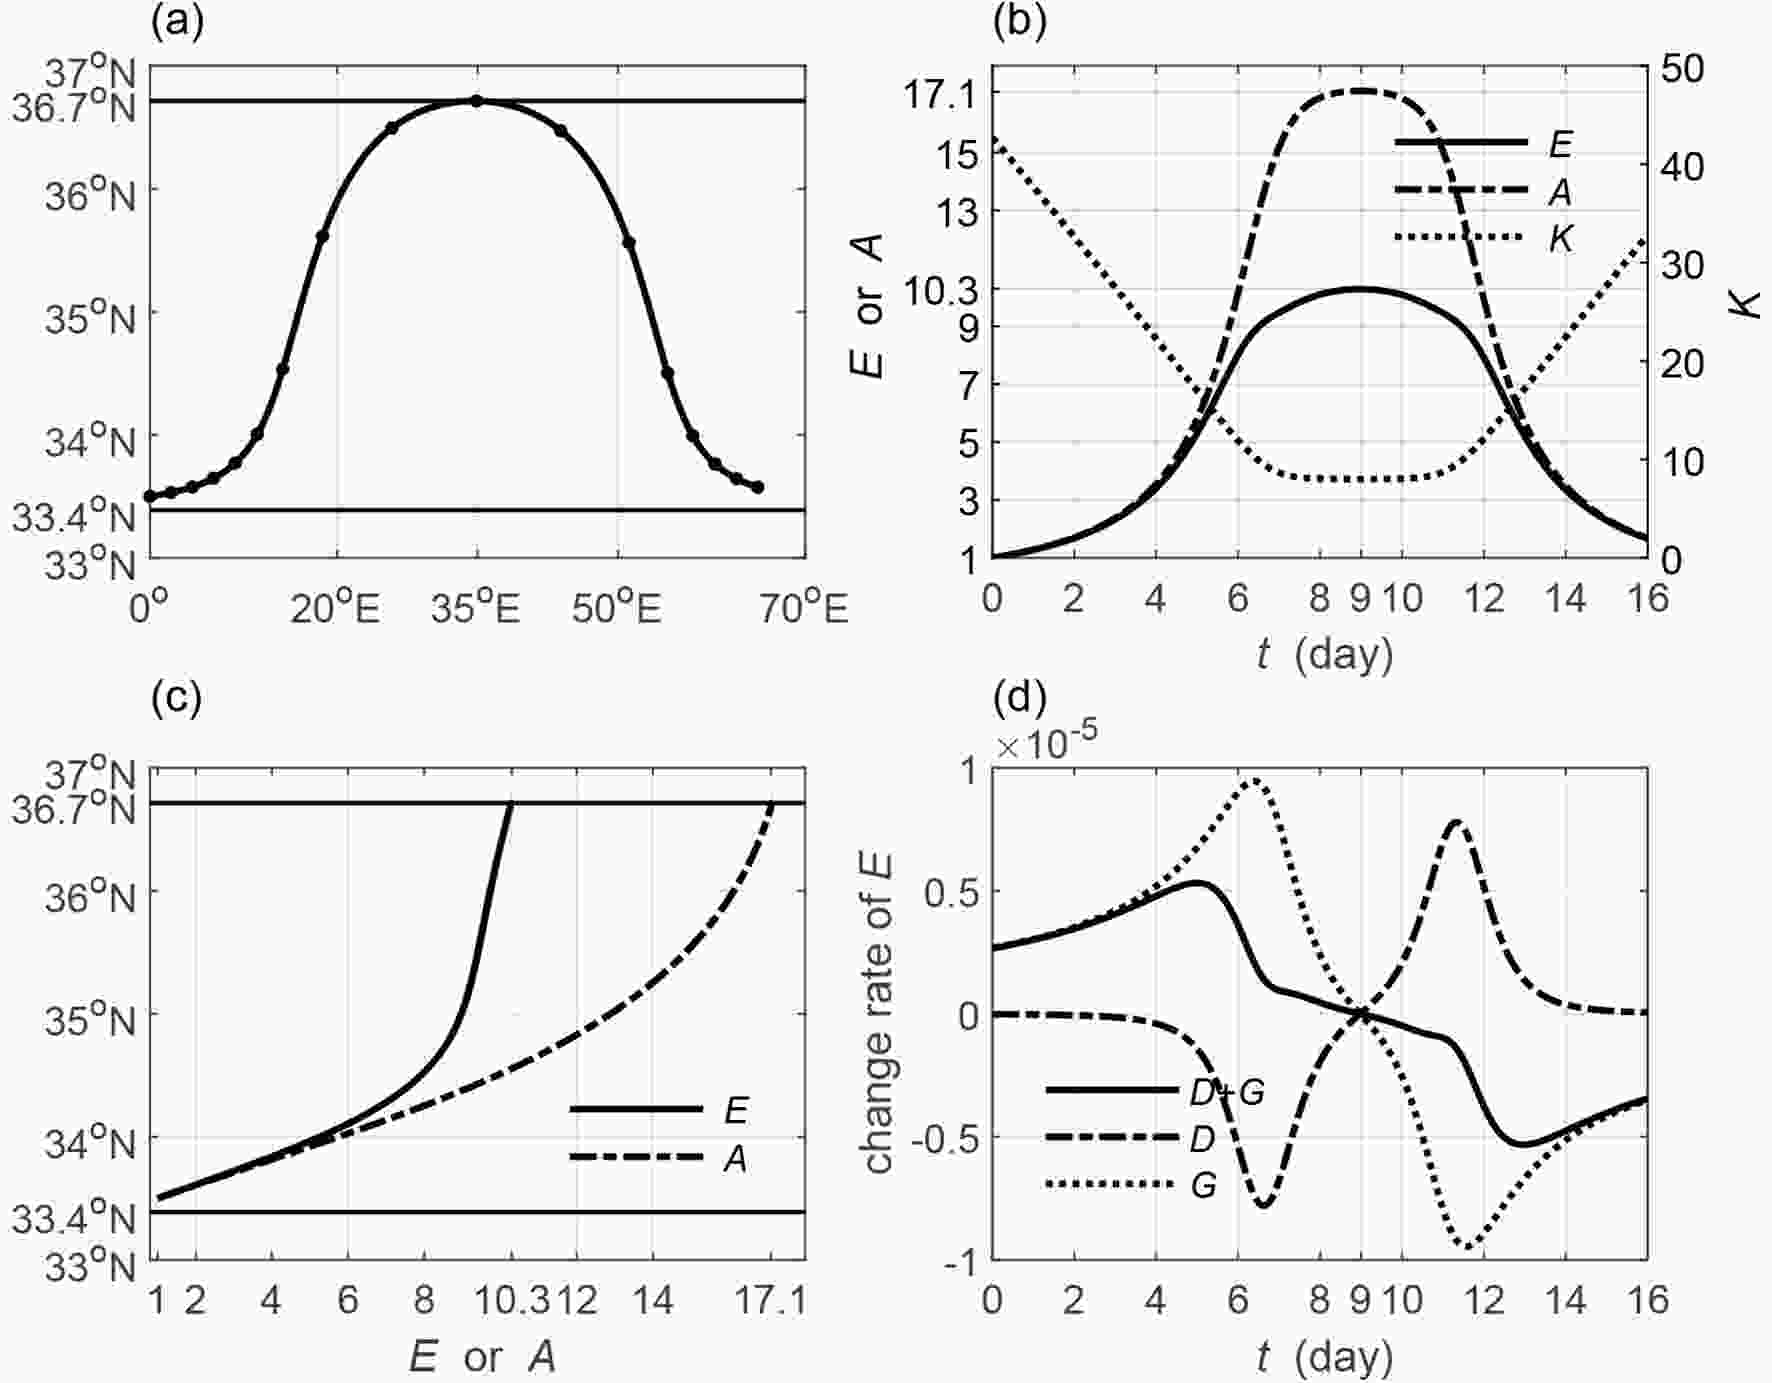 Figure7. (a) The wave ray path (solid black dots denoting the 1-day interval) of the leading wave (wave source is set to 33.5°N) for k = 8 and T = 20 d. (b) The variations in the wave energy (solid line), amplitude (dash-dotted line) and total wave number (dotted line) along the leading ray. (c) The variations in the wave energy and the amplitude against the latitude. (d) The variations in the divergence of the group velocity (dash-dotted line, D), the energy budget from the basic flow (dotted line, G), and their sum (change rate of the wave energy) along the leading ray. The straight lines in (a, c) are the critical line (33.4°N) and turning latitude (36.7°N).
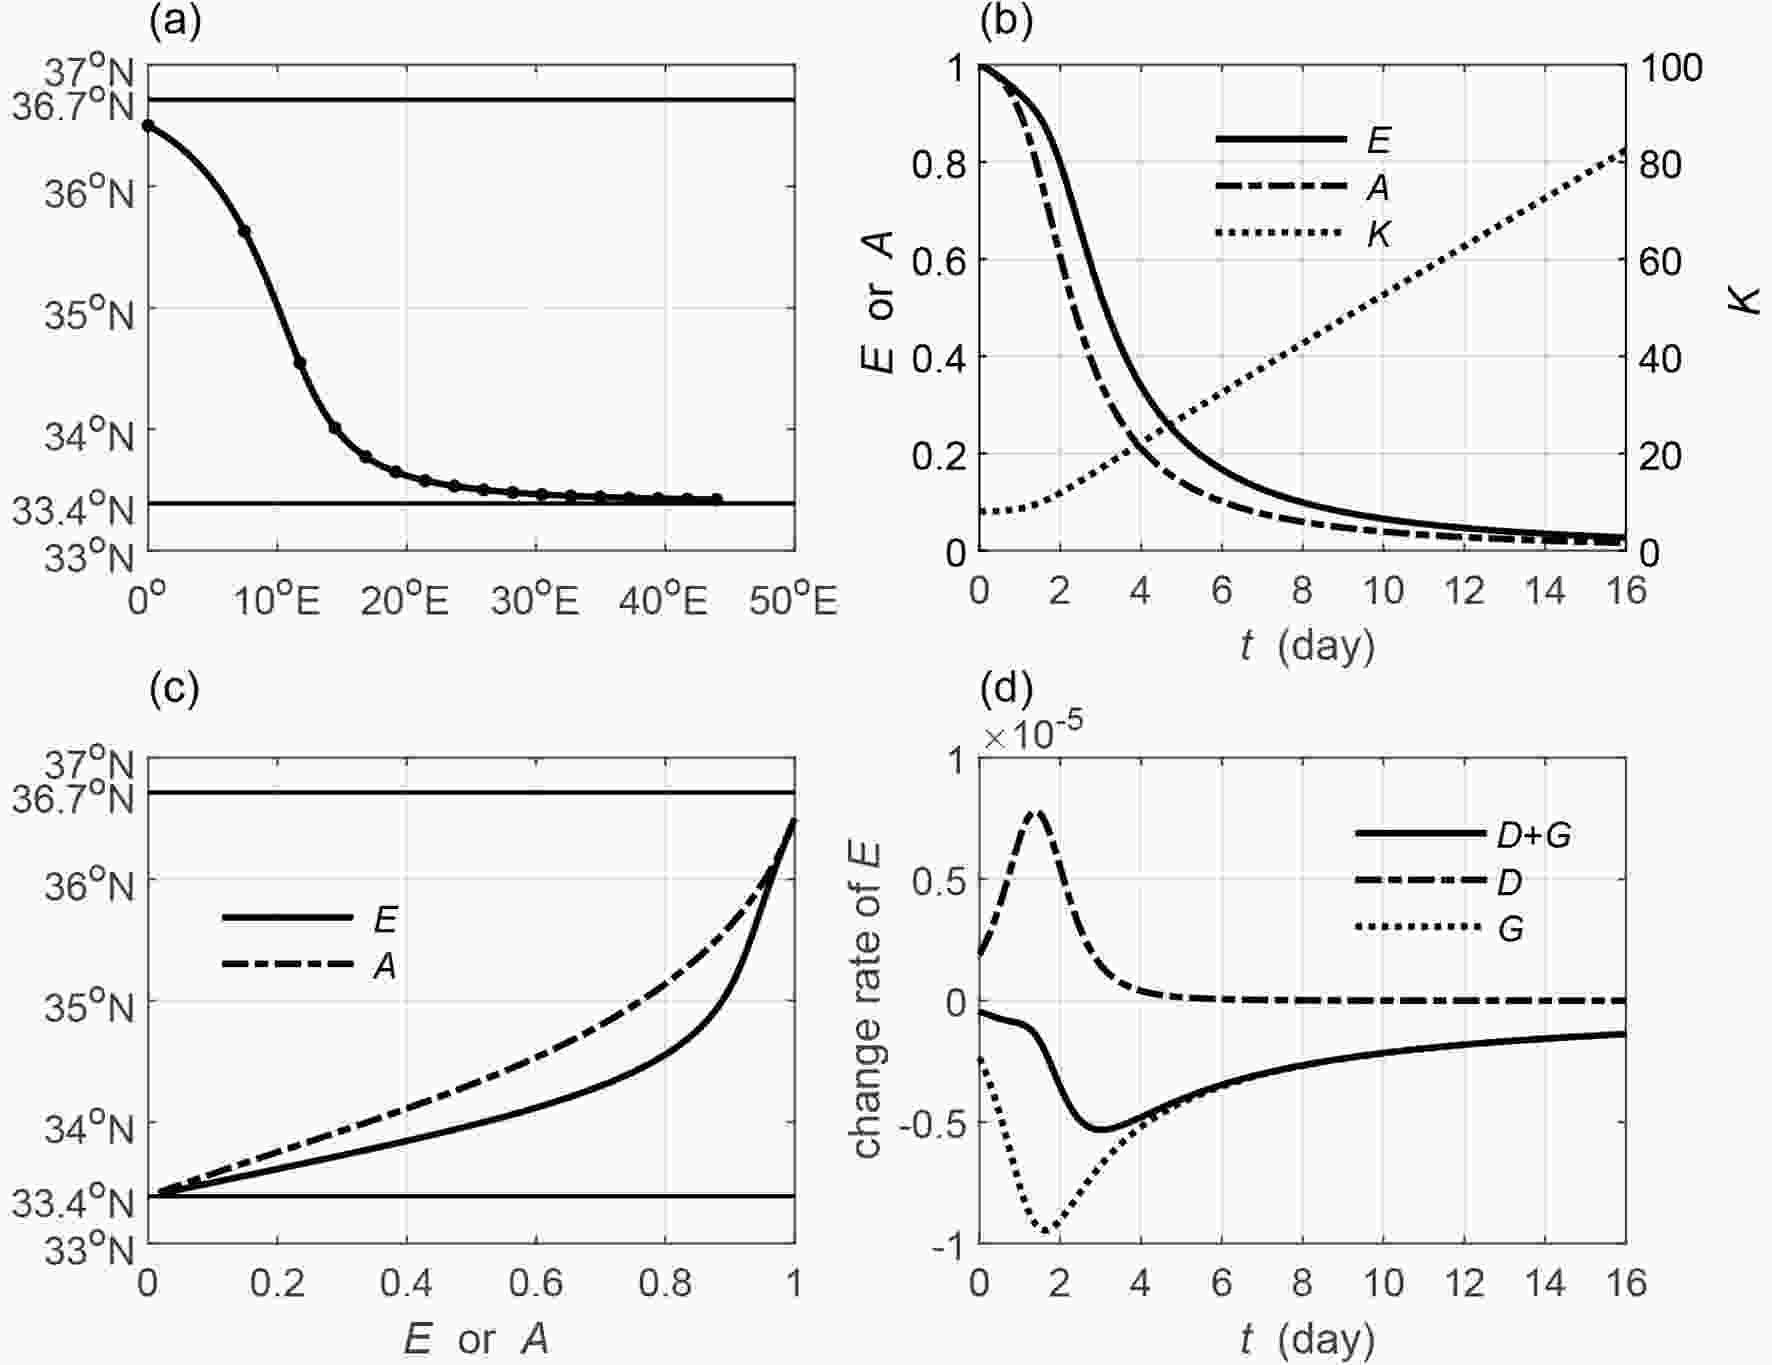 Figure8. As in Fig. 7 but for the trailing wave (wave source is set to 36.5°N).
Let us now compare its difference with the leading wave in the westerly jet with


The trailing wave source is placed near the turning latitude and the ray directly propagates to tend to the critical line (Fig. 8a). Both its wave energy and amplitude (Fig. 8b) decrease along the marching ray and monotonically decrease with decreasing latitude (Fig. 8c). The wave energy is absorbed by the basic flow (dotted line in Fig. 8d), although increasingly slower group velocity converges more energy (dash-dotted line in Fig. 8d). The decreasing wave energy, together with the shrinking wave scale (dotted line in Fig. 8b), contributes to the decreasing amplitude. Therefore, the trailing wave decays when it propagates toward the critical line.
Figures 9 and 10 portray the situations for the leading and trailing wave rays in the middle band, which is enclosed by two turning latitudes (37.1°N and 47.3°N). The leading wave source is placed near the southern turning latitude. The marching ray is alternately reflected by the two turning latitudes to form a wave-like structure (Fig. 9a). For convenience, we only analyze the period when the ray leaves its source for the first northern turning latitude. The wave energy reaches the maximum value of 1.33 times on the way (43°N) to the northern latitude and declines to 1.18 times at the northern latitude (solid line in Figs. 9b and c). The increase and decrease in the wave energy can be explained by the combined effects of the energy divergence and the barotropic energy budget (Fig. 9d). The rays moves increasingly faster when it leaves the source toward the northern latitude. Therefore, the energy dispersion causes the decrease in the wave energy during the whole period. When the ray leaves its source to arrive at 43°N within around 2.5 days, the barotropic energy from the basic flow outweighs the energy divergence and the wave energy increases to the maximum value. When the ray continues moving toward the northern latitude (43°?47.3°N), the energy divergence outweighs the barotropic energy budget and the wave energy decreases. Notice that when the ray moves from the jet axis (45°N) at around 2.7 days to the northern turning latitude (47.3°N) at around 3.2 days, the wave begins to lose its energy to the basic flow due to the negative gradient of the basic flow (

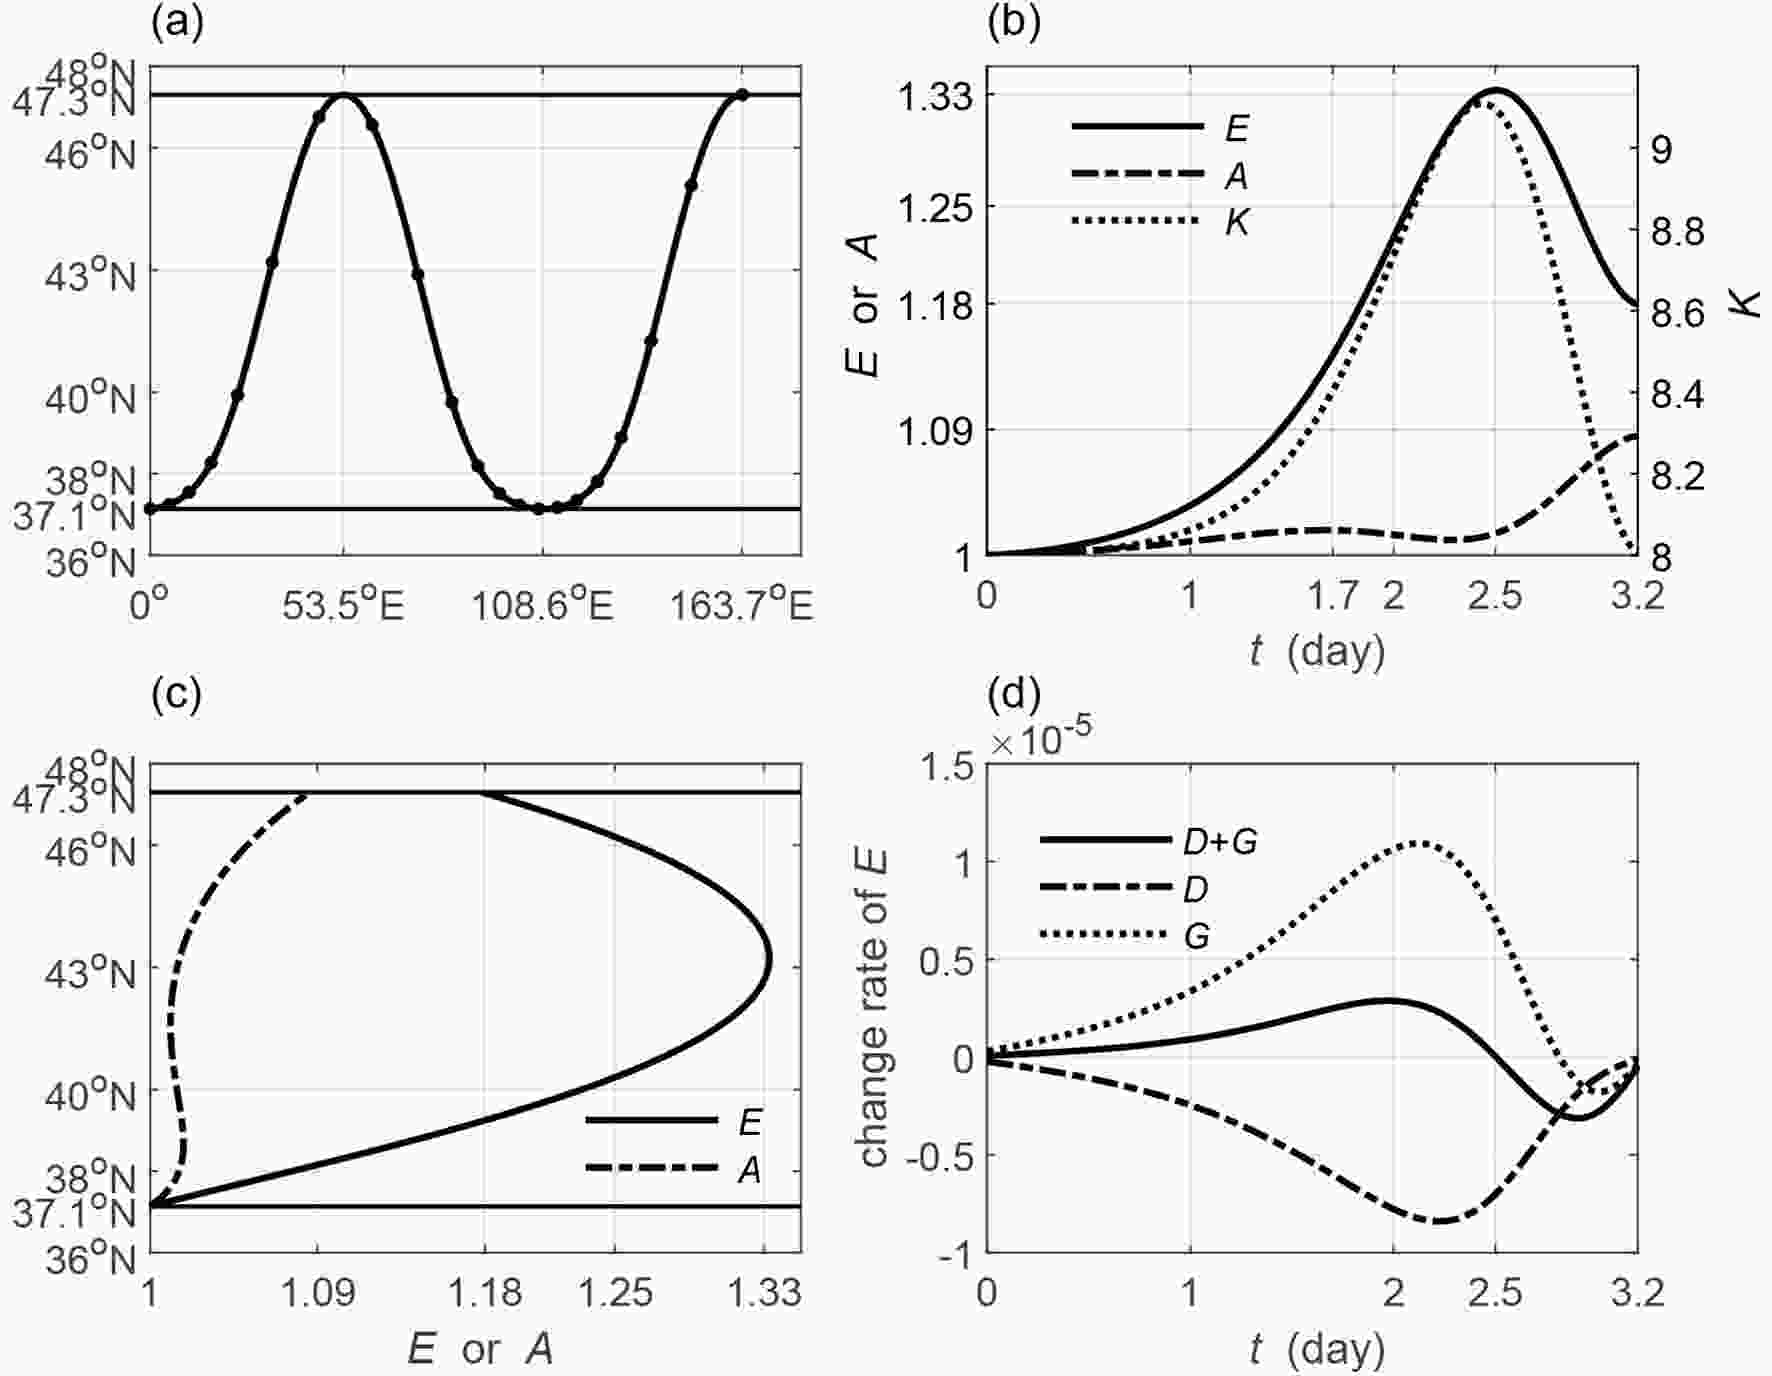 Figure9. As in Fig. 7 but for the leading wave (wave source is set to 37.14°N). The straight lines in (a, c) are the two turning latitudes (37.1°N and 47.3°N). The solid black dots on the ray (a) denote the half day interval. The time in (b, d) is terminated when the ray first arrives at the northern turning latitude.
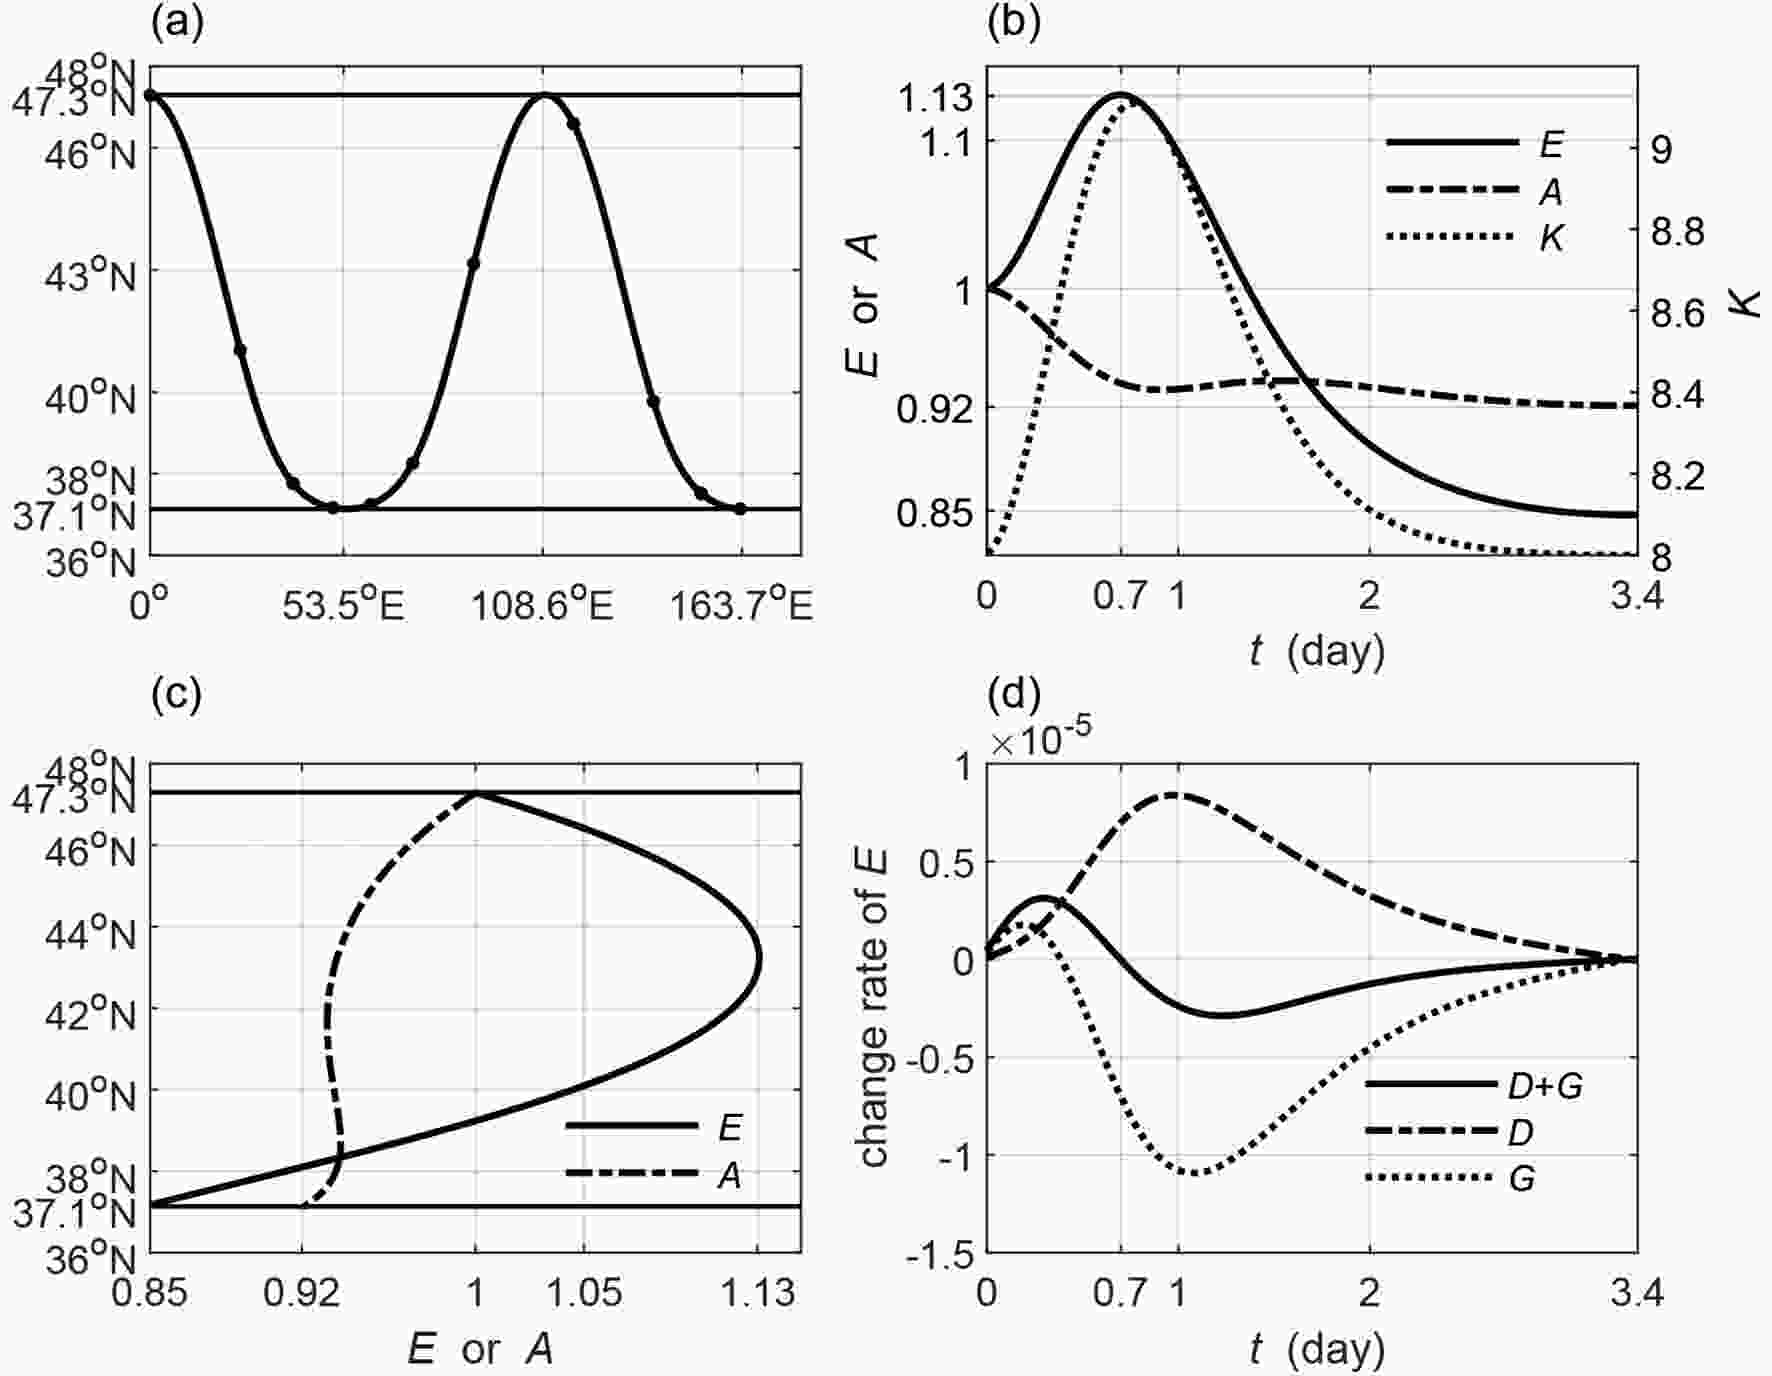 Figure10. As in Fig. 9 but for the trailing wave (wave source is set to 47.29°N).
Similar to the leading ray, the initial trailing ray is reflected alternately by the southern and the northern turning latitudes (Fig. 10a). The wave energy increases to the maximum value on the way (around 43°N) to the southern turning latitude (solid line in Figs. 10b and c). As can be seen from Fig. 10d, the increase in the wave energy is mainly caused by the energy convergence due to increasingly slower group velocity. Of course, the trailing wave also absorbs the barotropic energy from the basic flow when it is north of the jet axis. The decrease in the wave energy is mainly caused by the predominant energy lost to the basic flow. The total wavenumber also reaches the maximum value on the way to the southern latitude (dotted line in Fig. 10b), suggesting a shrinking and then enlarging horizontal scale. The amplitude decreases, increases and then decreases along the marching ray (dash-dotted line in Fig. 10b). Its variation pattern against the latitude is highly similar to the leading ray as discussed above.
According to the above analysis, it is clear that both the wave energy and the amplitude oscillate against the initial value for both the leading and trailing waves. The maximum increase does not exceed 40% for the wave energy, and 10% for the amplitude. The increase or decrease is relatively small compared with leading rays in the propagating region enclosed by a critical line and a turning latitude. Therefore, waves neither develop significantly nor decay in the propagating region enclosed by two turning latitudes. They are relatively stable and can propagate a long distance through the alternate reflection by each turning latitude. Furthermore, the propagating region is mainly located near the jet axis, suggesting the jet as a waveguide to allow waves to propagate a long distance.
2
3.3. Observed atmosphere westerly jet
We further investigate the propagating regions by examining the observed zonal wind distribution. The zonal wind data come from the NCEP reanalysis (Kalnay et al., 1996) provided by the NOAA/OAR/ESRL PSD, Boulder, Colorado, USA, from their website at


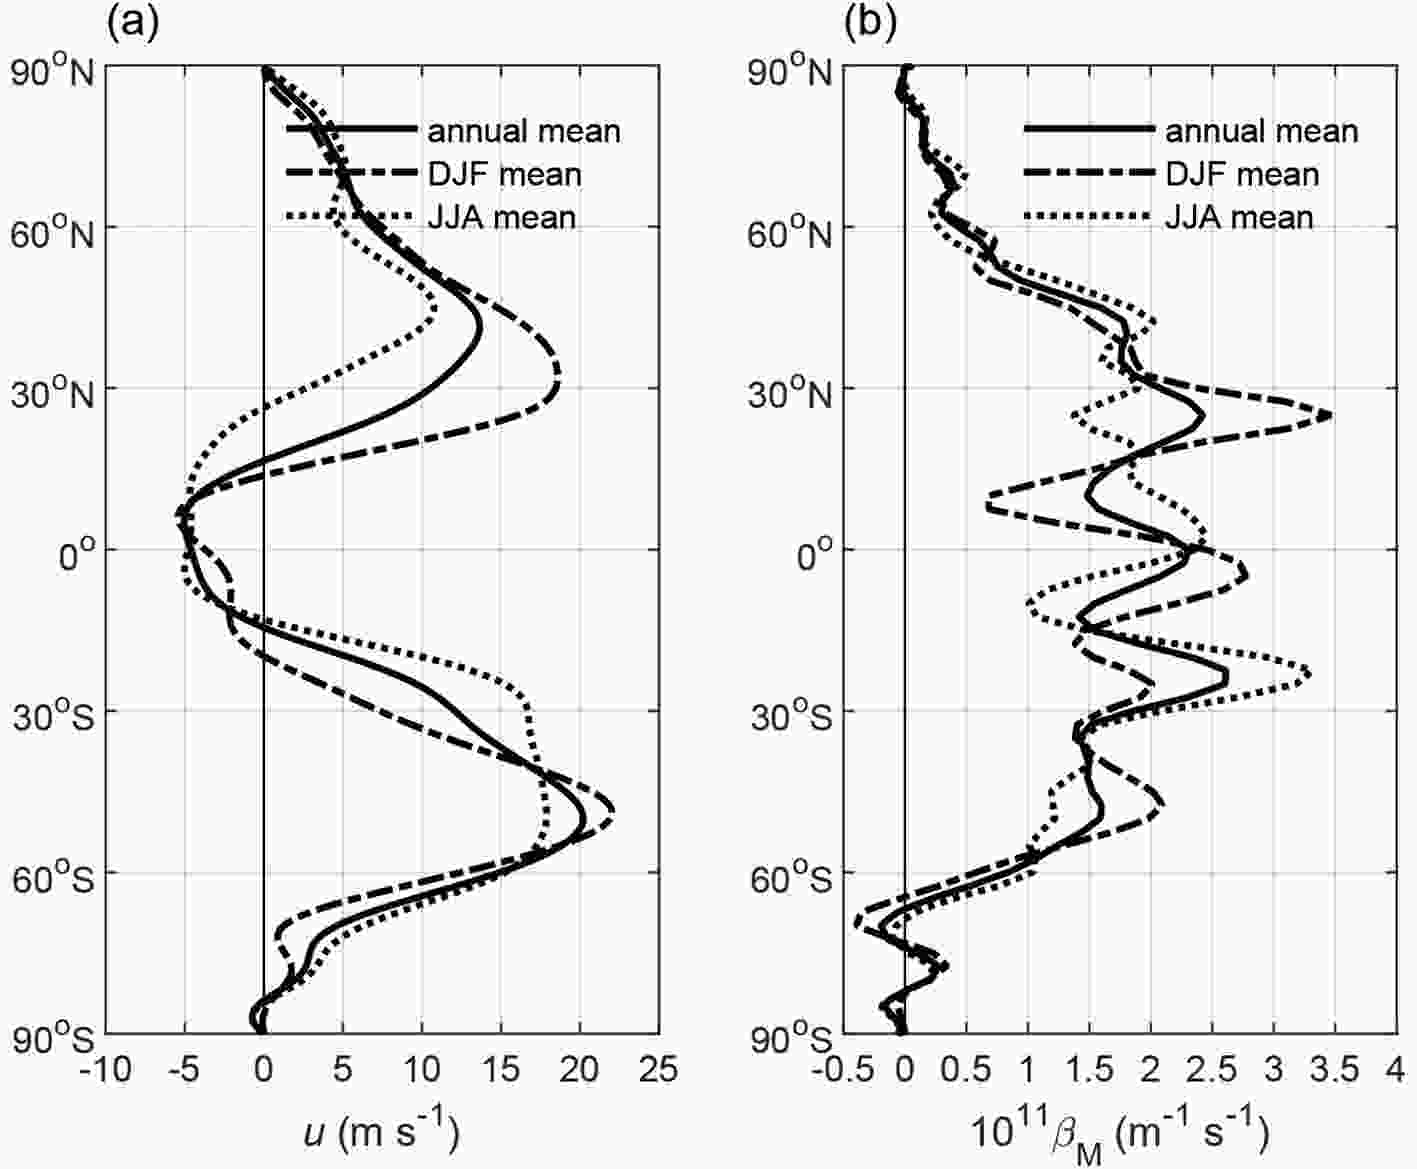 Figure11. (a) Meridional distribution of the annual (solid line), DJF (dash-dotted line), and JJA (dotted line) mean zonal wind, and (b) the corresponding meridional gradient of the potential vorticity
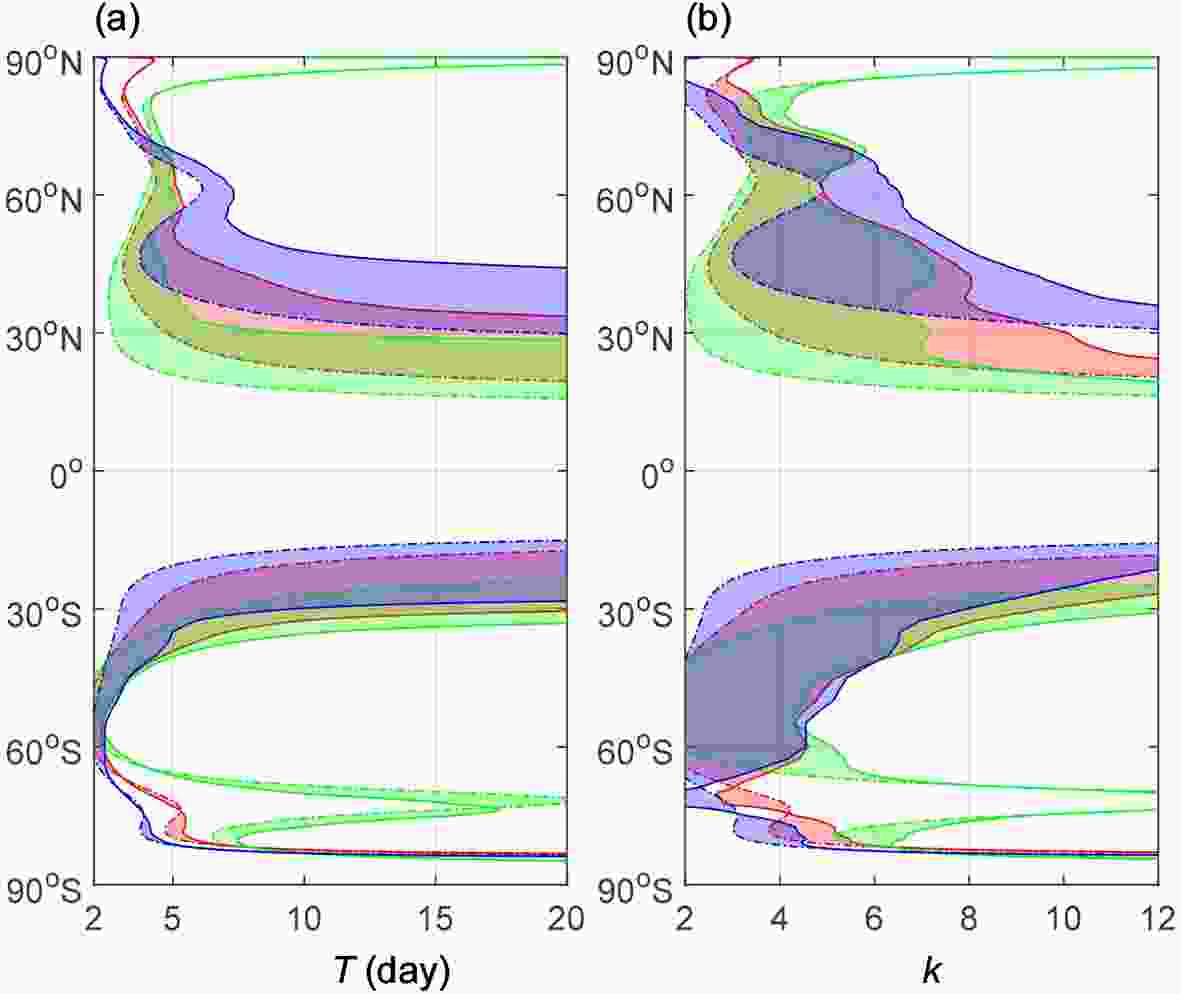 Figure12. Energy dispersion regions (shaded) bounded by a turning latitude (solid line) and by a wave trap line (dot-dashed line) for the annual (red), DJF (green) and JJA (blue) mean zonal wind: (a) for zonal wavenumber k = 8; (b) for a period of T = 10 d.
Figures 13 and 14 portray the situations for the leading and trailing wave rays in the region that is enclosed by a southern critical line (22.3°N) and a northern turning latitude (38.5°N) in the annual mean zonal wind background by specifying k = 8 and T = 10 d. The leading wave is placed near the critical line and moves northward to the turning latitude and turns southward to the southern critical line to become a trailing wave (Fig. 13a). The wave energy reaches the maximum value and then decreases until the ray arrives at the turning latitude, while the amplitude reaches the maximum value at the turning latitude (Figs. 13b and c). The barotropic energy from the basic flow is a positive factor, while the energy divergence is a negative one. The increase in the wave energy happens when barotropic energy from the basic flows outweighs the energy divergence, and vice versa (Fig. 13d). The leading wave can develop significantly since both its wave energy and amplitude increase by a relatively large amount when it moves toward the northern turning latitude. The trailing wave moves directly toward the southern critical line (Fig. 14a). Within around 2.4 days, the increase in the wave energy is the result of the energy convergence due to increasingly slower group velocity. Longer than 2.4 days, the decrease in the wave energy is absorbed by the basic flow, although energy convergence still plays a positive role (Fig. 14d). The decreasing wave energy, multiplied by the shrinking scale, contributes to the continuously decreasing amplitude. The trailing wave is eventually trapped by the critical line with decreasing wave energy and amplitude and shrinking scale.
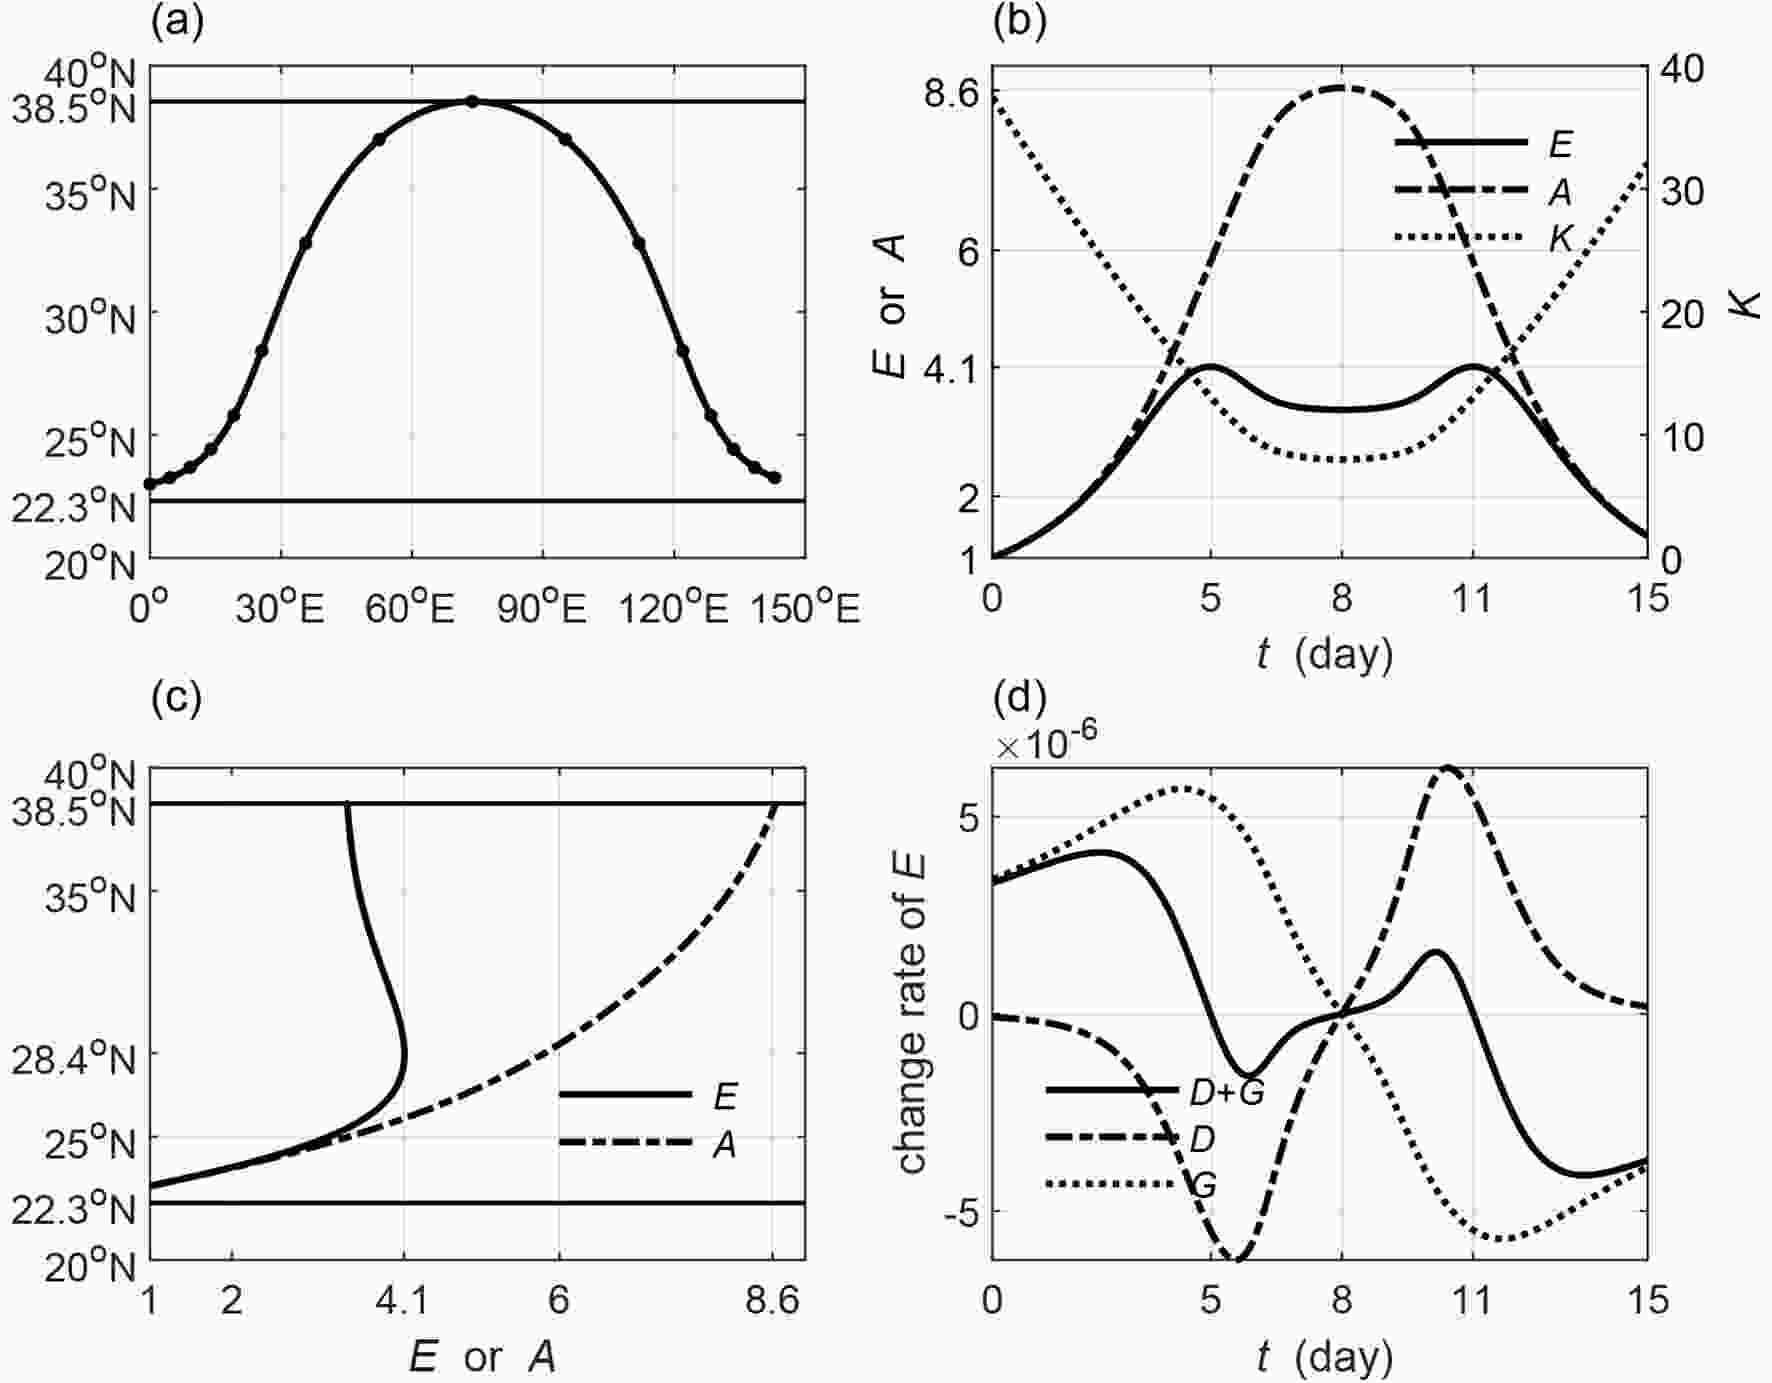 Figure13. As in Fig. 3 but for the leading wave (wave source is set to 23°N) in the annual mean zonal wind background. The straight lines in (a, c) are the critical line (22.3°N) and turning latitude (38.5°N).
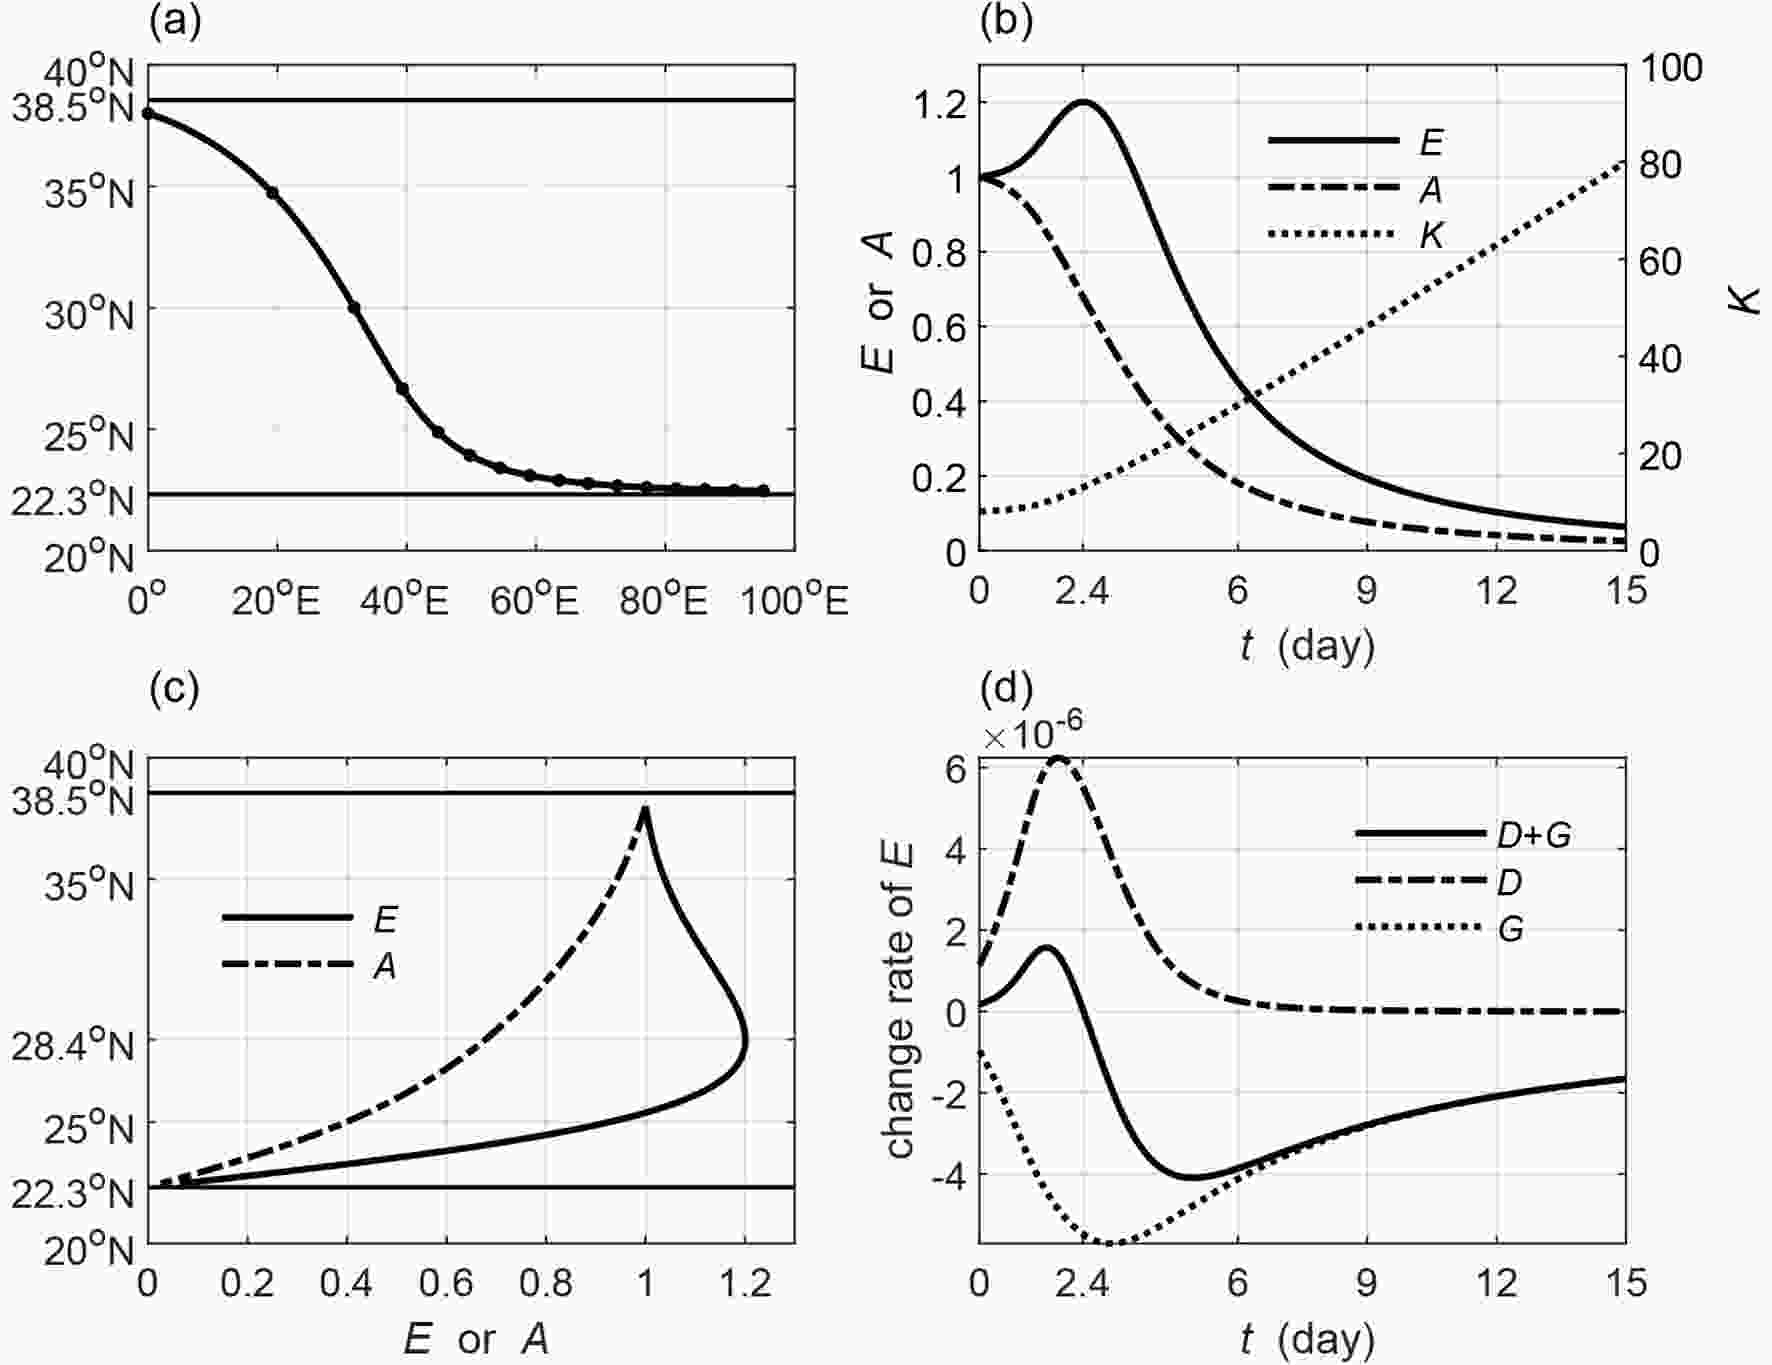 Figure14. As in Fig. 13 but for the trailing wave (wave source is set to 38°N).
The calculation results suggest that the wave energy and the amplitude present quite different features in different propagating regions, which is determined by the structure of the basic flow by specifying the zonal wavenumber, period and the source position of the wave. In the propagating regions enclosed by a southern critical line and a northern turning latitude, a leading wave ray heads toward the turning latitude and becomes a trailing ray after it is reflected by the turning latitude, while a trailing wave moves directly toward the critical line. The leading wave energy reaches its maximum value either on the way to the turning latitude or at the turning latitude. The increasingly faster group velocity disperses the wave energy. Therefore, the increase in the wave energy is mainly caused by the barotropic energy gained from the basic flow through eddy activities. In a sharper jet that associates with a

In the propagating region that is near the jet axis and enclosed by two turning latitudes, both leading and trailing wave rays are alternately reflected by the turning latitudes to form a wave-like structure. The wave energy increases on the way to the northern turning latitude and then decreases until the ray arrives at the northern turning latitude. The increase in the wave energy for the leading wave is mainly caused by the barotropic energy from the basic flow, while for the trailing wave it is the convergence of the wave energy. The change rate of the wave energy is relatively small due to matched sizes of the two factors. The amplitude reaches its maximum value at the northern turning latitude, while the minimum value is reached at the southern turning latitude. The variations in the amplitude are jointly determined by the wave energy and the wave scale. Both the wave energy and the amplitude vary in a moderate range, suggesting that the waves neither develop nor decay significantly. Therefore, they can propagate a long distance along the jet axis that acts as a waveguide for Rossby waves.
The main propagating region in the observed zonal wind is enclosed by a southern critical line and a northern turning latitude. It is located south of the jet and moves poleward from winter to summer. The variations in the wave energy and the amplitude are similar to situations in the theoretical zonal wind with

It should be noted that the development of Rossby waves is defined as the simultaneous increase in the wave energy and the amplitude, according to Lu and Zeng (1981). However waves might also develop significantly to bring transient synoptic phenomena in local regions if the wave energy is concentrated but the amplitude is decreasing, as Lu and Zeng (1981) suggested. Therefore, it is still of interest to further discuss the definition of the wave development. Besides, when a wave develops significantly, it may be unstable to induce instability. The waves seem to develop more significantly in the westerly jet with a

Acknowledgements. This study was jointly funded by the National Natural Science Foundation of China (Grant Nos. 41505042 and 41805041), the National Program on Global Change and Air?Sea Interaction (Grant No. GASI-IPOVAI-03), the National Basic Research Program of China (Grant Nos. 2015CB953601 and 2014CB953903), and the Fundamental Research Funds for the Central Universities.
