HTML
--> --> -->For the 2019 season, the forecast system was upgraded following research on the use of an East Asian Summer Monsoon (EASM) index to skillfully forecast smaller, sub-basin regions (Liu et al., 2018). This linked with further research based on user evaluation of the earlier forecasts (Golding et al., 2017b), showing a clear requirement for improved spatial resolution and longer lead times (Golding et al., 2019). Thus, the forecasts issued in 2019 and 2020 use an EASM index to give probabilistic predictions of mean rainfall in MJJ and JJA for the Upper and Middle/Lower Reaches of the Yangtze basin separately, as well as for the basin as a whole, from the preceding February. The 2019 forecasts gave good guidance for the modestly above-average conditions in MJJ 2019 and the near-normal conditions in JJA 2019 (Bett et al., 2020; Zeng et al., 2020).
For the 2020 season, the climate service was further extended to include forecasts of June mean rainfall in the Middle/Lower Reaches of the Yangtze basin. This was based on the demonstration of significant skill in GloSea5 for predicting June mean rainfall directly in this region (Martin et al., 2020), where much of the rainfall during June is contributed by the mei-yu rainband.
In this paper, we describe the forecasts produced for summer 2020 and how they compared to the subsequent observations. We briefly outline the forecast methodology and datasets used in section 2, before describing the forecast evolution and evaluation in section 3. We summarize our results and discuss what we can learn from 2020 from a seasonal forecasting perspective in section 4.
The forecasts for MJJ and JJA are based on a seasonal mean forecast of the Wang and Fan (1999) EASM index, calculated from zonal wind at 850 hPa, u850, produced by the GloSea5 seasonal forecast system (MacLachlan et al., 2015). Liu et al. (2018) demonstrated that GloSea5 could skillfully forecast this index. The forecasts for June mean rainfall in the Middle/Lower Reaches of the Yangtze basin are based on the GloSea5 rainfall output for that month. The operational GloSea5 system running in 2020 used the Global Coupled 2 configuration of the HadGEM3 climate model, described in detail in Williams et al. (2015). Two forecast ensemble members are produced each day, and a full 42-member forecast ensemble can be constructed for a given start date by pooling together the runs from the three weeks prior to that date. A hindcast ensemble is produced alongside the forecasts for calibration, covering the 24-year period of 1993–2016. Seven hindcast ensemble members are produced on four fixed dates each month, and a full hindcast ensemble corresponding to a given forecast is assembled from the hindcast start dates closest to the forecast members’ start dates, as described in MacLachlan et al. (2015).
The EASM index is defined as the difference between the mean u850 in two boxes, one centred on the South China Sea (5°–15°N, 90°–130°E) minus one centred on the East China Sea (22.5°–32.5°N, 110°–140°E), and is closely related to the variability of the West Pacific Subtropical High (WPSH; Bett et al., 2020). Low values of the index correspond to anomalously anticyclonic circulation in the western North Pacific, acting to enhance the northward advection of moisture that occurs as part of the mei-yu front: this leads to increased rainfall in the Yangtze basin. High values of the EASM index, on the other hand, correspond to anomalously cyclonic circulation in the western North Pacific, acting against this northward flow over China and resulting in less rainfall over the Yangtze basin, but more rainfall in southern China.
The linear regression between the hindcast ensemble-mean EASM index and the historical observed precipitation is used as the basis for calibrated forecasts for MJJ and JJA, and the linear regression between the hindcast ensemble-mean and the observed mean precipitation is used for the June forecasts. Global Precipitation Climatology Centre (GPCC, Schneider et al., 2011, 2015) data are used as the observations. The linear regression is shown as a scatter plot in the issued forecasts, together with a contingency table describing the hit rate and false alarm rate for forecasts of above-average precipitation (an example of a forecast document is provided as Supplementary Information). This provides a very clear demonstration of both the skill and the uncertainty in the forecast: for example, while the linear regression shows that negative values of our EASM index often result in enhanced Yangtze rainfall, the uncertainty (prediction intervals) shows that this outcome is of course not guaranteed. Similarly, the scatter plots show that a correlation skill of zero would mean our method would simply forecast the observed climatological distribution and that, conversely, any skill greater than zero represents an improvement above using climatology. The scatter plots also demonstrate the uncertainty in determining the correlation skill due to the sample size. In our plots below, we highlight the skill uncertainty with a 95% confidence interval based on a Fisher z transformation.
Having characterized the historical relationship between the model and observations, a probabilistic forecast is then produced by applying the linear regression to a new ensemble mean forecast value of the EASM index from GloSea5. The forecast central estimate is given by the regression line itself, with the forecast uncertainty given by the prediction interval on the regression (e.g. Wilks, 2019). This method automatically accounts for biases in the mean and variance, and calibrates the forecast probabilities (Bett et al., 2020), within the limitations given by the length of the hindcast data set.
Bett et al. (2020) demonstrated that rainfall in the Middle/Lower Reaches of the Yangtze basin can be skillfully predicted in this way for the MJJ period, and the Upper Reaches can be skillfully predicted for JJA. These regions are defined in terms of the Yangtze watershed, divided in two by a line at 111°E. Bett et al. (2020) also showed there was skill for the whole basin average in both periods. In all cases, forecasts could be skillfully produced at lead times of at least three months (i.e., from February for MJJ and from March for JJA). Martin et al. (2020) demonstrated that June mean rainfall in a box over the Middle/Lower reaches of the Yangtze basin (25°–32.5°N, 110°–120°E) can be skillfully predicted directly by GloSea5 from February onwards, a lead time of four months.
Operationally, forecasts were produced every Sunday from February to June for internal monitoring. They were issued to CMA in the first week of each month: on 4 February, 3 March, 1 April, and 4 May (produced on the Sundays of 2 February, 1 March, 29 March, and 3 May), i.e., at lead times of approximately 1–4 months depending on the season of interest.
Finally, the observational rainfall data for summer 2020 were obtained from the GPCC monthly monitoring data set (Schneider et al., 2018), and observed EASM index values were calculated based on monthly-mean u850 data from the ERA5 reanalysis (Hersbach et al., 2019). Anomalies are always with respect to the 1993–2016 period of the hindcast.
 Figure1. Forecasts for the Middle/Lower Reaches of the Yangtze basin in MJJ 2020 as a function of lead time. The forecasts produced each week are shown as points, with grey vertical bars highlighting the monthly releases to CMA. Top (a): Absolute correlation between observations and the operational hindcasts available each week. The shading indicates the 95% confidence intervals on the correlation using a Fisher z test. Middle (b): The forecast signal from the linear regression, shown as the central estimates (blue line) and the 95% and 75% prediction intervals (green boxes). The observed mean over 1993–2016 is shown as a horizontal dashed line, with ±1 standard deviation shown as orange shading. The observed value for MJJ 2020 is shown as a horizontal orange line from May. Bottom (c): The forecast probability of MJJ rainfall in this region being above the 1993–2016 average.
The corresponding results for the forecasts for the Upper Reaches of the Yangtze basin in JJA are shown in Fig. 2. The skill from the hindcast is lower in this case, although it remains statistically significant at the 5% level throughout. The forecast probability of above-average rainfall in the region is again >60% at all lead times, and indeed rises to >80% in the weeks after the final forecast was issued in early May. The skill also increased in this period, and the forecast central estimate reaches about +1σ above average. Nevertheless, the observed value (7.1 mm d?1) is over 3.5σ above average, outside the 95% prediction intervals of the forecasts. Again, a similar pattern of behavior is seen in JJA for the basin as a whole (Fig. A2 in the Appendix).
 Figure2. Forecasts for the Upper Reaches of the Yangtze basin in JJA 2020 as a function of lead time, as in Fig. 1.
Figure 3 shows the evolution of the weekly forecasts of June mean rainfall for the box covering the Middle/Lower Reaches of the Yangtze basin in 2020. The skill is statistically significant at the 5% level for all forecasts until mid-April, and the forecasts give consistently high probabilities of above-average rainfall in the region (>60%) at all lead times from late February onwards. In contrast with the MJJ and JJA forecasts, the probabilities decrease from above 80% to just over 60% as the lead times reduce, returning to higher values for the final two forecasts in May. This is thought to be related to the increasing influence of less-predictable subseasonal variability on monthly mean rainfall predictions as the target month approaches, reducing the signal to noise ratio. For example, the 30–60 day intraseasonal oscillation (ISO) and the 10–20 day quasi-biweekly oscillation (QBWO) both have significant impacts on mei-yu rainfall (e.g. Ding et al., 2021). Since we would not necessarily expect to be able to predict the details of these features at the long lead times we consider here, it is therefore particularly significant that, in contrast to the MJJ and JJA forecasts, our one-month forecasts for June are more successful: the actual observed value lies within the 95% prediction interval of all the forecasts from March (three-month lead) onwards.
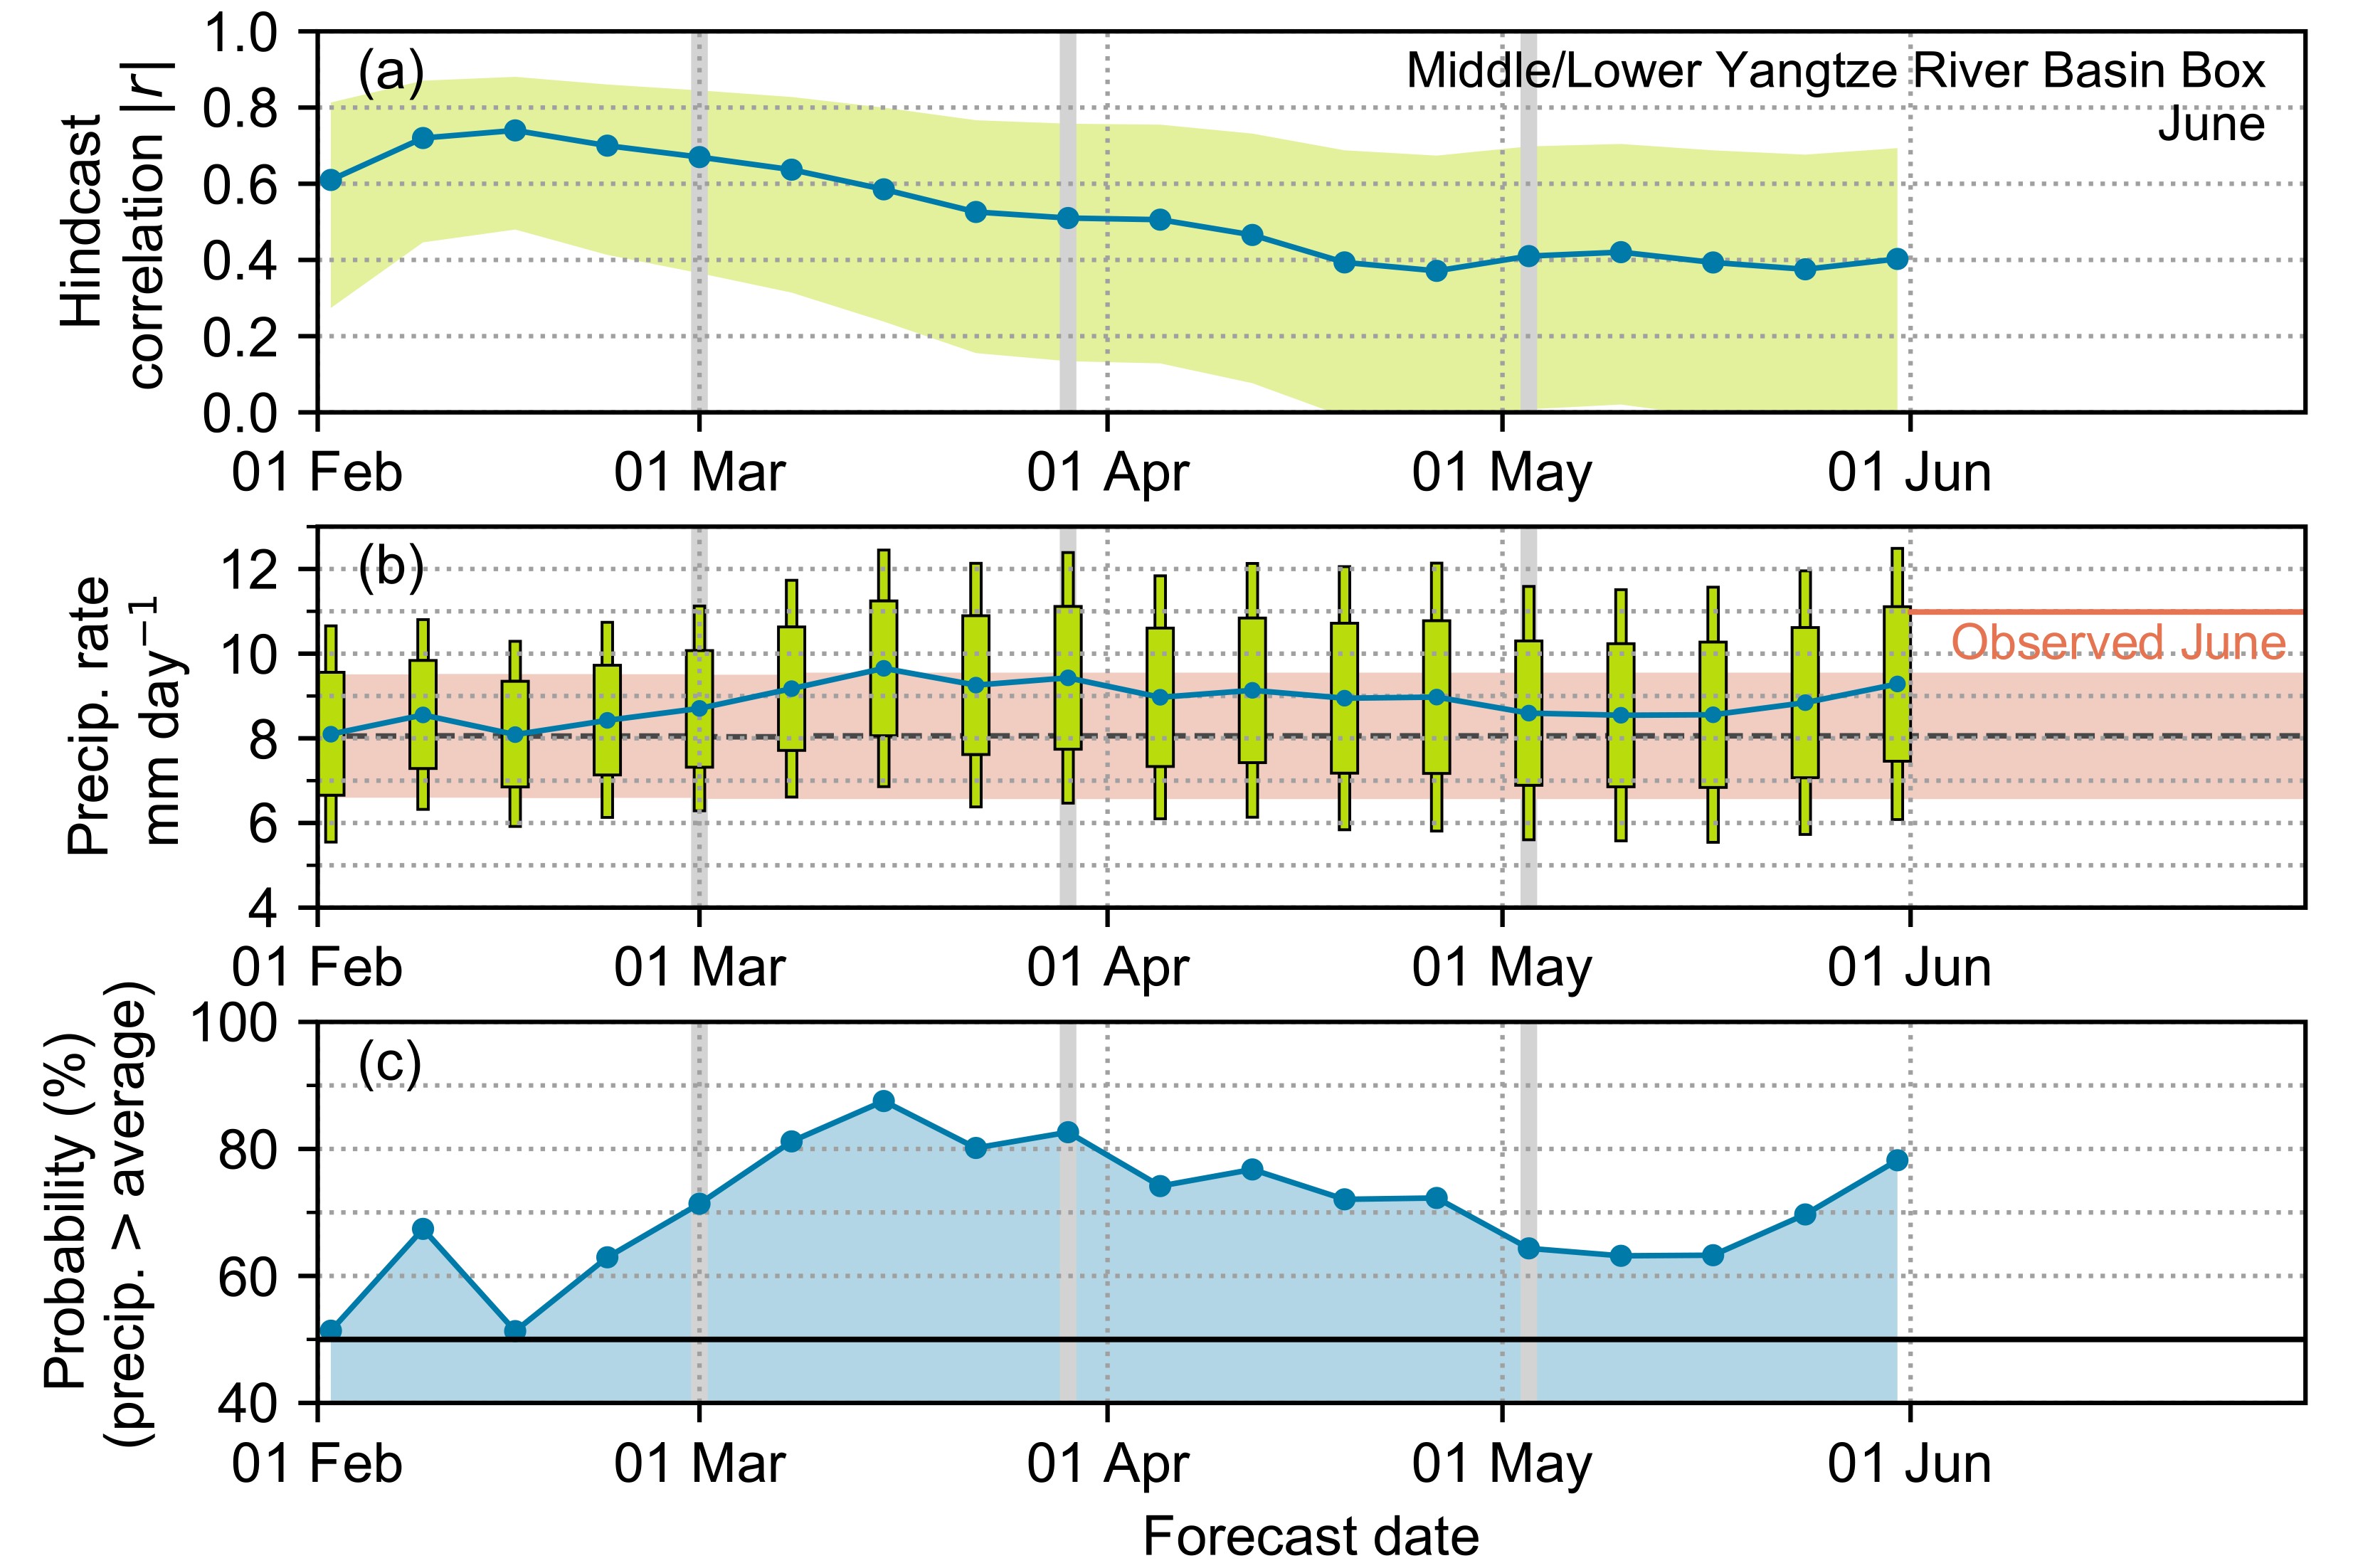 Figure3. Forecasts for June 2020 mean rainfall in the box covering the Middle/Lower Reaches of the Yangtze basin (25°–32.5°N, 110°–120°E) as a function of lead time, as in Fig. 1.
The breakdown of the observations by month and season is shown in Fig. 4. There are strong above-average anomalies in the Upper Reaches of the Yangtze basin in all four months and in the Middle/Lower Reaches in June and July. Outside the Yangtze basin itself, it is clear that there was also heavy rainfall in northeastern China in May and again in August; and in southern China in July and August.
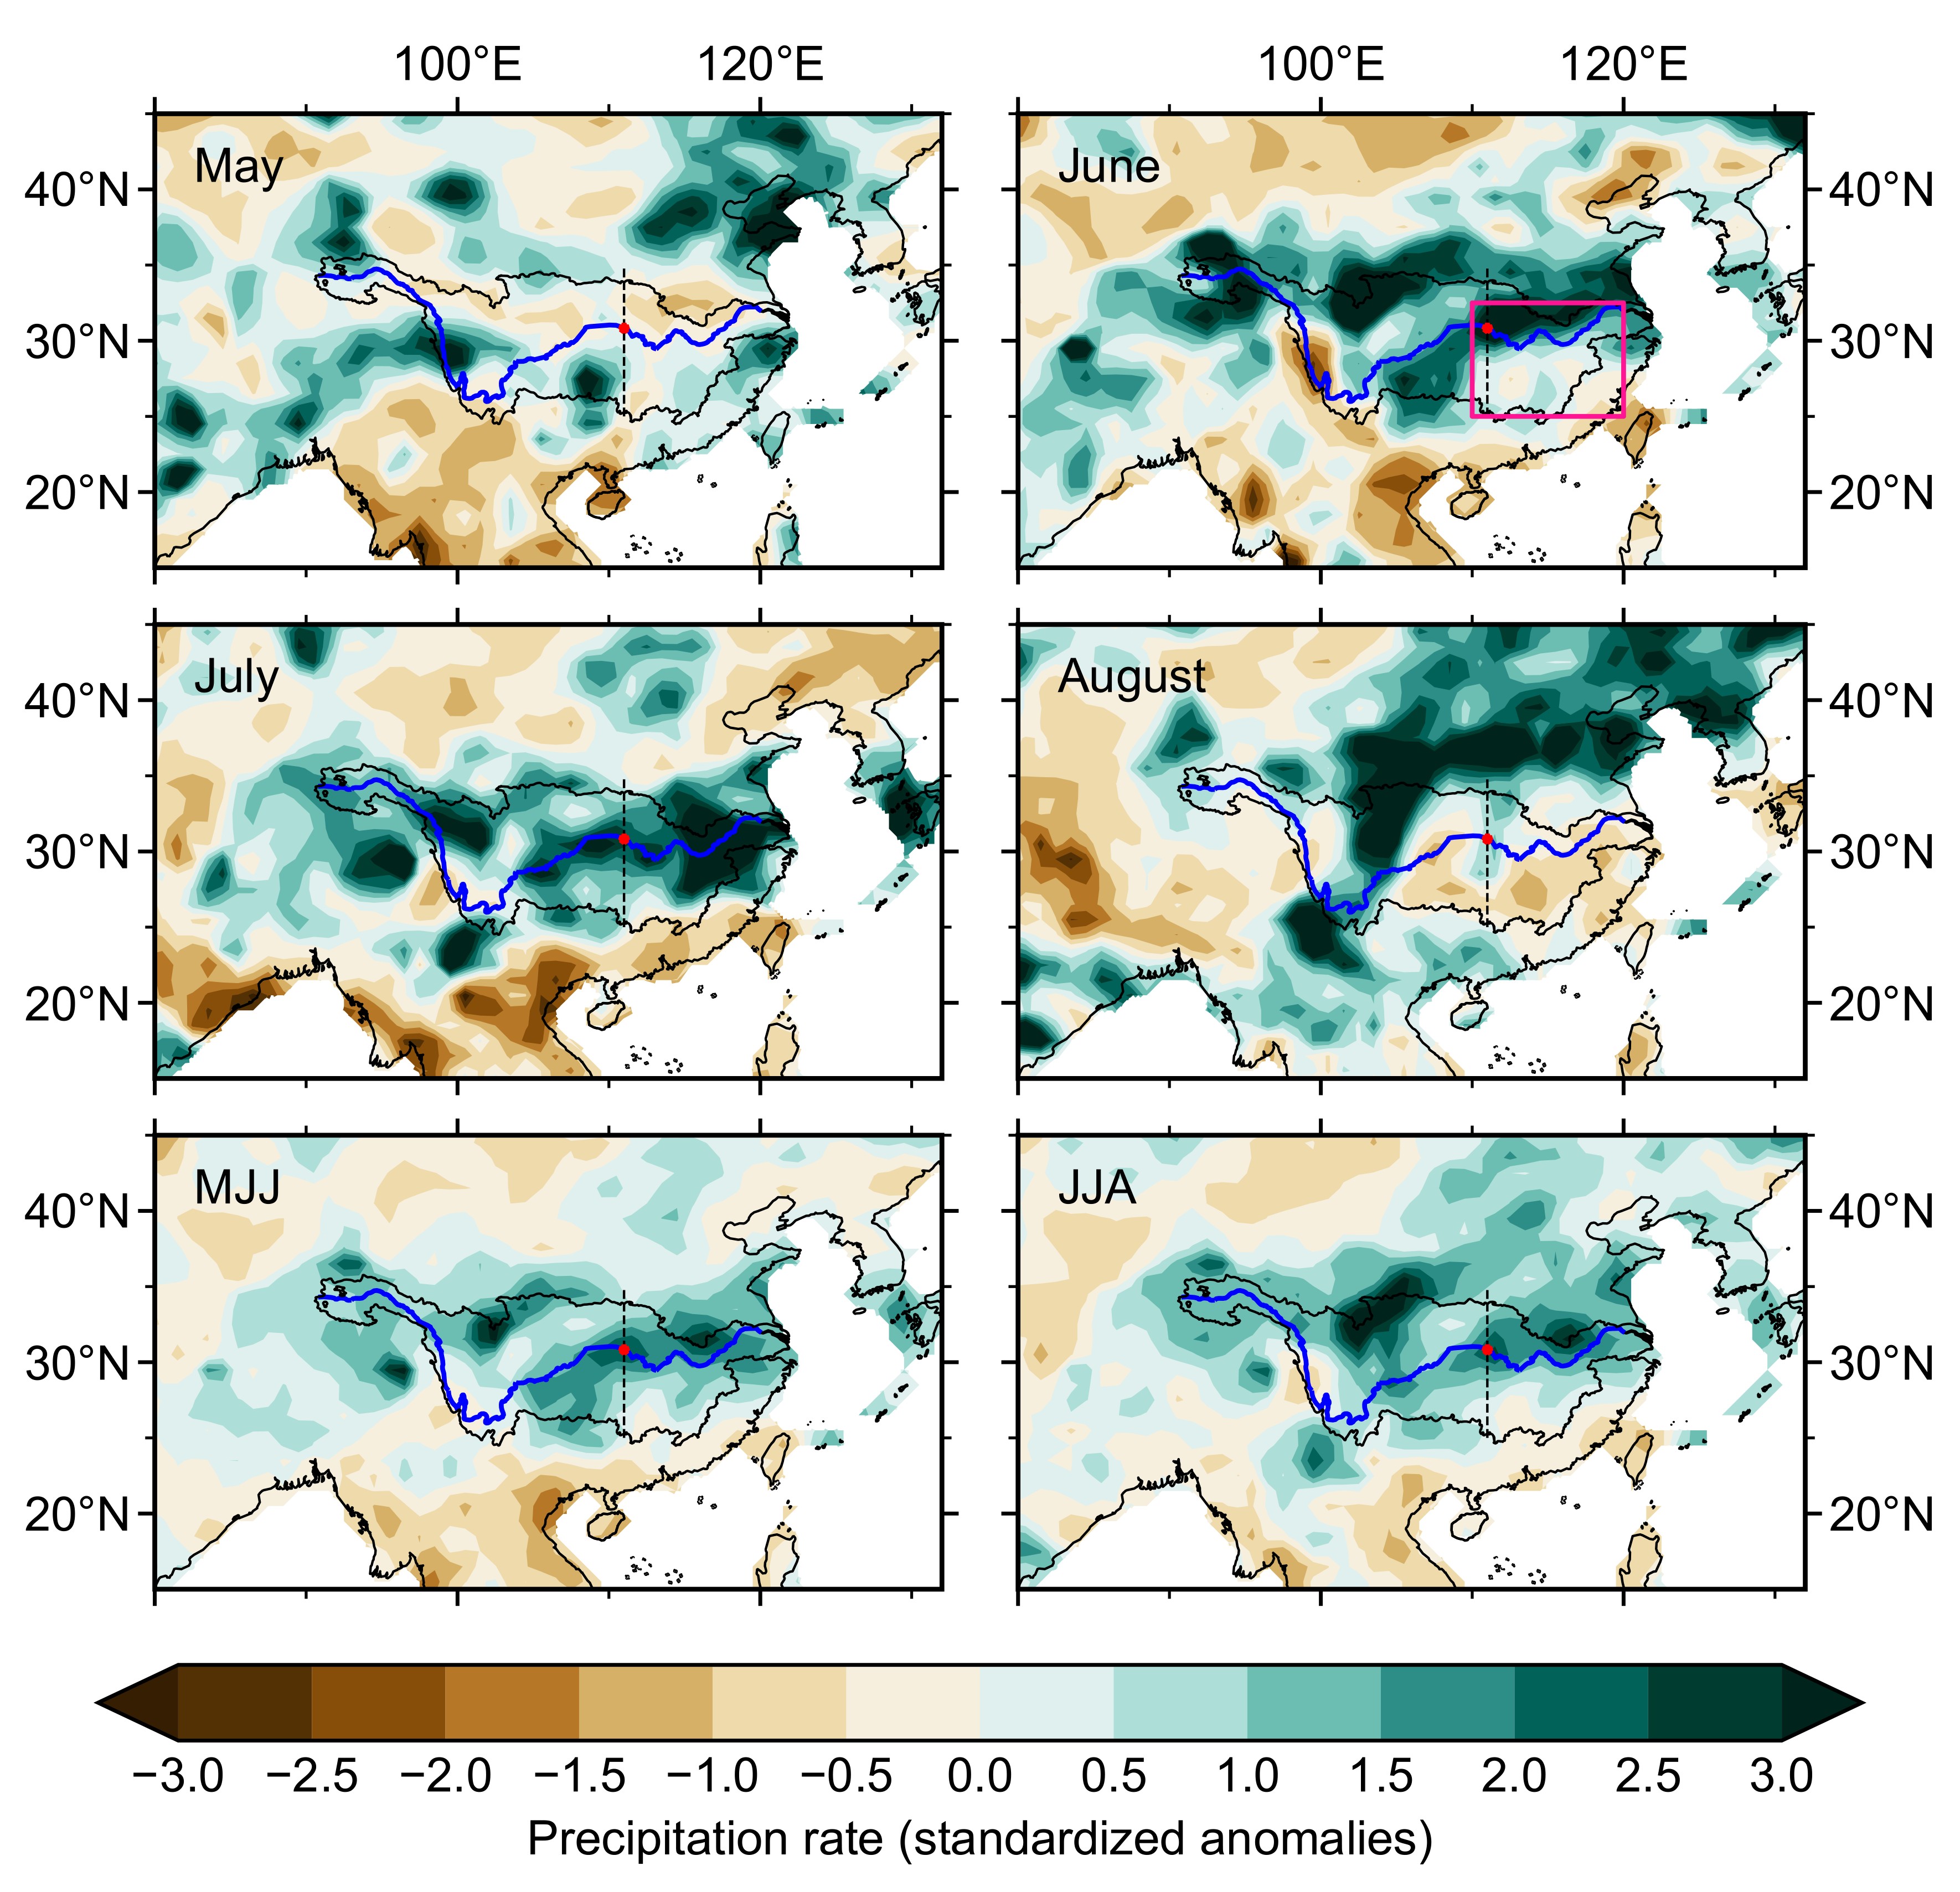 Figure4. Precipitation maps for summer 2020, based on GPCC monitoring data (Schneider et al., 2018). Each month and season (see labels) are shown as standardized anomalies with respect to their 1993–2016 mean and standard deviation from the latest GPCC full data reanalysis (Schneider et al., 2020). The Yangtze River is marked in blue, and the basin is outlined in black, with a black dashed line showing our separation into the Upper Reaches and Middle/Lower Reaches. The box used for the Middle/Lower Reaches forecasts in June is marked in pink on the June map. The location of the Three Gorges Dam is marked in red.
 FigureA1. Forecasts for the whole Yangtze River basin in MJJ 2020 as a function of lead time, as in Fig. 1.
 FigureA2. Forecasts for the whole Yangtze River basin in JJA 2020 as a function of lead time, as in Fig. 2.
The latitudinal progression of the monsoon rainband (mei-yu) exhibited some particular features in summer 2020, which can be seen at the monthly level in Fig. 4 and have been investigated in detail in other studies (Liu et al., 2020; Ding et al., 2021; Qiao et al, 2021): Initially, the mei-yu rainband moved north from May to June, such that the June average map shows the peak rainfall lying north of the Yangtze River itself. However, in late June, the rainfall peak shifted south, before returning to persist at around 30°N, still south of the river, for a prolonged period. Additional north–south oscillations occurred from mid-July, keeping the rainband roughly over the basin; it can be seen lying on the Yangtze River in our plot of the July mean. Finally, in August the rainband returned to its usual progression into northern China. Ding et al. (2021) show that these motions are a manifestation of the QBWO, with strong, early QBWO events leading to the earlier mei-yu onset in June, and a weakening in the QBWO amplitude corresponding to the long persistent phase in July. Clearly, this early onset, long persistence, and late withdrawal contributed significantly to the extremely high net rainfall totals over the Yangtze basin in 2020.
However, the three-month forecasts, based on the EASM index, underpredicted the magnitude of the rainfall anomalies, and our model did not predict 2020 to be an exceptional year with respect to the 1993–2016 period (see the scatter plots in the forecast document attached as Supplementary Information). The forecast EASM anomalies for both MJJ and JJA were about ?1σ: as we have seen with the rainfall forecasts, this gives the correct sign but underpredicts the scale of the observed anomalies, which were ?2.6σ for MJJ and ?2.0σ for JJA.
Li et al. (2021) have examined the wider behavior of the GloSea5 forecast model data, demonstrating that the raw model precipitation forecasts gave anomalies of a similar magnitude as our forecasts (about 1σ). They also showed that the sea surface temperature (SST) anomalies in the Indian Ocean and tropical Pacific in June–July 2020 were well forecast by GloSea5, leading to successful forecasts of the atmospheric circulation in the west north Pacific, as seen in the WPSH and characterised by our EASM index. This is consistent with Takaya et al. (2020) and Zhou et al. (2021), who independently showed how the 2019 extreme positive Indian Ocean Dipole (IOD) event led to basin-wide Indian Ocean warmth by early summer 2020. The forecasting experiments in both studies demonstrate that without this Indian Ocean warmth, the WPSH would have been weaker, and there would have been a smaller enhancement of mei-yu rainfall. However, the seasonal forecasting systems used in both studies (JMA/MRI-CPS2 for Takaya et al. and NMME for Zhou et al.) also significantly underpredicted the rainfall anomaly, to a similar degree as GloSea5.
A consequence of GloSea5’s successful forecasts of the EASM circulation is that our forecasts of June rainfall contained the observed value within their 95% prediction interval. Indeed, our targeting of June alone for one-month forecasts is because of the high levels of skill originating in the EASM circulation (Martin et al., 2020). This also points towards the errors in the three-month forecasts originating in the later summer months.
Liu et al. (2020) identified a southward flow from north China towards the Yangtze basin, corresponding to the temporarily retreating mei-yu front in late June/early July, and the resulting extreme persistence in the Yangtze rainfall. Li et al. (2021) showed that, for the June–July average, this circulation feature was not captured across the GloSea5 forecast ensemble. However, the ensemble members that performed better in terms of Yangtze basin precipitation, did capture this additional southward flow. Li et al. (2021) related the southward flow to an intensification of the westerly jet stream over Asia, which GloSea5 was not able to reproduce. Zhou et al. (2021), on the other hand, were able to produce an intensified westerly jet in June in their atmospheric model experiments driven by SSTs. However they did not produce the wavelike perturbations along the jet seen in observations, implying that these are not driven by SSTs.
These results are consistent with the investigations on subseasonal timescales by Liu et al. (2020) and Qiao et al. (2021), who emphasize the importance of midlatitude drivers for producing the persistence and withdrawal phases of the mei-yu progression in 2020. Liu et al. (2020) traced these phenomena back to a period of negative anomalies in the summer North Atlantic Oscillation (NAO), occurring from late June and throughout July. Both studies demonstrated that the subseasonal forecasts from ECMWF and NCEP were able to predict enhanced (but too small) rainfall anomalies during the northward-advancing onset phase in the early summer, but were unable to capture the midlatitude circulation features leading to the long persistence and late withdrawal phases in July.
The teleconnection between the spring/summer NAO and the EASM is well known (e.g., Linderholm et al., 2011; Tian and Fan, 2012), although Qiao et al. (2021) show a stronger teleconnection with a broader-scale pattern in summer 2020. In any case, this represents a problem for subseasonal and seasonal forecasts, as summertime midlatitude circulation patterns like the summer NAO are not currently well predicted by models. Indeed, as emphasized by Liu et al. (2020), the most skillful forecast components relate to the tropical circulation, whereas skill declines when the midlatitude circulation becomes the dominant driver. A possible route for improvement might be to use SST patterns in the North Atlantic as an additional predictor in our forecasts, as it has been shown that these can drive the Eurasian wave patterns that modulate EASM rainfall (e.g. Yuan et al., 2017; Li et al., 2018).
Our forecasts gave good warnings for above-average rainfall in the Yangtze basin in summer 2020, and particularly in June, based on successful forecasts of the EASM circulation in the west north Pacific as a correct response to the warm Indian Ocean (present in the initial conditions but ultimately deriving from the extreme positive IOD event in autumn 2019). However, the forecast model failed to capture the midlatitude drivers that particularly affected the circulation in later summer, manifesting in changes in the East Asian Jet, which appear to have caused the mei-yu front to persist for longer over the basin resulting in the extreme rainfall and severe impacts. It is interesting that the forecast models used by Liu et al. (2020), Takaya et al. (2020), Qiao et al. (2021), and Zhou et al. (2021), all seem to have similar drawbacks, as well as successes. It is clear therefore that further research is required to improve forecasts of extreme events driven by multiple climate factors.
Acknowledgements. This work and its contributors (Philip BETT, Gill MARTIN, Nick DUNSTONE, Adam SCAIFE, and Hazel THORNTON) were supported by the UK-China Research & Innovation Partnership Fund through the Met Office Climate Science for Service Partnership (CSSP) China as part of the Newton Fund. Chaofan LI was supported by the National Key Research and Development Program of China (Grant No. 2018YFC1506005) and National Natural Science Foundation of China (Grant No. 41775083). This paper contains modified Copernicus Climate Change Service information (2021), and neither the European Commission nor ECMWF is responsible for any use that may be made of that Copernicus information or data.
Open Access This article is distributed under the terms of the Creative Commons Attribution 4.0 International License (
